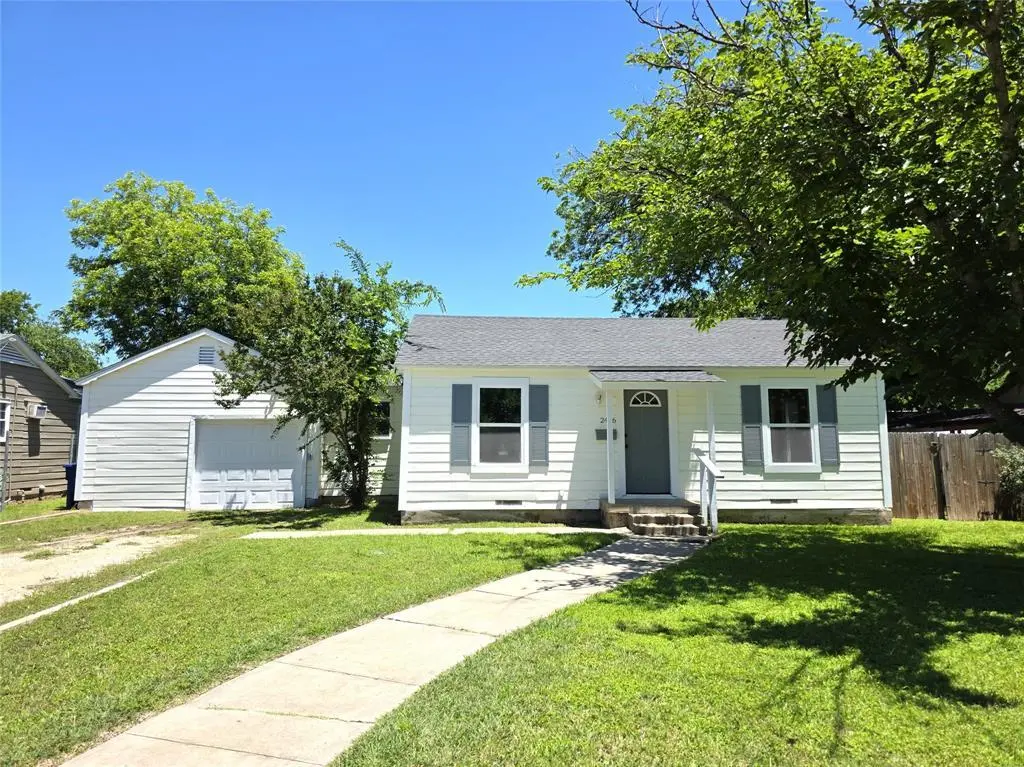
2406 Elizabeth Dr · Brownwood, TX
Flood risk 1/10 · Minimal
- FEMA flood zone
- X (unshaded)
- Chance of flooding over 30 yrs
- 0.0%
- Est. flood insurance / yr
- $507 – $1,088
Fire risk 5/10 · Moderate
- Est. fire insurance / yr
- $1,222 – $2,270
Heat risk 7/10 · Major
- Hot days now (above 107°F)
- 7 days/yr
- Hot days in 30 yrs
- 23 days/yr
Wind risk 6/10 · Moderate
- Chance of severe wind over 30 yrs
- 27.0%
Air-quality risk 1/10 · Minimal
- Unhealthy air days now
- 0 days/yr
- Unhealthy air days in 30 yrs
- 0 days/yr
Risk factors via First Street. Map © Google.
Why this score? — see what drove the D grade
The composite is a weighted blend of 9 inputs, each scored 0–100. Each bar is that input's sub-score; the figure is the points it added to the 100-point composite (weight × sub-score).
- Cash flow +13.4/30.0
- ARV discount +8.8/15.0
- DSCR +4.0/10.0
- Schools +3.6/10.0
- 1% rule +3.5/10.0
- Livability +3.2/5.0
- Rent growth +2.5/5.0
- Condition / age +2.5/5.0
- Appreciation +0.0/10.0
$155,000
🖨 Deal sheet (PDF) 📄 Offer letter ✓ Due diligence
Listing remarks MLS
Older 2BR, 1B home in a desirable neighborhood close to Coggin Park. Original hardwood floors in portion of home. A fixer-upper that needs attention but has great potential. Metal roof, attached garage, and huge fenced backyard. Ideal property for investor, rental, or someone looking to downsize. Needs work, but could be a good home to live in or as an investment property.
Key facts
- Central hvac
- Separate dining room
- Updated windows
Tags
Property features AI
Finance
- Financial info: Accepts cash, conventional, FHA, VA, USDA loans and 1031 exchanges
- HOA & community: No homeowners association
Exterior
- Parking: Attached garage; Garage door opener; Garage faces front; 1 covered/garage space (garage dimensions ~18' x 21')
- Utilities: City water; City sewer; Electricity connected; Overhead utilities
- Home design: Single-family residence; Attached property; One story; Deed restrictions
- Construction: Siding and wood construction; Year built not provided
- Exterior features: Few trees; Interior lot; Barbed wire/metal fencing; Asphalt exterior access (driveway/streets)
Interior
- Kitchen: Gas range; Refrigerator
- Bedrooms: 3 bedrooms (all on the main level); Primary bedroom on the main level
- Bathrooms: 1 full bathroom (on the main level)
- Heating & cooling: Central heating (natural gas); Central air conditioning (electric); Ceiling fans
- Interior features: Built-in features; Cable TV available; High-speed internet available; One living area; One dining area; Total of 7 rooms; Single-story layout
- Laundry & utility: Individual water meter
Neighborhood map
What this means for you Summary
Snapshot
- This is a 3-bed/1.0-bath single-family listed at $155k.
Deal economics
- At list price, monthly cash flow is $2 ($24/yr) — positive.
- The deal already cash-flows at list — no discount required.
- To meet the 1% rule (rent ≥ 1% of price), the offer needs to be $132k (15.0% below list).
- Recommended offer: $132k (15.0% below list) — sets the bar for 1% rule.
- Cap rate 6.3% vs local median 3.8% in Brownwood — top-decile yield for the area; either an underpriced asset or a hidden risk that comps aren't pricing in. Stress-test before assuming the spread holds.
Location & tenants
- Location reads 64/100 on livability (#781 in TX) — a middle-class / working-renter tenant base. Strengths: cost of living A+, housing A+; Watch: crime D+, health & safety D+, amenities F.
- Brownwood ISD (town): math 45% / reading 41% proficiency, ranked #344 of 826 in TX (top 42%) — families likely to look elsewhere, expect single-tenant / working-renter base with shorter leases.
- Zoned schools: East El (math 64% / reading 54%, grade B-, #409 of 4,322 statewide, top 10%, 316 students, 79% FRL); Brownwood Middle (math 39% / reading 41%, grade F, #646 of 1,662 statewide, top 40%, 485 students, 64% FRL) — zoned schools average 72% FRL vs 54% district-wide (18 pts higher); higher-poverty schools than district average — tighter screening recommended.
- Market conditions: 379 active listings in the ZIP; 4 comparable units currently listed for rent nearby; rentals lingering (median 46d on market — plan ~5-8 weeks vacancy on turnover, expect pricing pressure); 100% of comp listings sitting > 30 days — soft ceiling on asking rent; 142 units permitted in Brown County in 2024 (0 in 5+ unit buildings).
Forward outlook
- Local home prices are declining (-3.0%/yr); year-one equity from $1k of loan paydown is wiped out by about $5k of value loss. Plan a longer hold.
Negotiation context
- It's been on market 41 days — a 3% lower offer ($150k) is reasonable based on typical stale-listing flexibility.
- 2 sale attempts since 11y ago with the ask held roughly flat each time — persistent listings suggest the price (not the market) is what's stuck; bring a comps-based counter.
Risks & watch-outs
- Climate carrying-cost: major wind risk, 27% chance of damaging wind over 30y; moderate wildfire risk; extreme-heat days projected 7→23/yr by 2055 (HVAC capex compounding) — expect insurance premiums to compound above CPI over the hold.
Questions for the listing agent
- It's been on market 41 days. Have you received any prior offers? Is the seller open to a 15% concession, seller financing, or rate buy-down credit?
- Is there a deadline driving the sale (1031 exchange, divorce, estate, relocation)? That informs how much negotiation room exists.
- Schools are F-rated, which usually means shorter tenancies and higher turnover. Who's the typical renter profile here, and what's been the actual vacancy rate?
- Crime grade is D in this area — have there been break-ins, vandalism, or insurance claims at this property in the last 3 years? What carrier currently insures it and at what premium?
- The area grade is low — what's the realistic commute time and amenity access for the typical tenant pool here? Any planned neighborhood developments (good or bad) we should know about?
- What's the average days-on-market for RENTAL listings here right now (not sales)? A rising rental-DOM trend means longer vacancies and softer asking-rent achievability than the comps imply.
- What's the recent tenant-quality profile in this submarket — average credit score on applications, eviction rate, late-payment / NSF rate, and stable-employment percentage? A property-management company in the area should have these aggregated.
- How much new for-sale + rental construction is in the pipeline within 1–3 miles? Heavy new supply typically softens prices + rents 12–24 months out; constrained supply supports both.
Investment metrics
- 1% rule
- 0.85% ✗
- Cap rate
- 6.31%
- Cash-on-cash
- 0.05%
- DSCR
- 1.00
- GRM
- 9.8
CMA / ARV
- ARV (on-the-fly)
- $159,572
- Comps found
- 12
Show comp detail 12 sales within ~0.75 mi
| Address | Dist | Beds/Ba | Sqft | Sold | Price | $/sf | Match |
|---|---|---|---|---|---|---|---|
| 2503 Belmeade St | 0.14mi | 3/1.0 | 1,072 (-7%) | 3mo | $135,000 | $126 | 80 |
| 2204 Berkley St | 0.28mi | 3/1.0 | 1,128 (-2%) | 6mo | $134,900 | $120 | 79 |
| 1007 Lackey St | 0.21mi | 2/1.0 (-1) | 1,111 (-3%) | 4mo | $139,900 | $126 | 77 |
| 2711 Elizabeth Dr | 0.30mi | 3/1.0 | 1,200 (+4%) | 3mo | $149,000 | $124 | 76 |
| 2607 1st St | 0.16mi | 3/1.0 | 1,247 (+9%) | 3mo | $142,500 | $114 | 75 |
| 2302 Berkley St | 0.25mi | 3/1.0 | 1,276 (+11%) | 1mo | $178,000 | $139 | 69 |
| 2306 Austin Ave | 0.29mi | 3/2.0 | 1,260 (+10%) | 1mo | $204,000 | $162 | 66 |
| 2901 Austin Ave | 0.50mi | 2/1.0 (-1) | 1,130 (-2%) | 4mo | $198,500 | $176 | 66 |
| 2506 Vincent St | 0.34mi | 3/1.5 | 1,056 (-8%) | 4mo | $148,900 | $141 | 66 |
| 2703 1st St | 0.23mi | 3/2.0 | 1,271 (+11%) | 5mo | $139,900 | $110 | 64 |
| 2103 9th St | 0.59mi | 3/2.0 | 1,062 (-8%) | 2mo | $185,000 | $174 | 55 |
| 1609 2nd St | 0.69mi | 3/2.0 | 1,300 (+13%) | 4mo | $220,000 | $169 | 39 |
Match score weights: distance 35% · size 25% · config 20% · recency 20%. Top-matched comps best support the ARV.
Projected returns pro-forma
-3.0% appreciation · 3.0% rent growth · sell at horizon
- IRR
- -16.2%
- Equity multiple
- 0.42×
- Total profit
- $-24,991
- Equity at exit
- $23,111
- IRR
- -7.9%
- Equity multiple
- 0.50×
- Total profit
- $-21,600
- Equity at exit
- $13,402
Cash invested: $43,400 (down + closing). Projections, not guarantees.
Landlord ↔ Tenant lean methodology
- Overall (STATE)
- 87 Strongly Landlord-Friendly
- State Texas
- 87 Strongly Landlord-Friendly · R+5
- County
- — inherits STATE
- City
- — inherits STATE
ZIP-level market 76801
- Active inventory
- 379
- Price-to-rent
- 9.8×
Monthly cashflow live
- Estimated rent
- $1,317 medium interval (Pro) →
- Mortgage (P&I)
- −$813
- Tax from tax record
- −$161 /mo · $1,936/yr
- Insurance
- −$65
- HOA
- −$0
- Lot rent
- −$0
- Vacancy / Maint / Mgmt
- −$277
- Net cashflow
- $2
Break-even live
Sensitivity live
| Price | -10% $90 | -5% $46 | +0% $2 | +5% $-42 | +10% $-86 |
|---|---|---|---|---|---|
| Rent | -10% $-102 | -5% $-50 | +0% $2 | +5% $54 | +10% $106 |
| Rate | -1.0pp $80 | -0.5pp $41 | base $2 | +0.5pp $-38 | +1.0pp $-79 |
UW: 25.0% down · 7.5% · 30yr · 1.5% tax · 5.0% vac · 8.0% maint · 8.0% mgmt
Financing live
Cash to close
- Down payment
- $38,750
- Closing costs
- $4,650
- Reserves months
- —
- Total cash needed
- —
Loan-product check · same deal, 3 products live
Conventional
25% down · 7.5% · 30yr
- Down + closing
- —
- Monthly P&I
- —
- Monthly cashflow
- —
- DSCR
- —
- Eligible?
- —
Personal DTI + credit; lowest rate.
DSCR
20% down · 8.5% · 30yr
- Down + closing
- —
- Monthly P&I
- —
- Monthly cashflow
- —
- DSCR
- —
- Eligible?
- —
No personal income docs; deal must DSCR.
Hard money
10% down · 12.0% · 12mo
- Down + closing
- —
- Monthly P&I
- —
- Monthly cashflow
- —
- DSCR
- —
- Eligible?
- —
Short-term bridge; refi at stabilization.
Rent comps 4 comps
| Address | Beds | Baths | Sqft | Rent | $/sqft | DOM | Units | Dist |
|---|---|---|---|---|---|---|---|---|
| 2411 13th St Brownwood, TX | 3.0 | 2.0 | 1466 | $1,800 | $1.23 | 46d | 1 | 0.85mi |
| 2001 Brady Ave Unit Booker 703 Brownwood, TX | 2.0 | 1.0 | 1247 | $1,045 | $0.84 | 46d | 1 | 1.28mi |
| 2001 Brady Ave Unit 1705 Austin-A Brownwood, TX | 2.0 | 1.0 | 1070 | $1,095 | $1.02 | 46d | 1 | 1.28mi |
| 3201 Stephen F Austin Dr Lot 130 Brownwood, TX | 3.0 | 2.0 | 1120 | $1,200 | $1.07 | 46d | 1 | 1.34mi |
Listing history 25 events
-
2026-06-22days on market $155,000 Active 41 DOM
-
2026-06-21days on market $155,000 Active 40 DOM
-
2026-06-21days on market $155,000 Active 39 DOM
-
2026-06-18days on market $155,000 Active 37 DOM
-
2026-06-17days on market $155,000 Active 36 DOM
-
2026-06-16days on market $155,000 Active 35 DOM
-
2026-06-15days on market $155,000 Active 34 DOM
-
2026-06-13days on market $155,000 Active 32 DOM
-
2026-06-12days on market $155,000 Active 31 DOM
-
2026-06-09days on market $155,000 Active 28 DOM
-
2026-06-08days on market $155,000 Active 27 DOM
-
2026-06-08days on market $155,000 Active 26 DOM
-
2026-06-07days on market $155,000 Active 25 DOM
-
2026-06-03days on market $155,000 Active 22 DOM
-
2026-06-02days on market $155,000 Active 21 DOM
-
2026-06-01days on market $155,000 Active 20 DOM
-
2026-05-31days on market $155,000 Active 19 DOM
-
2026-05-11$155,000 Active
-
2015-08-27historical 375-char remark
Show marketing remark (375 chars)
Older 2BR, 1B home in a desirable neighborhood close to Coggin Park. Original hardwood floors in portion of home. A fixer-upper that needs attention but has great potential. Metal roof, attached garage, and huge fenced backyard. Ideal property for investor, rental, or someone looking to downsize. Needs work, but could be a good home to live in or as an investment property.
-
2015-08-26soldstatus Sold 375-char remark
Show marketing remark (375 chars)
Older 2BR, 1B home in a desirable neighborhood close to Coggin Park. Original hardwood floors in portion of home. A fixer-upper that needs attention but has great potential. Metal roof, attached garage, and huge fenced backyard. Ideal property for investor, rental, or someone looking to downsize. Needs work, but could be a good home to live in or as an investment property.
-
2015-08-26soldstatus
Show marketing remark (375 chars)
Older 2BR, 1B home in a desirable neighborhood close to Coggin Park. Original hardwood floors in portion of home. A fixer-upper that needs attention but has great potential. Metal roof, attached garage, and huge fenced backyard. Ideal property for investor, rental, or someone looking to downsize. Needs work, but could be a good home to live in or as an investment property.
-
2015-08-03status Pending 375-char remark
Show marketing remark (375 chars)
Older 2BR, 1B home in a desirable neighborhood close to Coggin Park. Original hardwood floors in portion of home. A fixer-upper that needs attention but has great potential. Metal roof, attached garage, and huge fenced backyard. Ideal property for investor, rental, or someone looking to downsize. Needs work, but could be a good home to live in or as an investment property.
-
2015-07-11$38,500 Active 375-char remark
Show marketing remark (375 chars)
Older 2BR, 1B home in a desirable neighborhood close to Coggin Park. Original hardwood floors in portion of home. A fixer-upper that needs attention but has great potential. Metal roof, attached garage, and huge fenced backyard. Ideal property for investor, rental, or someone looking to downsize. Needs work, but could be a good home to live in or as an investment property.
-
2006-06-20soldstatus
-
1994-02-09soldstatus
ⓘ Source: listings_history table (triggers on properties + properties_extension) + one-shot
backfill from property_details.listing_events for pre-trigger history.
Tax reassessment forecast TX · Resets to sale price
- Current annual tax
- $1,936 · $161/mo
- Projected year-2 tax
- $2,836 · $236/mo
- Expected delta
- +$901/yr (+$75/mo · 46.5%)
ⓘ Screening estimate from a state-policy table — verify with the county assessor before closing.
Climate risk First Street
- Flood 1/10 Low FEMA zone X (unshaded) · 0% chance over 30 yrs
- Wildfire 5/10 Major
- Heat 7/10 Severe 7 d/yr ≥107°F today · 23 d/yr by 30 yrs out
- Wind 6/10 Major 27% chance of damaging wind over 30 yrs
- Air quality 1/10 Low 0 unhealthy d/yr today · 0 by 30 yrs out
Nearby sold comps map
Loading sold comps map…
Walkable amenities ~0.75 mi
Loading nearby amenities…
Taxation est. · year 1
- Rental income
- $15,808
- − Mortgage interest
- −$8,682
- − Property taxes
- −$1,936
- − Insurance
- −$775
- − Repairs & maintenance
- −$1,265
- − Management
- −$1,265
- − Depreciation
- −$4,509
- Taxable loss
- −$2,623
- Est. tax savings @ 24.0%
- +$630
- After-tax cash flow
- $653/yr
For passive investors: Depreciation is non-cash, so a rental often shows a tax loss while cash-flowing — sheltering income. Rental losses are passive: they offset passive income freely, and up to $25,000/yr can offset ordinary (W-2) income if you actively participate and your MAGI is under $100k (phasing out to $0 by $150k); unused losses carry forward. On sale, claimed depreciation is recaptured at up to 25%, and gains may owe capital-gains tax (a 1031 exchange can defer both). Figures are a year-1 estimate at your 24.0% rate — not tax advice; consult a CPA.
Schools (NCES district)
- District
- Brownwood ISD
- NCES district ID
- 4811700
- Math proficiency
- 45% ▲ 4.00%
- Reading proficiency
- 41% ▲ 1.00%
- Median HH income
- $37,395
- Composite
- 35.8/100
- National rank
- #4833
- State rank
- #344 of 826 in TX
Livability — Brownwood
- Score
- 64/100
- State rank
- #781
- US rank
- #14230
Category grades
Schools grade is shown separately in the Schools card above.
Census & demographics
- Census place
- Brownwood, TX
- Population (ZIP)
- 25,152
Population outlook (Brown County) Hauer SSP2
- Today (2025)
- 38,381 people
- By 2030
- 38,288 · -0.2%
- By 2040
- 38,120 · -0.7%
- By 2050
- 38,227 · -0.4%
- By 2075
- 39,362 · +2.6%
- By 2100
- 39,171 · +2.1%
Race, ethnicity, and origin ACS 2023
- Neighborhood character
- Predominantly White (66%)
- Race & ethnicity
- White 66% Hispanic / Latino 26% Two or more races 15% Black 4%
- Hispanic origin (detail)
- Mexican 23%
- Common ancestry
- Italian 12% Slovak 2% Lithuanian 1%
- Foreign-born
- 4% · Canada
- Languages at home
- 82% English-only · Spanish 17%
Political lean MEDSL · Brown
- 2024 margin
- Solid R (+73.9) · D 12.7% · R 86.6%
- 2008→2024 swing
- -12.5pp toward R · 2008: -61.5pp · 2024: -73.9pp
- All cycles
- 2024: R+73.9 2020: R+72.6 2016: R+74.5 2012: R+71.7 2008: R+61.5
Not yet ingested
- Civics
- —
Market trends
- HPI YoY
- ▼ -121.52%
- Current HPI
- 164.0992
- Rent YoY
- —
- Metro
- —
- State GDP YoY
- ▲ 3.95%
- F500 in state
- 110
Industry mix (Fortune 500 HQ in TX)
| Industry | F500 HQs | Revenue |
|---|---|---|
| Energy | 16 | $1,198B |
|
||
| Technology | 5 | $198B |
|
||
| Engineering / Construction | 4 | $72B |
|
||
| Energy Services | 3 | $60B |
|
||
| Utilities | 3 | $41B |
|
||
| Healthcare | 2 | $330B |
|
||
Price history
+302.6% since first listed8 events — show timeline
- 2026-05-11 Listed $155,000 NTREIS
- 2015-08-27 Listing Removed — NTREIS
- 2015-08-26 Sold (Public Records) — Public Records
- 2015-08-26 Sold (MLS) — NTREIS
- 2015-08-03 Pending — NTREIS
- 2015-07-11 Listed $38,500 NTREIS
- 2006-06-20 Sold (Public Records) — Public Records
- 1994-02-09 Sold (Public Records) — Public Records
Property tax history
+6.3%/yrLatest (2025): $1,936 · +0.2% YoY. Source: county tax records.
Cash-flow waterfall
monthlySold comps — $/sqft
last 12 mo · ≤1 miLoading sold comps…