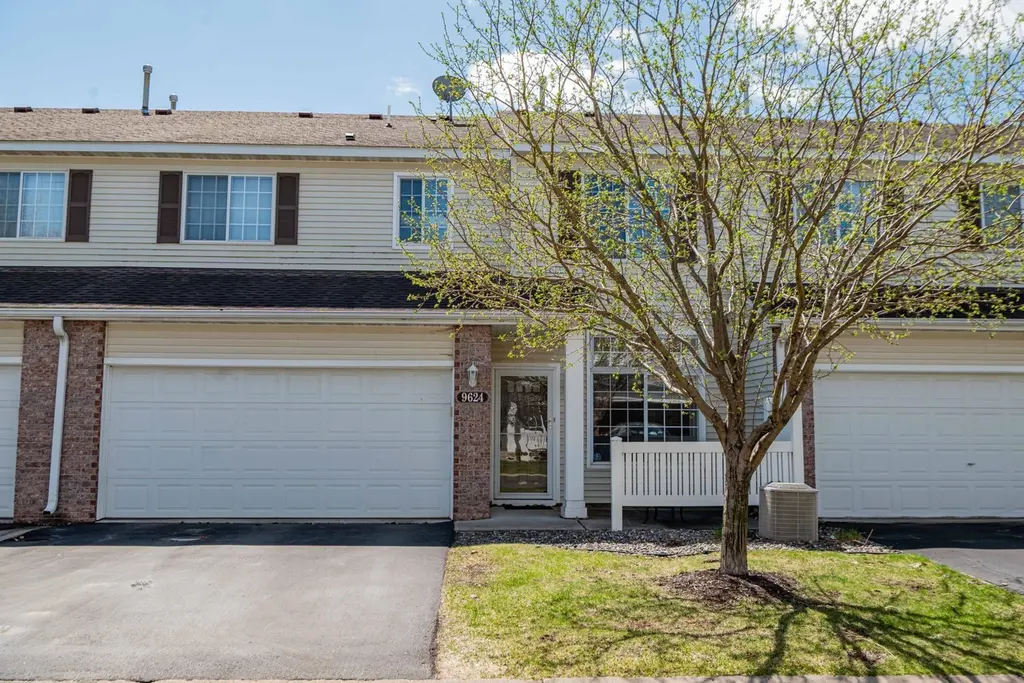
9624 Peony Ln N · Maple Grove, MN
Flood risk 1/10 · Minimal
- FEMA flood zone
- X (unshaded)
- Chance of flooding over 30 yrs
- 0.0%
- Est. flood insurance / yr
- $507 – $1,088
Fire risk 1/10 · Minimal
- Est. fire insurance / yr
- $888 – $1,650
Heat risk 2/10 · Minimal
- Hot days now (above 98°F)
- 7 days/yr
- Hot days in 30 yrs
- 14 days/yr
Wind risk 2/10 · Minimal
- Chance of severe wind over 30 yrs
- —
Air-quality risk 2/10 · Minimal
- Unhealthy air days now
- 1 days/yr
- Unhealthy air days in 30 yrs
- 1 days/yr
Risk factors via First Street. Map © Google.
Why this score? — see what drove the D grade
The composite is a weighted blend of 9 inputs, each scored 0–100. Each bar is that input's sub-score; the figure is the points it added to the 100-point composite (weight × sub-score).
- ARV discount +12.1/15.0
- Cash flow +9.1/30.0
- Schools +4.2/10.0
- Rent growth +4.0/5.0
- Livability +4.0/5.0
- 1% rule +3.9/10.0
- DSCR +2.5/10.0
- Condition / age +2.5/5.0
- Appreciation +0.0/10.0
$258,900
🖨 Deal sheet (PDF) 📄 Offer letter ✓ Due diligence
Listing remarks MLS
HIGHLY UPGRADED TOWN HOME IN DESIRABLE MAPLE GROVE LOCATION! FEATURES INCLUDE REAL OAK & BAMBOO HWD FLOORS, NEW CARPET, STAINLESS STEEL APPLIANCES, TILE COUNTER TOPS, LG MASTER BEDROOM W/LG WALK IN CLOSET. HOME THEATRE SET UP IN LOFT. THIS IS A MUST SEE!
Key facts
- $290 HOA
- 2 garage spots
- Built 2001
Property features AI
Finance
- HOA & community: HOA: New Concepts Management; Monthly association fee (around $290) covering hazard insurance, grounds maintenance and professional management; Community amenities include patio
Exterior
- Parking: Attached garage with garage door opener; 2-car garage
- Utilities: City water; City sewer; Natural gas
- Home design: Attached residential property; Two levels; Main entry on main level
- Construction: Slab foundation; Foundation area approximately 620
- Exterior features: Stone and vinyl exterior; Patio; Common lot
Interior
- Kitchen: Cooktop; Range; Microwave; Dishwasher; Garbage disposal; Refrigerator
- Bedrooms: Two bedrooms (primary bedrooms located on upper level)
- Flooring: Hardwood floors; Tile floors
- Bathrooms: One full bath (upper level); One half bath (main floor)
- Heating & cooling: Forced air heating; Central air conditioning
- Interior features: Ceiling fan(s); Natural woodwork; Walk-in closet; Patio; In-ground sprinkler
- Laundry & utility: Washer and dryer included; Second-floor laundry; Washer/Dryer hookup
Neighborhood map
What this means for you Summary
Snapshot
- This is a 2-bed/1.5-bath condo listed at $259k.
Deal economics
- At list price, monthly cash flow is $-199 ($-2k/yr) — negative.
- To cash-flow at today's rent, offer at most $224k (13.6% below list).
- To meet the 1% rule (rent ≥ 1% of price), the offer needs to be $230k (11.2% below list).
- Recommended offer: $224k (13.6% below list) — sets the bar for cash-flow.
- Cap rate 5.4% vs local median 3.4% in Maple Grove — top-decile yield for the area; either an underpriced asset or a hidden risk that comps aren't pricing in. Stress-test before assuming the spread holds.
Location & tenants
- Location reads 81/100 on livability (#54 in MN, #1,353 nationally) — a professional / high-income tenant draw. Strengths: commute A+, employment A+, housing A+; Watch: amenities D, cost of living D.
- Osseo Public School District (suburban): math 42% / reading 51% proficiency, ranked #129 of 301 in MN (top 43%) — families likely to look elsewhere, expect single-tenant / working-renter base with shorter leases.
- Zoned schools: Rush Creek Elementary (math 81% / reading 78%, grade A, #12 of 857 statewide, top 2%, 774 students, 18% FRL); Maple Grove Middle School (math 45% / reading 58%, grade C, #65 of 258 statewide, top 26%, 1,598 students, 30% FRL); Maple Grove Senior High (math 53% / reading 69%, grade C+, #42 of 471 statewide, top 9%, 2,324 students, 21% FRL).
- Zoned-school proficiency averages 64% at this address vs 46% district-wide (+18 pts) — the actual schools serving this property are materially stronger than the Osseo Public School District average implies; a family-tenant draw the district grade alone would hide.
- Market conditions: Rents rising fast (+5.9%/yr); 304 active listings in the ZIP; 7 comparable units currently listed for rent nearby; rentals leasing fast (median 1d on market — plan ~1-2 weeks tenant-placement turnaround); high-income renter base; 4,651 units permitted in Hennepin County in 2024 (2,443 in 5+ unit buildings).
- This rent is only 18% of the median local income ($154k/yr) — well below the 30% rent-burden line; pricing power to push rent on renewal without tenant pushback.
Forward outlook
- Local home prices are declining (-3.0%/yr); year-one equity from $2k of loan paydown is wiped out by about $8k of value loss. Plan a longer hold.
- Hennepin County population projected at +30% by 2050 — long-run rental-demand tailwind backs the buy-and-hold thesis.
Negotiation context
- It's been on market 45 days — a 3% lower offer ($251k) is reasonable based on typical stale-listing flexibility.
- 5 sale attempts since 17y ago with the ask held roughly flat each time — persistent listings suggest the price (not the market) is what's stuck; bring a comps-based counter.
- Current owner paid $155k; list at $259k implies a 67% gain — meaningful room to come down on a strong offer.
Questions for the listing agent
- What do current leases actually rent for vs. the listed asking? Can we see a recent rent roll and the last 12 months of T-12 income?
- It's been on market 45 days. Have you received any prior offers? Is the seller open to a 14% concession, seller financing, or rate buy-down credit?
- What does the HOA fee cover, when was the last increase, and are there any pending special assessments or reserve-fund shortfalls?
- Any open or pending special assessments — roof, HVAC, plumbing, elevator, façade? What's the per-unit balance and payoff schedule, and is the seller paying it off at close or rolling it to the buyer?
- Is there a deadline driving the sale (1031 exchange, divorce, estate, relocation)? That informs how much negotiation room exists.
- Schools are A-rated — typically a magnet for longer-tenancy family renters. What's the average tenant stay here, and is there a school-zone premium baked into asking?
- The area grade is low — what's the realistic commute time and amenity access for the typical tenant pool here? Any planned neighborhood developments (good or bad) we should know about?
- What's the average days-on-market for RENTAL listings here right now (not sales)? A rising rental-DOM trend means longer vacancies and softer asking-rent achievability than the comps imply.
- What's the recent tenant-quality profile in this submarket — average credit score on applications, eviction rate, late-payment / NSF rate, and stable-employment percentage? A property-management company in the area should have these aggregated.
- How much new apartment / multifamily construction is in the pipeline within 1–3 miles? Heavy new supply (>2% of stock underway) typically softens rents 12–24 months out; light construction supports rent growth.
Investment metrics
- 1% rule
- 0.89% ✗
- Cap rate
- 5.37%
- Cash-on-cash
- -3.29%
- DSCR
- 0.85
- GRM
- 9.4
CMA / ARV
- ARV (median comp)
- $288,609
- List price
- $258,900
- Delta
- -10.29%
- Verdict
- UNDERPRICED
- Comps
- 2 within 2.0 mi
Projected returns pro-forma
-3.0% appreciation · 5.86% rent growth · sell at horizon
- IRR
- -18.2%
- Equity multiple
- 0.34×
- Total profit
- $-47,642
- Equity at exit
- $38,603
- IRR
- -5.1%
- Equity multiple
- 0.62×
- Total profit
- $-27,482
- Equity at exit
- $22,385
Cash invested: $72,492 (down + closing). Projections, not guarantees.
Landlord ↔ Tenant lean methodology
- Overall (STATE)
- 46 Balanced
- State Minnesota
- 46 Balanced · D+2
- County
- — inherits STATE
- City
- — inherits STATE
ZIP-level market 55311
- Rents YoY
- 5.9%
- Active inventory
- 304
- Price-to-rent
- 9.4×
Monthly cashflow live
- Estimated rent
- $2,299 high interval (Pro) →
- Mortgage (P&I)
- −$1,358
- Tax from tax record
- −$259 /mo · $3,112/yr
- Insurance
- −$108
- HOA
- −$290
- Vacancy / Maint / Mgmt
- −$483
- Net cashflow
- $-199
Break-even live
Sensitivity live
| Price | -10% $-52 | -5% $-126 | +0% $-199 | +5% $-272 | +10% $-345 |
|---|---|---|---|---|---|
| Rent | -10% $-380 | -5% $-290 | +0% $-199 | +5% $-108 | +10% $-17 |
| Rate | -1.0pp $-68 | -0.5pp $-133 | base $-199 | +0.5pp $-266 | +1.0pp $-334 |
UW: 25.0% down · 7.5% · 30yr · 1.5% tax · 5.0% vac · 8.0% maint · 8.0% mgmt
Financing live
Cash to close
- Down payment
- $64,725
- Closing costs
- $7,767
- Reserves months
- —
- Total cash needed
- —
Loan-product check · same deal, 3 products live
Conventional
25% down · 7.5% · 30yr
- Down + closing
- —
- Monthly P&I
- —
- Monthly cashflow
- —
- DSCR
- —
- Eligible?
- —
Personal DTI + credit; lowest rate.
DSCR
20% down · 8.5% · 30yr
- Down + closing
- —
- Monthly P&I
- —
- Monthly cashflow
- —
- DSCR
- —
- Eligible?
- —
No personal income docs; deal must DSCR.
Hard money
10% down · 12.0% · 12mo
- Down + closing
- —
- Monthly P&I
- —
- Monthly cashflow
- —
- DSCR
- —
- Eligible?
- —
Short-term bridge; refi at stabilization.
Rent comps 7 comps
| Address | Beds | Baths | Sqft | Rent | $/sqft | DOM | Units | Dist |
|---|---|---|---|---|---|---|---|---|
| 18037 96th Ave N Maple Grove, MN | 2.0 | 2.0 | 1597 | $2,150 | $1.35 | 19d | 1 | 0.08mi |
| 9585 Queensland Ln N Maple Grove, MN | 2.0 | 2.0 | 1489 | $2,195 | $1.47 | 16d | 1 | 0.16mi |
| 17250 98th Way N Maple Grove, MN | 2.0–3.0 | 1.5–2.5 | 1705 | $2,565 | $1.50 | 1d | 78 | 0.50mi |
| 9820 Garland Ln N Maple Grove, MN | 3.0 | 1.0–2.0 | 990 | $2,424 | $2.45 | 0d | 36 | 0.57mi |
| 9325 Garland Ave Maple Grove, MN | 1.0–3.0 | 1.0–2.0 | 1094 | $2,108 | $1.93 | 0d | 20 | 0.63mi |
| 17610 102nd Pl N Maple Grove, MN | 2.0–4.0 | 2.5–3.5 | 2021 | $2,799 | $1.38 | 0d | 16 | 0.83mi |
| 9775 Grove Cir N Maple Grove, MN | 1.0–2.0 | 1.0–2.0 | 1116 | $2,970 | $2.66 | 1d | 3 | 1.08mi |
HOA detail condo
- Monthly dues
- $290 · $3,480/yr
- Assessments
- None detected in remarks — confirm with the listing agent.
Listing history 29 events
-
2026-06-21days on market $258,900 Active 45 DOM
-
2026-06-18days on market $258,900 Active 42 DOM
-
2026-06-17days on market $258,900 Active 41 DOM
-
2026-06-16days on market $258,900 Active 40 DOM
-
2026-06-15days on market $258,900 Active 39 DOM
-
2026-06-13pricedays on market $258,900 Active 37 DOM
-
2026-06-09days on market $259,500 Active 33 DOM
-
2026-06-08days on market $259,500 Active 32 DOM
-
2026-06-07days on market $259,500 Active 31 DOM
-
2026-06-04days on market $259,500 Active 28 DOM
-
2026-06-03days on market $259,500 Active 27 DOM
-
2026-06-02days on market $259,500 Active 26 DOM
-
2026-06-01days on market $259,500 Active 25 DOM
-
2026-05-31pricedays on market $259,500 Active 24 DOM
-
2026-05-08$259,900 Active 235-char remark
-
2026-05-02historical $259,900 235-char remark
-
2015-08-13soldstatus $155,000
-
2015-08-12soldstatus $155,000 Sold 258-char remark
Show marketing remark (258 chars)
HIGHLY UPGRADED TOWN HOME IN DESIRABLE MAPLE GROVE LOCATION! FEATURES INCLUDE REAL OAK & BAMBOO HWD FLOORS, NEW CARPET, STAINLESS STEEL APPLIANCES, TILE COUNTER TOPS, LG MASTER BEDROOM W/LG WALK IN CLOSET. HOME THEATRE SET UP IN LOFT. THIS IS A MUST SEE!
-
2015-07-31historical Contingent - Inspection 258-char remark
Show marketing remark (258 chars)
HIGHLY UPGRADED TOWN HOME IN DESIRABLE MAPLE GROVE LOCATION! FEATURES INCLUDE REAL OAK & BAMBOO HWD FLOORS, NEW CARPET, STAINLESS STEEL APPLIANCES, TILE COUNTER TOPS, LG MASTER BEDROOM W/LG WALK IN CLOSET. HOME THEATRE SET UP IN LOFT. THIS IS A MUST SEE!
-
2015-07-28$159,900 Active 258-char remark
Show marketing remark (258 chars)
HIGHLY UPGRADED TOWN HOME IN DESIRABLE MAPLE GROVE LOCATION! FEATURES INCLUDE REAL OAK & BAMBOO HWD FLOORS, NEW CARPET, STAINLESS STEEL APPLIANCES, TILE COUNTER TOPS, LG MASTER BEDROOM W/LG WALK IN CLOSET. HOME THEATRE SET UP IN LOFT. THIS IS A MUST SEE!
-
2014-08-04historical
-
2014-06-14price $159,900
-
2014-05-05$164,900 Active
-
2009-08-21soldstatus $148,000
-
2009-07-30soldstatus $148,000
-
2009-06-27historical
-
2009-06-01$149,900
-
2009-05-28historical
-
2009-04-10$155,000
ⓘ Source: listings_history table (triggers on properties + properties_extension) + one-shot
backfill from property_details.listing_events for pre-trigger history.
Tax reassessment forecast MN · Partial reset (capped growth)
- Current annual tax
- $3,112 · $259/mo
- Projected year-2 tax
- $3,112 · $259/mo
- Expected delta
- $0/yr ($0/mo · 0.0%)
ⓘ Screening estimate from a state-policy table — verify with the county assessor before closing.
Climate risk First Street
- Flood 1/10 Low FEMA zone X (unshaded) · 0% chance over 30 yrs
- Wildfire 1/10 Low
- Heat 2/10 Low 7 d/yr ≥98°F today · 14 d/yr by 30 yrs out
- Wind 2/10 Low
- Air quality 2/10 Low 1 unhealthy d/yr today · 1 by 30 yrs out
Nearby sold comps map
Loading sold comps map…
Walkable amenities ~0.75 mi
Loading nearby amenities…
Taxation est. · year 1
- Rental income
- $27,585
- − Mortgage interest
- −$14,502
- − Property taxes
- −$3,112
- − Insurance
- −$1,294
- − Repairs & maintenance
- −$2,207
- − Management
- −$2,207
- − HOA
- −$3,480
- − Depreciation
- −$7,532
- Taxable loss
- −$6,749
- Est. tax savings @ 24.0%
- +$1,620
- After-tax cash flow
- $-767/yr
For passive investors: Depreciation is non-cash, so a rental often shows a tax loss while cash-flowing — sheltering income. Rental losses are passive: they offset passive income freely, and up to $25,000/yr can offset ordinary (W-2) income if you actively participate and your MAGI is under $100k (phasing out to $0 by $150k); unused losses carry forward. On sale, claimed depreciation is recaptured at up to 25%, and gains may owe capital-gains tax (a 1031 exchange can defer both). Figures are a year-1 estimate at your 24.0% rate — not tax advice; consult a CPA.
Schools (NCES district)
- District
- Osseo Public School District
- NCES district ID
- 2725200
- Math proficiency
- 42% ▼ -7.00%
- Reading proficiency
- 51% ▼ -4.00%
- Median HH income
- $76,168
- Composite
- 42.35/100
- National rank
- #3250
- State rank
- #129 of 301 in MN
Livability — Maple Grove
- Score
- 81/100
- State rank
- #54
- US rank
- #1353
Category grades
Schools grade is shown separately in the Schools card above.
Census & demographics
- Census place
- Maple Grove, MN
- County
- Hennepin County · 1,150,272 people
- City population
- 77,762
- Metro
- Minneapolis-St. Paul-Bloomington, MN-WI
- Population (ZIP)
- 38,472
- Household income
- $153,568
- Rent vs Own
- Severe rent burden
- 497.0
Population outlook (Hennepin County) Hauer SSP2
- Today (2025)
- 1,405,227 people
- By 2030
- 1,492,650 · +6.2%
- By 2040
- 1,660,157 · +18.1%
- By 2050
- 1,823,498 · +29.8%
- By 2075
- 2,221,283 · +58.1%
- By 2100
- 2,509,976 · +78.6%
Race, ethnicity, and origin ACS 2023
- Neighborhood character
- Predominantly White (80%)
- Race & ethnicity
- White 80% Asian 8% Black 7% Two or more races 3% Hispanic / Latino 1%
- Common ancestry
- Portuguese 12% Lithuanian 4% Romanian 4%
- Foreign-born
- 12% · Canada, Vietnam, South Korea
- Languages at home
- 87% English-only · Other Indo-European 3% Vietnamese 1% Chinese 1%
Political lean MEDSL · Hennepin
- 2024 margin
- Solid D (+42.6) · D 70.2% · R 27.5% · Other 2.3%
- 2008→2024 swing
- +14.0pp toward D · 2008: 28.6pp · 2024: 42.6pp
- All cycles
- 2024: D+42.6 2020: D+43.2 2016: D+35.3 2012: D+27.1 2008: D+28.6
Not yet ingested
- Civics
- —
Market trends
- HPI YoY
- ▼ -181.69%
- Current HPI
- 213.3896
- Rent YoY
- ▲ 5.86%
- Metro
- Minneapolis-St. Paul-Bloomington, MN-WI
- State GDP YoY
- ▲ 2.41%
- F500 in state
- 34
Industry mix (Fortune 500 HQ in MN)
| Industry | F500 HQs | Revenue |
|---|---|---|
| Healthcare | 2 | $407B |
|
||
| Retail | 2 | $150B |
|
||
| Consumer Goods | 2 | $32B |
|
||
| Industrial Machinery | 2 | $6B |
|
||
| Agriculture | 1 | $40B |
|
||
| Healthcare / Medical Devices | 1 | $32B |
|
||
Price history
+67.0% since first listed17 events — show timeline
- 2026-06-12 Price Changed $258,900 NORTHSTARMLS as Distributed by MLS Grid
- 2026-05-30 Price Changed $259,500 NORTHSTARMLS as Distributed by MLS Grid
- 2026-05-08 Listed $259,900 NORTHSTARMLS as Distributed by MLS Grid
- 2026-05-02 Coming Soon $259,900 NORTHSTARMLS as Distributed by MLS Grid
- 2015-08-13 Sold (Public Records) $155,000 Public Records
- 2015-08-12 Sold (MLS) $155,000 NORTHSTARMLS as Distributed by MLS Grid
- 2015-07-31 Contingent — NORTHSTARMLS as Distributed by MLS Grid
- 2015-07-28 Listed $159,900 NORTHSTARMLS as Distributed by MLS Grid
- 2014-08-04 Listing Removed — NORTHSTARMLS as Distributed by MLS Grid
- 2014-06-14 Price Changed $159,900 NORTHSTARMLS as Distributed by MLS Grid
- 2014-05-05 Listed $164,900 NORTHSTARMLS as Distributed by MLS Grid
- 2009-08-21 Sold (Public Records) $148,000 Public Records
- 2009-07-30 Sold (MLS) $148,000 NORTHSTARMLS as Distributed by MLS Grid
- 2009-06-27 Listing Removed — NORTHSTARMLS as Distributed by MLS Grid
- 2009-06-01 Listed $149,900 NORTHSTARMLS as Distributed by MLS Grid
- 2009-05-28 Listing Removed — NORTHSTARMLS as Distributed by MLS Grid
- 2009-04-10 Listed $155,000 NORTHSTARMLS as Distributed by MLS Grid
Property tax history
+4.9%/yrLatest (2025): $3,112 · +4.1% YoY. Source: county tax records.
Cash-flow waterfall
monthlySold comps — $/sqft
last 12 mo · ≤1 miLoading sold comps…