 Multi-family
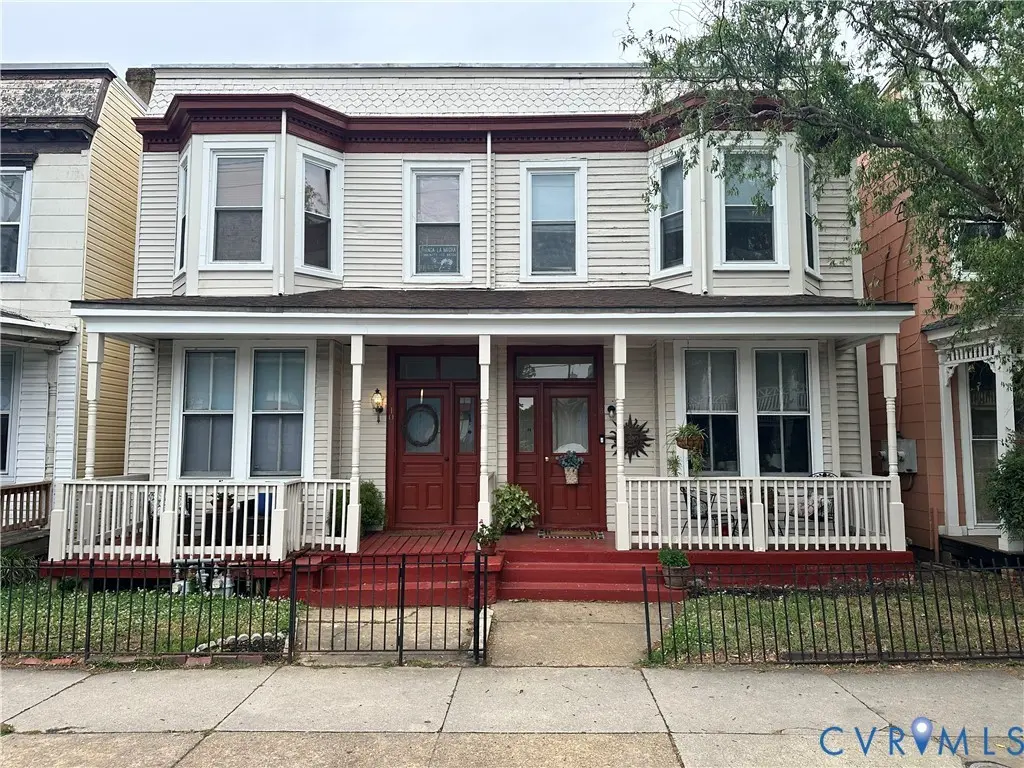
8 S Robinson St · Richmond, VA
Flood risk 1/10 · Minimal
- FEMA flood zone
- X (unshaded)
- Chance of flooding over 30 yrs
- 0.0%
- Est. flood insurance / yr
- $507 – $1,088
Fire risk 1/10 · Minimal
- Est. fire insurance / yr
- $666 – $1,236
Heat risk 8/10 · Major
- Hot days now (above 105°F)
- 7 days/yr
- Hot days in 30 yrs
- 17 days/yr
Wind risk 6/10 · Moderate
- Chance of severe wind over 30 yrs
- 27.0%
Air-quality risk 2/10 · Minimal
- Unhealthy air days now
- 0 days/yr
- Unhealthy air days in 30 yrs
- 1 days/yr
Risk factors via First Street. Map © Google.
Why this score? — see what drove the C- grade
The composite is a weighted blend of 9 inputs, each scored 0–100. Each bar is that input's sub-score; the figure is the points it added to the 100-point composite (weight × sub-score).
- Cash flow +15.0/30.0
- ARV discount +15.0/15.0
- DSCR +4.6/10.0
- Livability +4.2/5.0
- Rent growth +4.1/5.0
- 1% rule +3.4/10.0
- Schools +3.3/10.0
- Condition / age +2.5/5.0
- Appreciation +0.0/10.0
$399,950
🖨 Deal sheet (PDF) 📄 Offer letter ✓ Due diligence
Multi-family units
County records classify this as Multi-Family (2-4 Unit). Listing-text estimate: 1 unit. estimate disagrees with records
Listing remarks
CALLING ALL INVESTORS AND OWNER OCCUPANTS: OPPORTUNITY IS KNOCKING! Located in Richmond's Fan District and priced to sell (at just over the 2025 real estate tax assessment). Offered along with attached 10 South Robinson. .. buy one or both. Two bedroom, 1 bath units with off street parking and conveniently located near everything that's RVA. Living room & kitchen feature an open living space; units feature gas cooking & heating with central air. Other than water & sewer (paid by the owner or billed to the tenants) electric & gas utilizes are metered separately.
Key facts
- Off street parking
- Gas cooking
- Open living space
Tags
Property features AI
Finance
- Financial info: Property contains 2 rental units; Gross monthly income reported as $2,300; Each unit currently rents for $1,150; Both units are leased (one lease expires September 30, 2026; the other expires July 31, 2026)
Exterior
- Parking: Open parking (lot and on-street)
- Utilities: Public water; Public sewer; Natural gas
- Home design: 2-story building
- Construction: Frame construction with drywall, vinyl siding and wood siding
- Exterior features: On-street parking available; Parking lot; Zoned B-6
Interior
- Kitchen: Gas stove in each unit; Refrigerator in each unit
- Bedrooms: Two 2-bedroom units
- Bathrooms: Each unit has 1 full bathroom
- Heating & cooling: Central air in each unit; Forced hot air (natural gas) heating
- Interior features: Crawl space basement
- Laundry & utility: Gas water heater
Neighborhood map
What this means for you Summary
Snapshot
- This is a 4-bed/2.0-bath multifamily listed at $400k.
Deal economics
- At list price, monthly cash flow is $127 ($2k/yr) — positive.
- The deal already cash-flows at list — no discount required.
- To meet the 1% rule (rent ≥ 1% of price), the offer needs to be $337k (15.7% below list).
- Recommended offer: $337k (15.7% below list) — sets the bar for 1% rule.
- Cap rate 6.7% vs local median 3.2% in Richmond — top-decile yield for the area; either an underpriced asset or a hidden risk that comps aren't pricing in. Stress-test before assuming the spread holds.
Location & tenants
- Location reads 84/100 on livability (#33 in VA, #793 nationally) — a professional / high-income tenant draw. Strengths: amenities A+, commute A+, health & safety A+; Watch: crime D-.
- Richmond City Public School District (urban): math 32% / reading 47% proficiency, ranked #123 of 131 in VA (top 94%) — families likely to look elsewhere, expect single-tenant / working-renter base with shorter leases; 74% free/reduced lunch — lower-income household profile, screen leases tightly.
- Zoned schools: William Fox Elementary (math 15% / reading 24%, grade F, #1,082 of 1,108 statewide, top 98%, 326 students, 99% FRL); Binford Middle (math 37% / reading 47%, grade D-, #295 of 342 statewide, top 87%, 452 students, 99% FRL); Thomas Jefferson High (math 62% / reading 87%, grade B+, #107 of 319 statewide, top 37%, 816 students, 80% FRL) — zoned schools average 93% FRL vs 74% district-wide (19 pts higher); higher-poverty schools than district average — tighter screening recommended.
- Market conditions: Rents rising fast (+6.5%/yr); 176 active listings in the ZIP; 27 comparable units currently listed for rent nearby; rentals at typical pace (median 25d on market — plan ~3-4 weeks tenant-placement turnaround); 41% of comp listings sitting > 30 days — soft ceiling on asking rent; 2,540 units permitted in Richmond city in 2024 (2,077 in 5+ unit buildings).
- At $3,373/mo this rent would consume 66% of the median local household income ($61k/yr) (locally 2962% of renters already pay >50% of income on rent) — very limited rent-growth headroom before tenants either downsize or default.
Forward outlook
- Local home prices are declining (-3.0%/yr); year-one equity from $3k of loan paydown is wiped out by about $12k of value loss. Plan a longer hold.
- Richmond County population projected at +40% by 2050 — long-run rental-demand tailwind backs the buy-and-hold thesis.
Negotiation context
- It's been on market 41 days — a 3% lower offer ($388k) is reasonable based on typical stale-listing flexibility.
- 2 sale attempts since 3y ago with the ask held roughly flat each time — persistent listings suggest the price (not the market) is what's stuck; bring a comps-based counter.
Risks & watch-outs
- Watch-outs: built in 1920 — expect roof / HVAC / electrical / plumbing capex.
- Climate carrying-cost: major wind risk, 27% chance of damaging wind over 30y; extreme-heat days projected 7→17/yr by 2055 (HVAC capex compounding) — expect insurance premiums to compound above CPI over the hold.
Questions for the listing agent
- It's been on market 41 days. Have you received any prior offers? Is the seller open to a 16% concession, seller financing, or rate buy-down credit?
- Built in 1920 — when were the roof, HVAC, electrical panel, plumbing, and water heater last replaced?
- Is there a deadline driving the sale (1031 exchange, divorce, estate, relocation)? That informs how much negotiation room exists.
- Schools are A-rated — typically a magnet for longer-tenancy family renters. What's the average tenant stay here, and is there a school-zone premium baked into asking?
- Crime grade is D in this area — have there been break-ins, vandalism, or insurance claims at this property in the last 3 years? What carrier currently insures it and at what premium?
- What's the average days-on-market for RENTAL listings here right now (not sales)? A rising rental-DOM trend means longer vacancies and softer asking-rent achievability than the comps imply.
- What's the recent tenant-quality profile in this submarket — average credit score on applications, eviction rate, late-payment / NSF rate, and stable-employment percentage? A property-management company in the area should have these aggregated.
- How much new apartment / multifamily construction is in the pipeline within 1–3 miles? Heavy new supply (>2% of stock underway) typically softens rents 12–24 months out; light construction supports rent growth.
Investment metrics
- 1% rule
- 0.84% ✗
- Cap rate
- 6.67%
- Cash-on-cash
- 1.36%
- DSCR
- 1.06
- GRM
- 9.9
CMA / ARV
- ARV (median comp)
- $661,283
- List price
- $399,950
- Delta
- -39.52%
- Verdict
- UNDERPRICED
- Comps
- 20 within 1.0 mi
Projected returns pro-forma
-3.0% appreciation · 6.54% rent growth · sell at horizon
- IRR
- -10.6%
- Equity multiple
- 0.60×
- Total profit
- $-44,391
- Equity at exit
- $59,634
- IRR
- 2.8%
- Equity multiple
- 1.23×
- Total profit
- $26,284
- Equity at exit
- $34,580
Cash invested: $111,986 (down + closing). Projections, not guarantees.
Landlord ↔ Tenant lean methodology
- Overall (STATE)
- 55 Moderately Landlord-Leaning
- State Virginia
- 55 Moderately Landlord-Leaning · D+2
- County
- — inherits STATE
- City
- — inherits STATE
ZIP-level market 23220
- Rents YoY
- 6.5%
- Active inventory
- 176
- Price-to-rent
- 19.8×
Monthly cashflow live
- Estimated rent
- $3,373 high interval (Pro) →
- Mortgage (P&I)
- −$2,097
- Tax from tax record
- −$274 /mo · $3,288/yr
- Insurance
- −$167
- HOA
- −$0
- Vacancy / Maint / Mgmt
- −$708
- Net cashflow
- $127
Break-even live
Sensitivity live
| Price | -10% $353 | -5% $240 | +0% $127 | +5% $13 | +10% $-100 |
|---|---|---|---|---|---|
| Rent | -10% $-140 | -5% $-7 | +0% $127 | +5% $260 | +10% $393 |
| Rate | -1.0pp $328 | -0.5pp $228 | base $127 | +0.5pp $23 | +1.0pp $-82 |
2-unit breakdown (identical units grouped — click to expand)
| Units | Beds | Baths | Est. rent |
|---|---|---|---|
| 2× units | 2 | 1 | $3,374 |
| #1 | 2 | 1 | $1,687 |
| #2 | 2 | 1 | $1,687 |
| Total (2 units) | $3,373 | ||
UW: 25.0% down · 7.5% · 30yr · 1.5% tax · 5.0% vac · 8.0% maint · 8.0% mgmt
Financing live
Cash to close
- Down payment
- $99,988
- Closing costs
- $11,998
- Reserves months
- —
- Total cash needed
- —
Loan-product check · same deal, 3 products live
Conventional
25% down · 7.5% · 30yr
- Down + closing
- —
- Monthly P&I
- —
- Monthly cashflow
- —
- DSCR
- —
- Eligible?
- —
Personal DTI + credit; lowest rate.
DSCR
20% down · 8.5% · 30yr
- Down + closing
- —
- Monthly P&I
- —
- Monthly cashflow
- —
- DSCR
- —
- Eligible?
- —
No personal income docs; deal must DSCR.
Hard money
10% down · 12.0% · 12mo
- Down + closing
- —
- Monthly P&I
- —
- Monthly cashflow
- —
- DSCR
- —
- Eligible?
- —
Short-term bridge; refi at stabilization.
Rent comps 27 comps
| Address | Beds | Baths | Sqft | Rent | $/sqft | DOM | Units | Dist |
|---|---|---|---|---|---|---|---|---|
| 103 S Davis Ave Richmond, VA | 1.0–3.0 | 1.0–2.0 | 1020 | $2,899 | $2.84 | 3d | 28 | 0.12mi |
| 2 N Mulberry St Unit 2A N Mulberry Richmond, VA | 3.0 | 1.0 | 1229 | $2,150 | $1.75 | 6d | 1 | 0.12mi |
| 3 Strawberry St Richmond, VA | 3.0 | 1.5 | 1920 | $2,500 | $1.30 | 18d | 1 | 0.26mi |
| 2312 Rosewood Ave Unit 1545975P Richmond, VA | 3.0 | 2.0 | 1786 | $3,949 | $2.21 | 16d | 1 | 0.31mi |
| 2004 Hanover Ave Richmond, VA | 3.0 | 2.5 | 2549 | $3,950 | $1.55 | 45d | 1 | 0.55mi |
| 1627 W Main St Apt 1 Richmond, VA | 3.0 | 2.0 | 1500 | $2,400 | $1.60 | 45d | 1 | 0.69mi |
| 1713 Jacquelin St Richmond, VA | 3.0 | 2.5 | 1768 | $2,512 | $1.42 | 25d | 1 | 0.72mi |
| 2034 W Grace St Unit B Richmond, VA | 4.0 | 2.0 | 2500 | $3,200 | $1.28 | 45d | 1 | 0.75mi |
| 2034 W Grace St Unit A Richmond, VA | 4.0 | 2.0 | 2450 | $2,950 | $1.20 | 45d | 1 | 0.75mi |
| 102 N Lombardy St Unit 2 Richmond, VA | 3.0 | 2.0 | 1460 | $2,490 | $1.71 | 25d | 1 | 0.76mi |
| 1601 W Cary St Unit 1 Richmond, VA | 3.0 | 1.0 | 1477 | $1,800 | $1.22 | 45d | 1 | 0.77mi |
| 1 N Harvie St Unit B Richmond, VA | 3.0 | 2.0 | 1662 | $3,500 | $2.11 | 6d | 1 | 0.92mi |
| 500 Bethany Dr Richmond, VA | 3.0 | 2.0 | 1471 | $2,300 | $1.56 | 6d | 1 | 0.94mi |
| 508 Bethany Dr Richmond, VA | 3.0 | 1.5 | 1456 | $2,349 | $1.61 | 45d | 1 | 0.95mi |
| 1317 Dance St Richmond, VA | 5.0 | 3.0 | 1444 | $3,800 | $2.63 | 4d | 1 | 1.02mi |
| 3323 W Grace St Richmond, VA | 3.0 | 3.0 | 2274 | $4,250 | $1.87 | 6d | 1 | 1.02mi |
| 1103 W Franklin St Unit A Richmond, VA | 3.0 | 1.5 | 1250 | $1,695 | $1.36 | 25d | 1 | 1.04mi |
| 900 N Allen Ave Richmond, VA | 1.0–3.0 | 1.0–3.0 | 1286 | $3,800 | $2.95 | 3d | 30 | 1.09mi |
| 1417 W Leigh St Richmond, VA | 4.0 | 3.0 | 1512 | $2,600 | $1.72 | 45d | 1 | 1.23mi |
| 1013 N Lombardy St Unit B Richmond, VA | 3.0 | 2.5 | 2460 | $3,030 | $1.23 | 45d | 1 | 1.24mi |
| 1128 W Marshall St Richmond, VA | 4.0 | 3.0 | 1658 | $3,000 | $1.81 | 25d | 1 | 1.26mi |
| 1128 W Marshall St Unit Na Richmond, VA | 4.0 | 3.0 | 1658 | $3,000 | $1.81 | 45d | 1 | 1.26mi |
| 1601 Overbrook Rd Richmond, VA | 1.0–3.0 | 1.0–2.0 | 922 | $3,172 | $3.44 | 3d | 25 | 1.28mi |
| 1500 W Moore St Unit B Richmond, VA | 3.0 | 2.5 | 2500 | $3,700 | $1.48 | 45d | 1 | 1.30mi |
| 2402 Ownby Ln Richmond, VA | 3.0 | 2.5 | 2253 | $3,488 | $1.55 | 3d | 4 | 1.31mi |
| 1661 Roseneath Rd Richmond, VA | 3.0 | 1.0–2.5 | 1062 | $4,132 | $3.89 | 5d | 23 | 1.34mi |
| 2435 Ownby Ln Richmond, VA | 3.0 | 2.5 | 2516 | $3,500 | $1.39 | 45d | 1 | 1.35mi |
Listing history 18 events
-
2026-06-21days on market $399,950 Active 41 DOM
-
2026-06-18days on market $399,950 Active 38 DOM
-
2026-06-17days on market $399,950 Active 37 DOM
-
2026-06-16days on market $399,950 Active 36 DOM
-
2026-06-15days on market $399,950 Active 35 DOM
-
2026-06-13days on market $399,950 Active 33 DOM
-
2026-06-10days on market $399,950 Active 30 DOM
-
2026-06-09days on market $399,950 Active 29 DOM
-
2026-06-08days on market $399,950 Active 28 DOM
-
2026-06-07days on market $399,950 Active 27 DOM
-
2026-06-03days on market $399,950 Active 23 DOM
-
2026-06-02days on market $399,950 Active 22 DOM
-
2026-06-01days on market $399,950 Active 21 DOM
-
2026-05-31days on market $399,950 Active 20 DOM
-
2026-05-11$399,950 Active 591-char remark
-
2023-04-01price $409,000
-
2023-04-01$409,999 Active
-
2022-02-03price $950
ⓘ Source: listings_history table (triggers on properties + properties_extension) + one-shot
backfill from property_details.listing_events for pre-trigger history.
Tax reassessment forecast VA · Resets to sale price
- Current annual tax
- $3,288 · $274/mo
- Projected year-2 tax
- $3,288 · $274/mo
- Expected delta
- $0/yr ($0/mo · 0.0%)
ⓘ Screening estimate from a state-policy table — verify with the county assessor before closing.
Climate risk First Street
- Flood 1/10 Low FEMA zone X (unshaded) · 0% chance over 30 yrs
- Wildfire 1/10 Low
- Heat 8/10 Severe 7 d/yr ≥105°F today · 17 d/yr by 30 yrs out
- Wind 6/10 Major 27% chance of damaging wind over 30 yrs
- Air quality 2/10 Low 0 unhealthy d/yr today · 1 by 30 yrs out
Nearby sold comps map
Loading sold comps map…
Walkable amenities ~0.75 mi
Loading nearby amenities…
Taxation est. · year 1
- Rental income
- $40,476
- − Mortgage interest
- −$22,403
- − Property taxes
- −$3,288
- − Insurance
- −$2,000
- − Repairs & maintenance
- −$3,238
- − Management
- −$3,238
- − Depreciation
- −$11,635
- Taxable loss
- −$5,326
- Est. tax savings @ 24.0%
- +$1,278
- After-tax cash flow
- $2,798/yr
For passive investors: Depreciation is non-cash, so a rental often shows a tax loss while cash-flowing — sheltering income. Rental losses are passive: they offset passive income freely, and up to $25,000/yr can offset ordinary (W-2) income if you actively participate and your MAGI is under $100k (phasing out to $0 by $150k); unused losses carry forward. On sale, claimed depreciation is recaptured at up to 25%, and gains may owe capital-gains tax (a 1031 exchange can defer both). Figures are a year-1 estimate at your 24.0% rate — not tax advice; consult a CPA.
Schools (NCES district)
- District
- Richmond City Public School District
- NCES district ID
- 5103240
- Math proficiency
- 32% ▼ -24.00%
- Reading proficiency
- 47% ▼ -9.00%
- Median HH income
- $40,276
- Composite
- 33.09/100
- National rank
- #5564
- State rank
- #123 of 131 in VA
Livability — Richmond
- Score
- 84/100
- State rank
- #33
- US rank
- #793
Category grades
Schools grade is shown separately in the Schools card above.
Census & demographics
- Census place
- Richmond, VA
- County
- Richmond City · 178,280 people
- City population
- 287,109
- Metro
- Richmond, VA
- Population (ZIP)
- 34,671
- Household income
- $61,381
- Rent vs Own
- Severe rent burden
- 2962.0
Population outlook (Richmond County) Hauer SSP2
- Today (2025)
- 262,263 people
- By 2030
- 284,503 · +8.5%
- By 2040
- 327,353 · +24.8%
- By 2050
- 367,946 · +40.3%
- By 2075
- 449,560 · +71.4%
- By 2100
- 500,301 · +90.8%
Race, ethnicity, and origin ACS 2023
- Neighborhood character
- Diverse neighborhood (Simpson 0.60)
- Race & ethnicity
- White 54% Black 31% Two or more races 7% Hispanic / Latino 6% Asian 4%
- Hispanic origin (detail)
- Mexican 1%
- Common ancestry
- Slovak 2% Romanian 2% Italian 2%
- Foreign-born
- 6% · Canada, China
- Languages at home
- 91% English-only · Spanish 4% Other Indo-European 1% Chinese 1%
Political lean MEDSL · Richmond
- 2024 margin
- Solid D (+66.3) · D 82.0% · R 15.8% · Other 2.2%
- 2008→2024 swing
- +7.2pp toward D · 2008: 59.1pp · 2024: 66.3pp
- All cycles
- 2024: D+66.3 2020: D+68.0 2016: D+63.8 2012: D+55.7 2008: D+59.1
Not yet ingested
- Civics
- —
Market trends
- HPI YoY
- ▼ -772.63%
- Current HPI
- 348.5085
- Rent YoY
- ▲ 6.54%
- Metro
- Richmond, VA
- State GDP YoY
- ▲ 2.40%
- F500 in state
- 50
Industry mix (Fortune 500 HQ in VA)
| Industry | F500 HQs | Revenue |
|---|---|---|
| Aerospace / Defense | 4 | $236B |
|
||
| Technology / Defense | 3 | $32B |
|
||
| Financial Services | 2 | $176B |
|
||
| Utilities | 2 | $27B |
|
||
| Insurance | 2 | $25B |
|
||
| Technology | 2 | $15B |
|
||
Price history
-2.5% since first listed4 events — show timeline
- 2026-05-11 Listed $399,950 CVRMLS
- 2023-04-01 Price Changed $409,000 CVRMLS
- 2023-04-01 Listed $409,999 CVRMLS
- 2022-02-03 Price Changed $950 RENT.
Property tax history
+10.2%/yrLatest (2022): $3,288 · +30.5% YoY. Source: county tax records.
Cash-flow waterfall
monthlySold comps — $/sqft
last 12 mo · ≤1 miLoading sold comps…