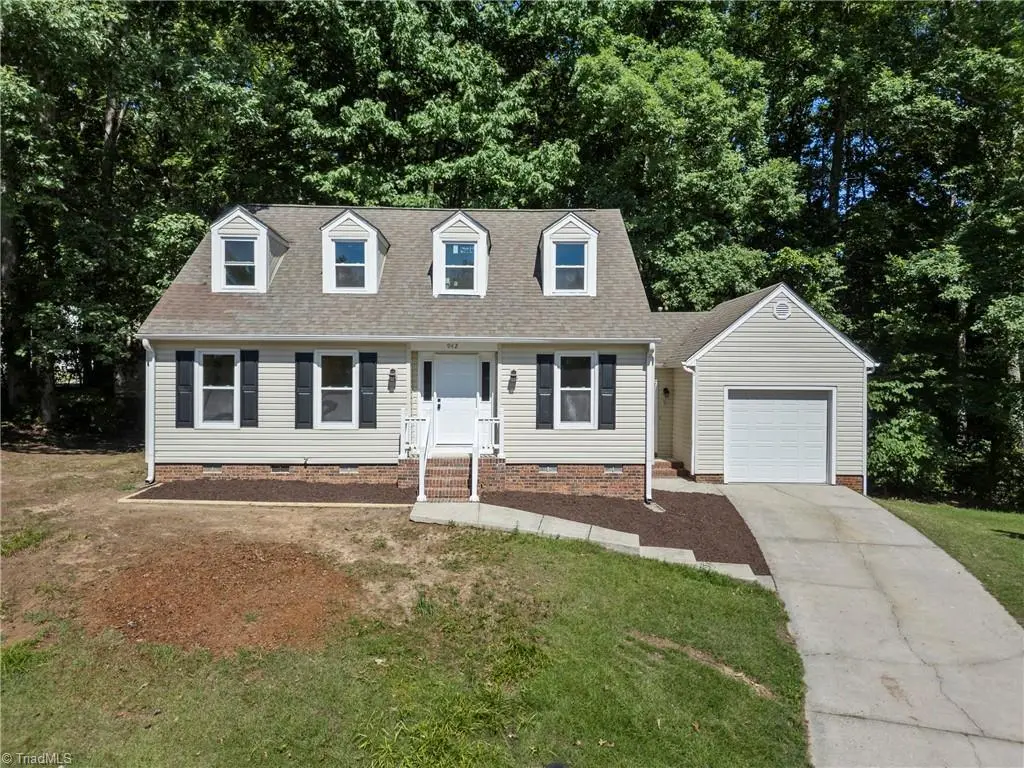
942 Chatfield Dr · High Point, NC
Flood risk 1/10 · Minimal
- FEMA flood zone
- X (unshaded)
- Chance of flooding over 30 yrs
- 0.0%
- Est. flood insurance / yr
- $507 – $1,088
Fire risk 2/10 · Minimal
- Est. fire insurance / yr
- $906 – $1,684
Heat risk 5/10 · Moderate
- Hot days now (above 103°F)
- 7 days/yr
- Hot days in 30 yrs
- 17 days/yr
Wind risk 4/10 · Minor
- Chance of severe wind over 30 yrs
- 14.0%
Air-quality risk 2/10 · Minimal
- Unhealthy air days now
- 1 days/yr
- Unhealthy air days in 30 yrs
- 1 days/yr
Risk factors via First Street. Map © Google.
Why this score? — see what drove the D- grade
The composite is a weighted blend of 9 inputs, each scored 0–100. Each bar is that input's sub-score; the figure is the points it added to the 100-point composite (weight × sub-score).
- Cash flow +14.2/30.0
- DSCR +4.3/10.0
- Livability +3.9/5.0
- Schools +3.6/10.0
- 1% rule +3.5/10.0
- ARV discount +3.1/15.0
- Rent growth +2.5/5.0
- Condition / age +2.5/5.0
- Appreciation +0.0/10.0
$299,000
🖨 Deal sheet (PDF) 📄 Offer letter ✓ Due diligence
Listing remarks
TURN-KEY & FULLY RENOVATED! Welcome to this beautifully updated 3-bedroom, 2.5-bath home in the heart of Jamestown. Featuring an open-concept floor plan, with spacious living areas and thoughtful updates throughout, this home is perfect for gathering with family and friends. Enjoy new luxury vinyl plank flooring throughout, stylish tile bathrooms, fresh paint, updated fixtures, and abundant natural light from new energy-efficient windows. The spacious kitchen flows seamlessly into the living and dining areas, creating the ideal space for everyday living and entertaining. A versatile bonus room can serve as a home office, playroom, den, media room, or flex space. Step outside to a bran
Key facts
- Spacious kitchen
- Natural light
- Tile bathrooms
Tags
Property features AI
Finance
- HOA & community: Stonehedge association; Monthly association fee of $49
Exterior
- Parking: Attached garage (1 car)
- Utilities: Public water; Public sewer; Electric service
- Home design: Residential stick/site built house; One and one-half stories; Built in 1986; Living room fireplace
- Construction: Vinyl siding; Crawl space foundation
- Exterior features: City lot; Public maintained road
Interior
- Kitchen: Convection oven; Dishwasher; Disposal; Kitchen island
- Bedrooms: 3 total rooms (includes bedrooms and living spaces)
- Flooring: Tile; Vinyl
- Bathrooms: 2 full bathrooms; 1 half bathroom
- Heating & cooling: Heat pump; Radiant floor heating; Electric heating; Central air; Attic fan
- Interior features: Ceiling fan(s); Soaking tub; Kitchen island; Primary bedroom located on the main level
- Laundry & utility: Water heater: unknown
Neighborhood map
What this means for you Summary
Snapshot
- This is a 3-bed/2.5-bath single-family listed at $299k.
Deal economics
- At list price, monthly cash flow is $48 ($571/yr) — positive.
- The deal already cash-flows at list — no discount required.
- To meet the 1% rule (rent ≥ 1% of price), the offer needs to be $253k (15.3% below list).
- Recommended offer: $253k (15.3% below list) — sets the bar for 1% rule.
- Cap rate 6.5% vs local median 4.0% in High Point — top-decile yield for the area; either an underpriced asset or a hidden risk that comps aren't pricing in. Stress-test before assuming the spread holds.
Location & tenants
- Location reads 77/100 on livability (#31 in NC, #3,084 nationally) — a middle-class / working-renter tenant base. Strengths: commute A+, cost of living A+, housing A+; Watch: amenities D, employment D, crime F.
- Guilford County Schools (urban): math 39% / reading 45% proficiency, ranked #99 of 178 in NC (top 56%) — families likely to look elsewhere, expect single-tenant / working-renter base with shorter leases.
- Zoned schools: Jamestown Elementary (math 49% / reading 45%, grade D-, #497 of 1,410 statewide, top 38%, 441 students, 99% FRL); Jamestown Middle (math 26% / reading 42%, grade F, #294 of 475 statewide, top 63%, 940 students, 69% FRL); Lucy Ragsdale High (math 45% / reading 58%, grade D+, #299 of 535 statewide, top 56%, 1,346 students, 61% FRL) — zoned schools average 76% FRL vs 52% district-wide (24 pts higher); higher-poverty schools than district average — tighter screening recommended.
- Market conditions: 143 active listings in the ZIP; 2 comparable units currently listed for rent nearby; solid renter incomes; 3,843 units permitted in Guilford County in 2024 (2,397 in 5+ unit buildings).
- This rent runs 33% of the median local income ($92k/yr) — at the standard rent-burdened threshold; future hikes will face affordability resistance.
Forward outlook
- Local home prices are declining (-3.0%/yr); year-one equity from $2k of loan paydown is wiped out by about $9k of value loss. Plan a longer hold.
- Guilford County population projected at +26% by 2050 — long-run rental-demand tailwind backs the buy-and-hold thesis.
Negotiation context
- Only 11 days on market — expect competitive offers; lowballing is unlikely to land.
- Current owner paid $170k; list at $299k implies a 76% gain — meaningful room to come down on a strong offer.
Risks & watch-outs
- Climate carrying-cost: extreme-heat days projected 7→17/yr by 2055 (HVAC capex compounding) — expect insurance premiums to compound above CPI over the hold.
Questions for the listing agent
- What does the HOA fee cover, when was the last increase, and are there any pending special assessments or reserve-fund shortfalls?
- Is there a deadline driving the sale (1031 exchange, divorce, estate, relocation)? That informs how much negotiation room exists.
- Schools are D-rated, which usually means shorter tenancies and higher turnover. Who's the typical renter profile here, and what's been the actual vacancy rate?
- Crime grade is F in this area — have there been break-ins, vandalism, or insurance claims at this property in the last 3 years? What carrier currently insures it and at what premium?
- The area grade is low — what's the realistic commute time and amenity access for the typical tenant pool here? Any planned neighborhood developments (good or bad) we should know about?
- What's the average days-on-market for RENTAL listings here right now (not sales)? A rising rental-DOM trend means longer vacancies and softer asking-rent achievability than the comps imply.
- What's the recent tenant-quality profile in this submarket — average credit score on applications, eviction rate, late-payment / NSF rate, and stable-employment percentage? A property-management company in the area should have these aggregated.
- How much new for-sale + rental construction is in the pipeline within 1–3 miles? Heavy new supply typically softens prices + rents 12–24 months out; constrained supply supports both.
Investment metrics
- 1% rule
- 0.85% ✗
- Cap rate
- 6.48%
- Cash-on-cash
- 0.68%
- DSCR
- 1.03
- GRM
- 9.8
CMA / ARV
- ARV (on-the-fly)
- $272,104
- Comps found
- 12
Show comp detail 12 sales within ~0.75 mi
| Address | Dist | Beds/Ba | Sqft | Sold | Price | $/sf | Match |
|---|---|---|---|---|---|---|---|
| 966 Chatfield Dr | 0.07mi | 3/2.0 | 1,466 (-7%) | 3mo | $260,000 | $177 | 80 |
| 853 Sage Hill Dr | 0.22mi | 3/2.5 | 1,598 (+1%) | 13mo | $317,000 | $198 | 78 |
| 976 Chatfield Dr | 0.05mi | 3/2.5 | 1,411 (-11%) | 3mo | $290,000 | $206 | 77 |
| 4025 Sherry Ct | 0.16mi | 3/2.0 | 1,659 (+5%) | 8mo | $212,000 | $128 | 76 |
| 909 Pineburr Rd | 0.09mi | 3/2.5 | 1,673 (+6%) | 13mo | $269,900 | $161 | 76 |
| 809 Sagemount St | 0.22mi | 3/2.0 | 1,693 (+7%) | 9mo | $356,000 | $210 | 69 |
| 308 Edwards Pl | 0.49mi | 2/1.5 (-1) | 1,590 (+0%) | 6mo | $225,000 | $142 | 62 |
| 5312 Adrian Rd | 0.28mi | 3/2.0 | 1,724 (+9%) | 13mo | $339,000 | $197 | 59 |
| 501 Southridge Rd | 0.61mi | 3/2.0 | 1,534 (-3%) | 8mo | $263,000 | $171 | 58 |
| 1200 Bales Chapel Rd | 0.40mi | 3/2.0 | 1,422 (-10%) | 6mo | $245,000 | $172 | 58 |
| 3314 Dillon Rd | 0.39mi | 3/2.0 | 1,721 (+9%) | 13mo | $235,000 | $137 | 54 |
| 305 Rollingwood Rd | 0.57mi | 3/2.0 | 1,795 (+14%) | 12mo | $305,000 | $170 | 39 |
Match score weights: distance 35% · size 25% · config 20% · recency 20%. Top-matched comps best support the ARV.
Projected returns pro-forma
-3.0% appreciation · 3.0% rent growth · sell at horizon
- IRR
- -15.2%
- Equity multiple
- 0.46×
- Total profit
- $-45,453
- Equity at exit
- $44,582
- IRR
- -6.7%
- Equity multiple
- 0.57×
- Total profit
- $-35,806
- Equity at exit
- $25,852
Cash invested: $83,720 (down + closing). Projections, not guarantees.
Landlord ↔ Tenant lean methodology
- Overall (STATE)
- 85 Strongly Landlord-Friendly
- State North Carolina
- 85 Strongly Landlord-Friendly · R+3
- County
- — inherits STATE
- City
- — inherits STATE
ZIP-level market 27282
- Home prices YoY
- -21.2%
- Active inventory
- 143
- Price-to-rent
- 9.8×
Monthly cashflow live
- Estimated rent
- $2,533 medium interval (Pro) →
- Mortgage (P&I)
- −$1,568
- Tax from tax record
- −$212 /mo · $2,546/yr
- Insurance
- −$125
- HOA
- −$49
- Vacancy / Maint / Mgmt
- −$532
- Net cashflow
- $48
Break-even live
Sensitivity live
| Price | -10% $217 | -5% $132 | +0% $48 | +5% $-37 | +10% $-122 |
|---|---|---|---|---|---|
| Rent | -10% $-153 | -5% $-53 | +0% $48 | +5% $148 | +10% $248 |
| Rate | -1.0pp $198 | -0.5pp $124 | base $48 | +0.5pp $-30 | +1.0pp $-109 |
UW: 25.0% down · 7.5% · 30yr · 1.5% tax · 5.0% vac · 8.0% maint · 8.0% mgmt
Financing live
Cash to close
- Down payment
- $74,750
- Closing costs
- $8,970
- Reserves months
- —
- Total cash needed
- —
Loan-product check · same deal, 3 products live
Conventional
25% down · 7.5% · 30yr
- Down + closing
- —
- Monthly P&I
- —
- Monthly cashflow
- —
- DSCR
- —
- Eligible?
- —
Personal DTI + credit; lowest rate.
DSCR
20% down · 8.5% · 30yr
- Down + closing
- —
- Monthly P&I
- —
- Monthly cashflow
- —
- DSCR
- —
- Eligible?
- —
No personal income docs; deal must DSCR.
Hard money
10% down · 12.0% · 12mo
- Down + closing
- —
- Monthly P&I
- —
- Monthly cashflow
- —
- DSCR
- —
- Eligible?
- —
Short-term bridge; refi at stabilization.
Rent comps 2 comps
| Address | Beds | Baths | Sqft | Rent | $/sqft | DOM | Units | Dist |
|---|---|---|---|---|---|---|---|---|
| 3005 Manchester Dr Jamestown, NC | 4.0 | 2.5 | 2104 | $2,400 | $1.14 | 16d | 1 | 0.24mi |
| 405 Amberly Dr Jamestown, NC | 3.0 | 2.0 | 1200 | $1,850 | $1.54 | 25d | 1 | 0.69mi |
HOA detail
- Monthly dues
- $49 · $588/yr
Listing history 8 events
-
2026-06-22pricedays on market $299,000 Active 11 DOM
-
2026-06-18days on market $309,000 Active 8 DOM
-
2026-06-17days on market $309,000 Active 7 DOM
-
2026-06-16days on market $309,000 Active 6 DOM
-
2026-06-15price $309,000 Active 5 DOM
-
2026-06-15days on market $319,000 Active 5 DOM
-
2026-06-14remarks 695-char remark
-
2026-06-14$319,000 Active 3 DOM
ⓘ Source: listings_history table (triggers on properties + properties_extension) + one-shot
backfill from property_details.listing_events for pre-trigger history.
Tax reassessment forecast NC · Resets to sale price
- Current annual tax
- $2,546 · $212/mo
- Projected year-2 tax
- $2,546 · $212/mo
- Expected delta
- $0/yr ($0/mo · 0.0%)
ⓘ Screening estimate from a state-policy table — verify with the county assessor before closing.
Climate risk First Street
- Flood 1/10 Low FEMA zone X (unshaded) · 0% chance over 30 yrs
- Wildfire 2/10 Low
- Heat 5/10 Major 7 d/yr ≥103°F today · 17 d/yr by 30 yrs out
- Wind 4/10 Moderate 14% chance of damaging wind over 30 yrs
- Air quality 2/10 Low 1 unhealthy d/yr today · 1 by 30 yrs out
Nearby sold comps map
Loading sold comps map…
Walkable amenities ~0.75 mi
Loading nearby amenities…
Taxation est. · year 1
- Rental income
- $30,400
- − Mortgage interest
- −$16,749
- − Property taxes
- −$2,546
- − Insurance
- −$1,495
- − Repairs & maintenance
- −$2,432
- − Management
- −$2,432
- − HOA
- −$588
- − Depreciation
- −$8,698
- Taxable loss
- −$4,540
- Est. tax savings @ 24.0%
- +$1,090
- After-tax cash flow
- $1,660/yr
For passive investors: Depreciation is non-cash, so a rental often shows a tax loss while cash-flowing — sheltering income. Rental losses are passive: they offset passive income freely, and up to $25,000/yr can offset ordinary (W-2) income if you actively participate and your MAGI is under $100k (phasing out to $0 by $150k); unused losses carry forward. On sale, claimed depreciation is recaptured at up to 25%, and gains may owe capital-gains tax (a 1031 exchange can defer both). Figures are a year-1 estimate at your 24.0% rate — not tax advice; consult a CPA.
Schools (NCES district)
- District
- Guilford County Schools
- NCES district ID
- 3701920
- Math proficiency
- 39% ▲ 1.00%
- Reading proficiency
- 45% ▲ 1.00%
- Median HH income
- $46,315
- Composite
- 35.78/100
- National rank
- #4842
- State rank
- #99 of 178 in NC
Livability — High Point
- Score
- 77/100
- State rank
- #31
- US rank
- #3084
Category grades
Schools grade is shown separately in the Schools card above.
Census & demographics
- Census place
- High Point, NC
- County
- Guilford County · 487,190 people
- City population
- 102,450
- Metro
- Greensboro-High Point, NC
- Population (ZIP)
- 15,927
- Household income
- $91,512
- Rent vs Own
- Severe rent burden
- 374.0
Population outlook (Guilford County) Hauer SSP2
- Today (2025)
- 584,596 people
- By 2030
- 616,851 · +5.5%
- By 2040
- 678,451 · +16.1%
- By 2050
- 734,788 · +25.7%
- By 2075
- 862,985 · +47.6%
- By 2100
- 948,704 · +62.3%
Race, ethnicity, and origin ACS 2023
- Neighborhood character
- Predominantly White (68%)
- Race & ethnicity
- White 68% Black 16% Hispanic / Latino 9% Asian 5% Two or more races 4%
- Hispanic origin (detail)
- Mexican 4% Puerto Rican 1%
- Common ancestry
- Slovak 3% Italian 2% Serbian 2%
- Foreign-born
- 12% · Canada, South Korea, Jamaica
- Languages at home
- 85% English-only · Spanish 6% Other Indo-European 2% Korean 2%
Political lean MEDSL · Guilford
- 2024 margin
- Strong D (+21.8) · D 60.2% · R 38.4% · Other 1.4%
- 2008→2024 swing
- +3.5pp toward D · 2008: 18.4pp · 2024: 21.8pp
- All cycles
- 2024: D+21.8 2020: D+23.1 2016: D+20.0 2012: D+16.5 2008: D+18.4
Not yet ingested
- Civics
- —
Market trends
- HPI YoY
- ▼ -55.56%
- Current HPI
- 206.6685
- Rent YoY
- —
- Metro
- Greensboro-High Point, NC
- State GDP YoY
- ▲ 3.28%
- F500 in state
- 26
Industry mix (Fortune 500 HQ in NC)
| Industry | F500 HQs | Revenue |
|---|---|---|
| Financial Services | 2 | $213B |
|
||
| Retail | 2 | $95B |
|
||
| Industrial Conglomerate | 1 | $38B |
|
||
| Metals / Steel | 1 | $35B |
|
||
| Utilities | 1 | $30B |
|
||
| Industrial Machinery | 1 | $19B |
|
||
Price history
+270.9% since first listed4 events — show timeline
- 2026-06-09 Listed $319,000 Triad MLS
- 2026-01-20 Sold (Public Records) $170,000 Public Records
- 1996-08-01 Sold (Public Records) $104,000 Public Records
- 1988-05-01 Sold (Public Records) $86,000 Public Records
Property tax history
+3.9%/yrLatest (2025): $2,546 · -0.8% YoY. Source: county tax records.
Cash-flow waterfall
monthlySold comps — $/sqft
last 12 mo · ≤1 miLoading sold comps…