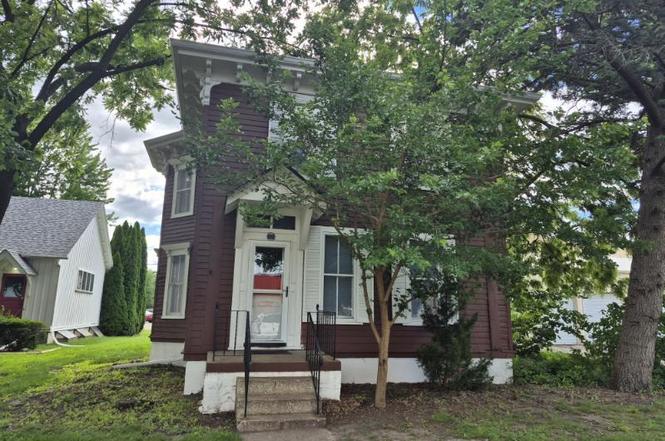
117 S Chestnut St · Kewanee, IL
Flood risk No data
- FEMA flood zone
- —
- Chance of flooding over 30 yrs
- —
- Est. flood insurance / yr
- —
Fire risk No data
- Est. fire insurance / yr
- —
Heat risk No data
- Hot days now (above threshold)
- —
- Hot days in 30 yrs
- —
Wind risk No data
- Chance of severe wind over 30 yrs
- —
Air-quality risk No data
- Unhealthy air days now
- —
- Unhealthy air days in 30 yrs
- —
Risk factors via First Street. Map © Google.
Why this score? — see what drove the B- grade
The composite is a weighted blend of 9 inputs, each scored 0–100. Each bar is that input's sub-score; the figure is the points it added to the 100-point composite (weight × sub-score).
- Cash flow +30.0/30.0
- 1% rule +10.0/10.0
- DSCR +10.0/10.0
- ARV discount +7.5/15.0
- Livability +3.5/5.0
- Rent growth +2.5/5.0
- Schools +1.2/10.0
- Condition / age +1.0/5.0
- Appreciation +0.0/10.0
$49,900
🖨 Deal sheet (PDF) 📄 Offer letter ✓ Due diligence
Listing remarks
Last Purchased in 1965. This Victorian House has been used as a Law Office for 60 years and was a Dentist office before that. Excellent Location on South Chestnut with alley access in the rear. Use your imagination - Single Family, Duplex, office space - can be remodeled into whatever space you are looking for. New Roof in 2024
Key facts
- Victorian house
- Alley access
- Excellent location
Tags
Property features AI
Finance
- HOA & community: No master association fee required
Exterior
- Utilities: Public water; Public sewer
- Home design: Detached single-family home; Two-story
- Construction: Frame construction; Brick/mortar foundation; Asphalt roof; Property over 100 years old; Built before 1978
- Exterior features: Level lot; Lot dimensions approximately 54 x 150
Interior
- Kitchen: Kitchen on main level (14 x 12), vinyl flooring
- Bedrooms: Master bedroom on second level (14 x 17), carpeted; Second bedroom on second level (10 x 10), carpeted; Third bedroom on second level (15 x 12), carpeted
- Flooring: Carpet in most living areas and bedrooms; Vinyl flooring in kitchen
- Bathrooms: One half bathroom
- Heating & cooling: Natural gas heating; Window air conditioning units
- Interior features: 7 total rooms; Crawl space basement
- Laundry & utility: Laundry room
Neighborhood map
What this means for you Summary
Snapshot
- This is a 3-bed/0.5-bath single-family listed at $50k. Condition is rated poor.
Deal economics
- At list price, monthly cash flow is $659 ($8k/yr) — positive.
- The deal already cash-flows at list — no discount required.
- Meets the 1% rule at list price ($1k rent vs $50k).
- Cap rate 22.1% vs local median 8.6% in Kewanee — top-decile yield for the area; either an underpriced asset or a hidden risk that comps aren't pricing in. Stress-test before assuming the spread holds.
Location & tenants
- Location reads 69/100 on livability (#409 in IL) — a middle-class / working-renter tenant base. Strengths: cost of living A+, health & safety A+, housing A; Watch: crime D-, amenities F, commute F.
- Kewanee CUSD 229 (town): math 8% / reading 20% proficiency, ranked #540 of 620 in IL (top 87%) — low school quality limits family demand, transient renter base, plan for 1-2y turnover; 73% free/reduced lunch — lower-income household profile, screen leases tightly.
- Zoned schools: Belle Alexander Elem School (254 students, 0% FRL); Central Elem (math 5% / reading 15%, grade F, #583 of 665 statewide, top 89%, 344 students, 0% FRL); Kewanee High School (math 8% / reading 17%, grade F, #506 of 693 statewide, top 74%, 581 students, 0% FRL) — zoned schools average 0% FRL vs 73% district-wide (73 pts lower); this property's tenant base skews higher-income than the district average.
- Market conditions: 39 active listings in the ZIP; 32 units permitted in Henry County in 2024 (0 in 5+ unit buildings).
Forward outlook
- Local home prices are declining (-3.0%/yr); year-one equity from $345 of loan paydown is wiped out by about $1k of value loss. Plan a longer hold.
- Henry County population projected at -16% by 2050 — secular population decline; favor cash flow + early exit over multi-decade hold.
- At projected returns (-3.0% appreciation + 3.0% rent growth), your $14k cash investment doubles in ~3 years — after that, you're playing with house money.
Negotiation context
- Only 5 days on market — expect competitive offers; lowballing is unlikely to land.
Risks & watch-outs
- Watch-outs: built in 1857 — expect roof / HVAC / electrical / plumbing capex.
Questions for the listing agent
- Have any recent inspections been done? Can we get a copy of the seller's disclosures and any deferred-maintenance estimates?
- Built in 1857 — when were the roof, HVAC, electrical panel, plumbing, and water heater last replaced?
- Is there a deadline driving the sale (1031 exchange, divorce, estate, relocation)? That informs how much negotiation room exists.
- Schools are F-rated, which usually means shorter tenancies and higher turnover. Who's the typical renter profile here, and what's been the actual vacancy rate?
- Crime grade is D in this area — have there been break-ins, vandalism, or insurance claims at this property in the last 3 years? What carrier currently insures it and at what premium?
- What's the average days-on-market for RENTAL listings here right now (not sales)? A rising rental-DOM trend means longer vacancies and softer asking-rent achievability than the comps imply.
- What's the recent tenant-quality profile in this submarket — average credit score on applications, eviction rate, late-payment / NSF rate, and stable-employment percentage? A property-management company in the area should have these aggregated.
- How much new for-sale + rental construction is in the pipeline within 1–3 miles? Heavy new supply typically softens prices + rents 12–24 months out; constrained supply supports both.
Investment metrics
- 1% rule
- 2.55% ✓
- Cap rate
- 22.14%
- Cash-on-cash
- 56.60%
- DSCR
- 3.52
- GRM
- 3.3
CMA / ARV
- ARV (on-the-fly)
- $113,516
- Comps found
- 12
Show comp detail 12 sales within ~0.75 mi
| Address | Dist | Beds/Ba | Sqft | Sold | Price | $/sf | Match |
|---|---|---|---|---|---|---|---|
| 509 E 2nd St | 0.51mi | 3/1.0 | 1,852 (-4%) | 6mo | $99,000 | $53 | 63 |
| 407 Ross St | 0.46mi | 3/1.0 | 1,779 (-8%) | 6mo | $74,000 | $42 | 59 |
| 513 N Lexington Ave | 0.41mi | 3/1.0 | 2,008 (+4%) | 18mo | $25,000 | $12 | 56 |
| 215 W Prospect St | 0.33mi | 4/2.5 (+1) | 2,098 (+9%) | 2mo | $240,000 | $114 | 55 |
| 525 S Chestnut St | 0.38mi | 4/1.5 (+1) | 2,068 (+8%) | 10mo | $77,500 | $37 | 53 |
| 513 N Lexington Ave | 0.41mi | 3/1.0 | 1,696 (-12%) | 18mo | $25,000 | $15 | 44 |
| 425 Rockwell St | 0.46mi | 4/2.0 (+1) | 2,052 (+7%) | 17mo | $130,000 | $63 | 42 |
| 527 Elliott St | 0.41mi | 3/1.5 | 1,638 (-15%) | 14mo | $134,000 | $82 | 41 |
| 111 Mckinley Ave | 0.45mi | 2/1.0 (-1) | 1,690 (-12%) | 17mo | $100,000 | $59 | 38 |
| 837 Beach St | 0.65mi | 3/1.5 | 1,639 (-15%) | 4mo | $120,000 | $73 | 38 |
| 418 E Division St | 0.72mi | 3/2.0 | 1,684 (-12%) | 5mo | $125,000 | $74 | 36 |
| 802 E 2nd St | 0.70mi | 3/2.0 | 1,680 (-13%) | 12mo | $62,000 | $37 | 30 |
Match score weights: distance 35% · size 25% · config 20% · recency 20%. Top-matched comps best support the ARV.
Projected returns pro-forma
-3.0% appreciation · 3.0% rent growth · sell at horizon
- IRR
- 55.0%
- Equity multiple
- 3.43×
- Total profit
- $33,909
- Equity at exit
- $7,440
- IRR
- 60.1%
- Equity multiple
- 6.99×
- Total profit
- $83,655
- Equity at exit
- $4,314
Cash invested: $13,972 (down + closing). Projections, not guarantees.
Landlord ↔ Tenant lean methodology
- Overall (STATE)
- 43 Moderately Tenant-Leaning
- State Illinois
- 43 Moderately Tenant-Leaning · D+7
- County
- — inherits STATE
- City
- — inherits STATE
ZIP-level market 61443
- Active inventory
- 39
- Price-to-rent
- 3.3×
Monthly cashflow live
- Estimated rent
- $1,271 medium interval (Pro) →
- Mortgage (P&I)
- −$262
- Tax est. 1.5%
- −$62 /mo · $748/yr
- Insurance
- −$21
- HOA
- −$0
- Vacancy / Maint / Mgmt
- −$267
- Net cashflow
- $659
Break-even live
Sensitivity live
| Price | -10% $694 | -5% $676 | +0% $659 | +5% $642 | +10% $625 |
|---|---|---|---|---|---|
| Rent | -10% $559 | -5% $609 | +0% $659 | +5% $709 | +10% $759 |
| Rate | -1.0pp $684 | -0.5pp $672 | base $659 | +0.5pp $646 | +1.0pp $633 |
UW: 25.0% down · 7.5% · 30yr · 1.5% tax · 5.0% vac · 8.0% maint · 8.0% mgmt
Financing live
Cash to close
- Down payment
- $12,475
- Closing costs
- $1,497
- Reserves months
- —
- Total cash needed
- —
Loan-product check · same deal, 3 products live
Conventional
25% down · 7.5% · 30yr
- Down + closing
- —
- Monthly P&I
- —
- Monthly cashflow
- —
- DSCR
- —
- Eligible?
- —
Personal DTI + credit; lowest rate.
DSCR
20% down · 8.5% · 30yr
- Down + closing
- —
- Monthly P&I
- —
- Monthly cashflow
- —
- DSCR
- —
- Eligible?
- —
No personal income docs; deal must DSCR.
Hard money
10% down · 12.0% · 12mo
- Down + closing
- —
- Monthly P&I
- —
- Monthly cashflow
- —
- DSCR
- —
- Eligible?
- —
Short-term bridge; refi at stabilization.
Listing history 5 events
-
2026-06-22days on market $49,900 Active 5 DOM
-
2026-06-21days on market $49,900 Active 4 DOM
-
2026-06-21days on market $49,900 Active 3 DOM
-
2026-06-17remarks 330-char remark
-
2026-06-17$49,900 Active 1 DOM
ⓘ Source: listings_history table (triggers on properties + properties_extension) + one-shot
backfill from property_details.listing_events for pre-trigger history.
Nearby sold comps map
Loading sold comps map…
Walkable amenities ~0.75 mi
Loading nearby amenities…
Taxation est. · year 1
- Rental income
- $15,249
- − Mortgage interest
- −$2,795
- − Property taxes
- −$748
- − Insurance
- −$250
- − Repairs & maintenance
- −$1,220
- − Management
- −$1,220
- − Depreciation
- −$1,452
- Taxable income
- $7,564
- Est. tax owed @ 24.0%
- −$1,815
- After-tax cash flow
- $6,093/yr
For passive investors: Depreciation is non-cash, so a rental often shows a tax loss while cash-flowing — sheltering income. Rental losses are passive: they offset passive income freely, and up to $25,000/yr can offset ordinary (W-2) income if you actively participate and your MAGI is under $100k (phasing out to $0 by $150k); unused losses carry forward. On sale, claimed depreciation is recaptured at up to 25%, and gains may owe capital-gains tax (a 1031 exchange can defer both). Figures are a year-1 estimate at your 24.0% rate — not tax advice; consult a CPA.
Condition & rehab AI · 12 photos
This Victorian house requires extensive repairs and updates to bring it up to modern standards and improve its resale and rental value.
Repairs flagged
- Major siding — Worn and peeling
- Major paint — Peeling and worn
- Major flooring — Worn and carpeted
- Major interior walls — Peeling wallpaper and worn paint
- Major HVAC/mechanicals — No visible systems
Value-add opportunities
- Both New siding and paint — Enhances curb appeal and interior aesthetics
- Both New flooring — Improves living space and resale value
- Both New HVAC system — Enhances comfort and energy efficiency
- Both Landscaping and curb appeal — Improves overall appearance and resale value
Renovation cost estimate screening
| Repair item | Severity | Est. cost |
|---|---|---|
| siding · Worn and peeling | Major | $15,000–50,000 |
| paint · Peeling and worn | Major | $15,000–50,000 |
| flooring · Worn and carpeted | Major | $15,000–50,000 |
| interior walls · Peeling wallpaper and worn paint | Major | $15,000–50,000 |
| HVAC/mechanicals · No visible systems | Major | $15,000–50,000 |
| Total estimated repair cost · 5 items | $75,000–250,000 |
Value-add ROI direction
- Both New siding and paint — Enhances curb appeal and interior aesthetics ↑
- Both New flooring — Improves living space and resale value ↑
- Both New HVAC system — Enhances comfort and energy efficiency ↑
- Both Landscaping and curb appeal — Improves overall appearance and resale value ↑
ⓘ Cost ranges are severity-bucket heuristics (US national rule-of-thumb). Get contractor quotes + a written scope before underwriting a rehab budget.
Schools (NCES district)
- District
- Kewanee CUSD 229
- NCES district ID
- 1721000
- Math proficiency
- 8% ▼ -8.00%
- Reading proficiency
- 20% ▼ -12.00%
- Median HH income
- $38,294
- Composite
- 11.77/100
- National rank
- #9682
- State rank
- #540 of 620 in IL
Livability — Kewanee
- Score
- 69/100
- State rank
- #409
- US rank
- #8423
Category grades
Schools grade is shown separately in the Schools card above.
Census & demographics
- Census place
- Kewanee, IL
- Population (ZIP)
- 13,529
Population outlook (Henry County) Hauer SSP2
- Today (2025)
- 47,376 people
- By 2030
- 45,920 · -3.1%
- By 2040
- 42,829 · -9.6%
- By 2050
- 39,606 · -16.4%
- By 2075
- 31,848 · -32.8%
- By 2100
- 23,503 · -50.4%
Race, ethnicity, and origin ACS 2023
- Neighborhood character
- Predominantly White (79%)
- Race & ethnicity
- White 79% Hispanic / Latino 11% Black 6% Two or more races 5%
- Hispanic origin (detail)
- Mexican 9% Puerto Rican 1%
- Common ancestry
- Romanian 4% English 3% Italian 3%
- Foreign-born
- 3% · Canada
- Languages at home
- 92% English-only · Spanish 7%
Political lean MEDSL · Henry
- 2024 margin
- Strong R (+24.5) · D 36.8% · R 61.3% · Other 1.9%
- 2008→2024 swing
- -32.2pp toward R · 2008: 7.7pp · 2024: -24.5pp
- All cycles
- 2024: R+24.5 2020: R+21.4 2016: R+21.2 2012: D+3.1 2008: D+7.7
Not yet ingested
- Civics
- —
Market trends
- HPI YoY
- ▼ -68.32%
- Current HPI
- 121.8672
- Rent YoY
- —
- Metro
- —
- State GDP YoY
- ▲ 1.59%
- F500 in state
- 60
Industry mix (Fortune 500 HQ in IL)
| Industry | F500 HQs | Revenue |
|---|---|---|
| Insurance | 4 | $201B |
|
||
| Consumer Goods | 4 | $87B |
|
||
| Industrial Machinery | 3 | $64B |
|
||
| Healthcare | 2 | $55B |
|
||
| Retail / Pharmacy | 1 | $148B |
|
||
| Agriculture / Food | 1 | $86B |
|
||
Price history
1 event — show timeline
- 2026-06-17 Listed $49,900 MRED as Distributed by MLS Grid
Cash-flow waterfall
monthlySold comps — $/sqft
last 12 mo · ≤1 miLoading sold comps…