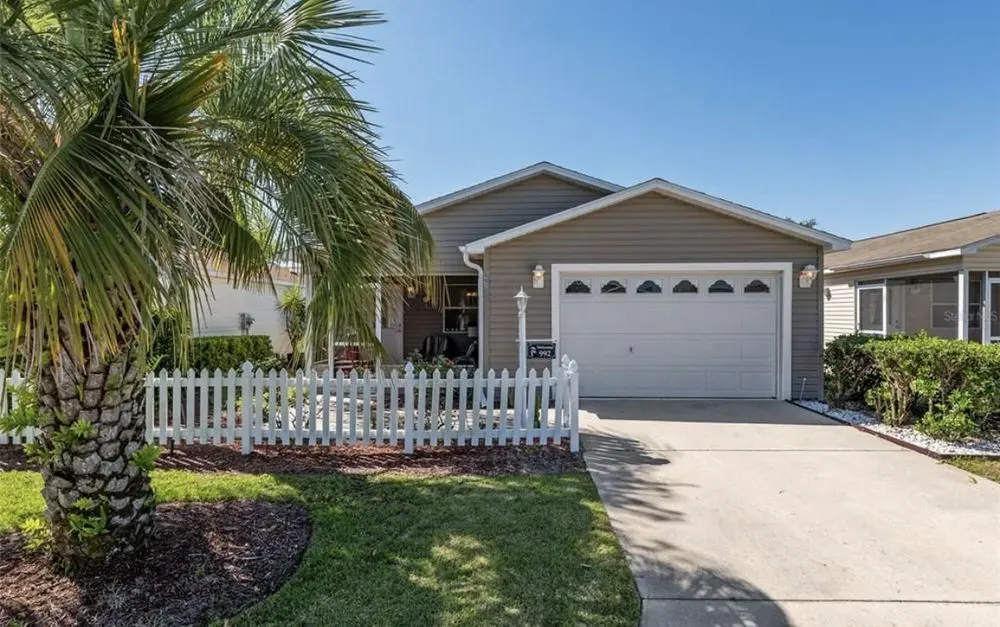
992 Pinewood Pl · The Villages, FL
Flood risk 1/10 · Minimal
- FEMA flood zone
- X (unshaded)
- Chance of flooding over 30 yrs
- 0.0%
- Est. flood insurance / yr
- $507 – $1,088
Fire risk 4/10 · Minor
- Est. fire insurance / yr
- $947 – $1,759
Heat risk 9/10 · Severe
- Hot days now (above 108°F)
- 7 days/yr
- Hot days in 30 yrs
- 23 days/yr
Wind risk 9/10 · Severe
- Chance of severe wind over 30 yrs
- 99.0%
Air-quality risk 3/10 · Minor
- Unhealthy air days now
- 2 days/yr
- Unhealthy air days in 30 yrs
- 3 days/yr
Risk factors via First Street. Map © Google.
Why this score? — see what drove the C- grade
The composite is a weighted blend of 9 inputs, each scored 0–100. Each bar is that input's sub-score; the figure is the points it added to the 100-point composite (weight × sub-score).
- Cash flow +16.7/30.0
- ARV discount +11.8/15.0
- DSCR +5.2/10.0
- Schools +5.2/10.0
- 1% rule +4.3/10.0
- Rent growth +3.5/5.0
- Livability +3.5/5.0
- Condition / age +2.5/5.0
- Appreciation +0.0/10.0
$270,000
🖨 Deal sheet (PDF) 📄 Offer letter ✓ Due diligence
Listing remarks MLS
* * Turnkey Patio Villa with 2024 Roof & Golf Cart | Under 1.4 Miles to Lake Sumter Landing * * Live just moments from Lake Sumter Landing in this fully furnished 2BR/2BA Cabot Cove Patio Villa, ideally situated in the Oleander Villas of Sable Chase. With a * * brand-new 2024 roof * * , this home offers peace of mind for both homeowners and insurance providers. A * * 4-seat golf cart is included * * , making your trips to the nearby town square, lake, golf courses, and recreation centers both fun and convenient. Inside, vaulted ceilings and abundant natural light create a welcoming atmosphere. The open-concept layout is perfect for relaxed living, with a spacious primary suite featuring a walk-in closet and private ensuite bath. The kitchen is thoughtfully designed and opens to the dining and living spaces for effortless entertaining. Enjoy your morning coffee in the screened lanai with Chattahoochee River rock flooring, or host guests on the extended patio. Additional highlights include an indoor laundry room and a garage with dedicated golf cart parking. Whether you're looking for a seasonal retreat, full-time residence, or investment opportunity, this low-maintenance villa delivers. Just bring your suitcase and start enjoying. The Villages lifestyle—less than 1.4 miles from Lake Sumter Landing and the waterfront.
Key facts
- Quiet neighborhood
- Open-concept layout
- 3,625 sq ft lot
Tags
Property features AI
Exterior
- Home design: House
- Exterior features: Lot size approximately 3,625 sq ft
Neighborhood map
What this means for you Summary
Snapshot
- This is a 2-bed/2.0-bath single-family listed at $270k.
Deal economics
- At list price, monthly cash flow is $168 ($2k/yr) — positive.
- The deal already cash-flows at list — no discount required.
- To meet the 1% rule (rent ≥ 1% of price), the offer needs to be $250k (7.5% below list).
- Recommended offer: $250k (7.5% below list) — sets the bar for 1% rule.
- Cap rate 7.0% vs local median 5.0% in The Villages — top-decile yield for the area; either an underpriced asset or a hidden risk that comps aren't pricing in. Stress-test before assuming the spread holds.
Location & tenants
- Location reads 70/100 on livability (#431 in FL) — a middle-class / working-renter tenant base. Strengths: crime A+, housing A, employment B+; Watch: amenities F, commute F, health & safety F.
- Sumter (rural): math 61% / reading 61% proficiency, ranked #11 of 73 in FL (top 15%) — acceptable for families but not a draw, mixed tenant base, ~2y average lease.
- Zoned schools: Wildwood Elementary School (math 49% / reading 52%, grade D+, #1,055 of 2,144 statewide, top 50%, 940 students, 76% FRL); South Sumter Middle School (math 55% / reading 54%, grade B-, #183 of 571 statewide, top 34%, 897 students, 61% FRL) — zoned schools average 68% FRL vs 51% district-wide (18 pts higher); higher-poverty schools than district average — tighter screening recommended.
- Market conditions: Rents rising (+3.9%/yr); 551 active listings in the ZIP; 10 comparable units currently listed for rent nearby; rentals at typical pace (median 23d on market — plan ~3-4 weeks tenant-placement turnaround); 3,961 units permitted in Sumter County in 2024 (248 in 5+ unit buildings).
- This rent runs 40% of the median local income ($74k/yr) — at the standard rent-burdened threshold; future hikes will face affordability resistance.
Forward outlook
- Local home prices are declining (-3.0%/yr); year-one equity from $2k of loan paydown is wiped out by about $8k of value loss. Plan a longer hold.
- Sumter County population projected at +45% by 2050 — long-run rental-demand tailwind backs the buy-and-hold thesis.
Negotiation context
- It's been on market 17 days — a 2% lower offer ($266k) is reasonable based on typical stale-listing flexibility.
- 4 sale attempts with the ask held roughly flat each time — persistent listings suggest the price (not the market) is what's stuck; bring a comps-based counter.
Risks & watch-outs
- Climate carrying-cost: severe wind risk, 99% chance of damaging wind over 30y; extreme-heat days projected 7→23/yr by 2055 (HVAC capex compounding) — expect insurance premiums to compound above CPI over the hold.
Questions for the listing agent
- Is there a deadline driving the sale (1031 exchange, divorce, estate, relocation)? That informs how much negotiation room exists.
- Schools are A-rated — typically a magnet for longer-tenancy family renters. What's the average tenant stay here, and is there a school-zone premium baked into asking?
- What's the average days-on-market for RENTAL listings here right now (not sales)? A rising rental-DOM trend means longer vacancies and softer asking-rent achievability than the comps imply.
- What's the recent tenant-quality profile in this submarket — average credit score on applications, eviction rate, late-payment / NSF rate, and stable-employment percentage? A property-management company in the area should have these aggregated.
- How much new for-sale + rental construction is in the pipeline within 1–3 miles? Heavy new supply typically softens prices + rents 12–24 months out; constrained supply supports both.
Investment metrics
- 1% rule
- 0.93% ✗
- Cap rate
- 7.04%
- Cash-on-cash
- 2.67%
- DSCR
- 1.12
- GRM
- 9.0
CMA / ARV
- ARV (on-the-fly)
- $298,188
- Comps found
- 12
Show comp detail 12 sales within ~0.75 mi
| Address | Dist | Beds/Ba | Sqft | Sold | Price | $/sf | Match |
|---|---|---|---|---|---|---|---|
| 1018 Ridgeville Rd | 0.06mi | 2/2.0 | 1,188 (0%) | 2mo | $280,000 | $236 | 96 |
| 1017 Ridgeville Rd | 0.07mi | 2/2.0 | 1,156 (-3%) | 3mo | $290,000 | $251 | 90 |
| 1798 Longwood Ct | 0.12mi | 2/2.0 | 1,138 (-4%) | 6mo | $315,000 | $277 | 83 |
| 1953 Greeleyville Ter | 0.34mi | 2/2.0 | 1,196 (+1%) | 4mo | $319,900 | $267 | 80 |
| 1083 Jackson St | 0.38mi | 2/2.0 | 1,187 (-0%) | 4mo | $264,000 | $222 | 79 |
| 1007 Rockville Pl | 0.15mi | 2/2.0 | 1,278 (+8%) | 2mo | $315,000 | $246 | 79 |
| 1935 Mcconnells Ave | 0.32mi | 2/2.0 | 1,123 (-6%) | 0mo | $315,000 | $280 | 75 |
| 1524 Conway Ct | 0.42mi | 2/2.0 | 1,196 (+1%) | 5mo | $312,000 | $261 | 75 |
| 1052 Jackson St | 0.36mi | 2/2.0 | 1,258 (+6%) | 0mo | $405,200 | $322 | 73 |
| 2023 Thurmond Ave | 0.59mi | 2/2.0 | 1,156 (-3%) | 4mo | $267,000 | $231 | 64 |
| 1991 Johnson Ct | 0.57mi | 2/2.0 | 1,156 (-3%) | 6mo | $205,000 | $177 | 64 |
| 1994 Orangeburg Ter | 0.62mi | 2/2.0 | 1,142 (-4%) | 1mo | $265,000 | $232 | 64 |
Match score weights: distance 35% · size 25% · config 20% · recency 20%. Top-matched comps best support the ARV.
Projected returns pro-forma
-3.0% appreciation · 3.92% rent growth · sell at horizon
- IRR
- -11.1%
- Equity multiple
- 0.59×
- Total profit
- $-30,713
- Equity at exit
- $40,258
- IRR
- -0.6%
- Equity multiple
- 0.96×
- Total profit
- $-3,202
- Equity at exit
- $23,345
Cash invested: $75,600 (down + closing). Projections, not guarantees.
Landlord ↔ Tenant lean methodology
- Overall (STATE)
- 87 Strongly Landlord-Friendly
- State Florida
- 87 Strongly Landlord-Friendly · R+3
- County
- — inherits STATE
- City
- — inherits STATE
ZIP-level market 32162
- Home prices YoY
- -6.9%
- Rents YoY
- 3.9%
- Active inventory
- 551
- Price-to-rent
- 9.0×
Monthly cashflow live
- Estimated rent
- $2,498 high interval (Pro) →
- Mortgage (P&I)
- −$1,416
- Tax from tax record
- −$277 /mo · $3,327/yr
- Insurance
- −$112
- HOA
- −$0
- Vacancy / Maint / Mgmt
- −$525
- Net cashflow
- $168
Break-even live
Sensitivity live
| Price | -10% $321 | -5% $244 | +0% $168 | +5% $92 | +10% $15 |
|---|---|---|---|---|---|
| Rent | -10% $-29 | -5% $69 | +0% $168 | +5% $267 | +10% $365 |
| Rate | -1.0pp $304 | -0.5pp $237 | base $168 | +0.5pp $98 | +1.0pp $27 |
UW: 25.0% down · 7.5% · 30yr · 1.5% tax · 5.0% vac · 8.0% maint · 8.0% mgmt
Financing live
Cash to close
- Down payment
- $67,500
- Closing costs
- $8,100
- Reserves months
- —
- Total cash needed
- —
Loan-product check · same deal, 3 products live
Conventional
25% down · 7.5% · 30yr
- Down + closing
- —
- Monthly P&I
- —
- Monthly cashflow
- —
- DSCR
- —
- Eligible?
- —
Personal DTI + credit; lowest rate.
DSCR
20% down · 8.5% · 30yr
- Down + closing
- —
- Monthly P&I
- —
- Monthly cashflow
- —
- DSCR
- —
- Eligible?
- —
No personal income docs; deal must DSCR.
Hard money
10% down · 12.0% · 12mo
- Down + closing
- —
- Monthly P&I
- —
- Monthly cashflow
- —
- DSCR
- —
- Eligible?
- —
Short-term bridge; refi at stabilization.
Rent comps 10 comps
| Address | Beds | Baths | Sqft | Rent | $/sqft | DOM | Units | Dist |
|---|---|---|---|---|---|---|---|---|
| 1009 Ridgeville Rd The Villages, FL | 2.0 | 2.0 | 1188 | $2,475 | $2.08 | 22d | 1 | 0.06mi |
| 2014 Johnson Ct The Villages, FL | 2.0 | 2.0 | 1156 | $2,000 | $1.73 | 22d | 1 | 0.61mi |
| 470 Oboe Way The Villages, FL | 2.0 | 2.0 | 1240 | $2,200 | $1.77 | 22d | 1 | 1.02mi |
| 445 Corbett Dr The Villages, FL | 2.0 | 2.0 | 1100 | $2,700 | $2.45 | 22d | 1 | 1.13mi |
| 2368 McClellanville Ter The Villages, FL | 2.0 | 2.0 | 1142 | $4,800 | $4.20 | 22d | 1 | 1.20mi |
| 2372 Travis Pl The Villages, FL | 2.0 | 2.0 | 1188 | $2,000 | $1.68 | 22d | 1 | 1.30mi |
| 1607 Allendale Pl The Villages, FL | 2.0 | 2.0 | 1156 | $2,800 | $2.42 | 22d | 1 | 1.35mi |
| 2383 Camden Ter The Villages, FL | 2.0 | 2.0 | 1182 | $2,500 | $2.12 | 22d | 1 | 1.38mi |
| 1240 Pageland Way The Villages, FL | 2.0 | 2.0 | 1100 | $2,400 | $2.18 | 22d | 1 | 1.39mi |
| 1315 Fort Lawn Loop The Villages, FL | 2.0 | 2.0 | 1392 | $4,500 | $3.23 | 22d | 1 | 1.44mi |
Listing history 12 events
-
2026-06-22days on market $270,000 Active 17 DOM
-
2026-06-19days on market $270,000 Active 15 DOM
-
2026-06-18days on market $270,000 Active 14 DOM
-
2026-06-17days on market $270,000 Active 13 DOM
-
2026-06-16days on market $270,000 Active 12 DOM
-
2026-06-15days on market $270,000 Active 11 DOM
-
2026-06-14days on market $270,000 Active 9 DOM
-
2026-06-13days on market $270,000 Active 8 DOM
-
2026-06-10days on market $270,000 Active 6 DOM
-
2026-06-09days on market $270,000 Active 5 DOM
-
2026-06-08remarks 699-char remark
-
2026-06-08$270,000 Active 4 DOM
ⓘ Source: listings_history table (triggers on properties + properties_extension) + one-shot
backfill from property_details.listing_events for pre-trigger history.
Tax reassessment forecast FL · Resets to sale price
- Current annual tax
- $3,327 · $277/mo
- Projected year-2 tax
- $3,327 · $277/mo
- Expected delta
- $0/yr ($0/mo · 0.0%)
ⓘ Screening estimate from a state-policy table — verify with the county assessor before closing.
Climate risk First Street
- Flood 1/10 Low FEMA zone X (unshaded) · 0% chance over 30 yrs
- Wildfire 4/10 Moderate
- Heat 9/10 Extreme 7 d/yr ≥108°F today · 23 d/yr by 30 yrs out
- Wind 9/10 Extreme 99% chance of damaging wind over 30 yrs
- Air quality 3/10 Moderate 2 unhealthy d/yr today · 3 by 30 yrs out
Nearby sold comps map
Loading sold comps map…
Walkable amenities ~0.75 mi
Loading nearby amenities…
Taxation est. · year 1
- Rental income
- $29,980
- − Mortgage interest
- −$15,124
- − Property taxes
- −$3,327
- − Insurance
- −$1,350
- − Repairs & maintenance
- −$2,398
- − Management
- −$2,398
- − Depreciation
- −$7,855
- Taxable loss
- −$2,472
- Est. tax savings @ 24.0%
- +$593
- After-tax cash flow
- $2,610/yr
For passive investors: Depreciation is non-cash, so a rental often shows a tax loss while cash-flowing — sheltering income. Rental losses are passive: they offset passive income freely, and up to $25,000/yr can offset ordinary (W-2) income if you actively participate and your MAGI is under $100k (phasing out to $0 by $150k); unused losses carry forward. On sale, claimed depreciation is recaptured at up to 25%, and gains may owe capital-gains tax (a 1031 exchange can defer both). Figures are a year-1 estimate at your 24.0% rate — not tax advice; consult a CPA.
Schools (NCES district)
- District
- Sumter
- NCES district ID
- 1201800
- Math proficiency
- 61% ▼ -4.00%
- Reading proficiency
- 61% ▼ -2.00%
- Median HH income
- $48,240
- Composite
- 51.74/100
- National rank
- #1682
- State rank
- #11 of 73 in FL
Livability — The Villages
- Score
- 70/100
- State rank
- #431
- US rank
- #7363
Category grades
Schools grade is shown separately in the Schools card above.
Census & demographics
- Census place
- The Villages, FL
- County
- Sumter County · 110,591 people
- City population
- 83,973
- Metro
- The Villages, FL
- Population (ZIP)
- 55,424
- Household income
- $74,119
- Rent vs Own
- Severe rent burden
- 987.0
Population outlook (Sumter County) Hauer SSP2
- Today (2025)
- 161,172 people
- By 2030
- 180,083 · +11.7%
- By 2040
- 209,892 · +30.2%
- By 2050
- 234,186 · +45.3%
- By 2075
- 284,602 · +76.6%
- By 2100
- 317,039 · +96.7%
Race, ethnicity, and origin ACS 2023
- Neighborhood character
- Predominantly White (95%)
- Race & ethnicity
- White 95% Two or more races 2% Hispanic / Latino 2% Asian 1% Black 1%
- Common ancestry
- Romanian 7% Slovak 4% Lithuanian 4%
- Foreign-born
- 5% · Canada
- Languages at home
- 96% English-only · Spanish 1% Tagalog/Filipino 1%
Political lean MEDSL · Sumter
- 2024 margin
- Solid R (+37.6) · D 30.9% · R 68.6%
- 2008→2024 swing
- -10.6pp toward R · 2008: -27.0pp · 2024: -37.6pp
- All cycles
- 2024: R+37.6 2020: R+36.1 2016: R+39.2 2012: R+34.9 2008: R+27.0
Not yet ingested
- Civics
- —
Market trends
- HPI YoY
- ▼ -16.16%
- Current HPI
- 218.1956
- Rent YoY
- ▲ 3.92%
- Metro
- The Villages, FL
- State GDP YoY
- ▲ 3.28%
- F500 in state
- 36
Industry mix (Fortune 500 HQ in FL)
| Industry | F500 HQs | Revenue |
|---|---|---|
| Industrial Technology | 2 | $29B |
|
||
| Insurance | 2 | $17B |
|
||
| Retail | 1 | $60B |
|
||
| Technology Distribution | 1 | $58B |
|
||
| Homebuilding | 1 | $35B |
|
||
| Technology Manufacturing | 1 | $35B |
|
||
Price history
-6.2% since first listed15 events — show timeline
- 2026-06-04 Listed $270,000 ForSaleByOwner.com
- 2025-09-22 Sold (Public Records) $270,000 Public Records
- 2025-09-16 Sold (MLS) $270,000 Stellar MLS as Distributed by MLS Grid
- 2025-08-26 Rental Removed $4,500 RENTALBEAST
- 2025-08-24 Listed for Rent $4,500 RENTALBEAST
- 2025-08-23 Rental Removed $4,500 PROPERTYWARE
- 2025-08-18 Pending — Stellar MLS as Distributed by MLS Grid
- 2025-08-15 Price Changed $275,000 Stellar MLS as Distributed by MLS Grid
- 2025-08-03 Listed for Rent $4,500 PROPERTYWARE
- 2025-07-20 Price Changed $278,000 Stellar MLS as Distributed by MLS Grid
- 2025-06-16 Price Changed $289,600 Stellar MLS as Distributed by MLS Grid
- 2025-05-06 Price Changed $294,000 Stellar MLS as Distributed by MLS Grid
- 2025-04-14 Listed $299,999 Stellar MLS as Distributed by MLS Grid
- 2023-10-26 Sold (Public Records) $289,800 Public Records
- 2022-02-08 Sold (Public Records) $287,900 Public Records
Property tax history
+4.9%/yrLatest (2025): $3,327 · -2.4% YoY. Source: county tax records.
Cash-flow waterfall
monthlySold comps — $/sqft
last 12 mo · ≤1 miLoading sold comps…