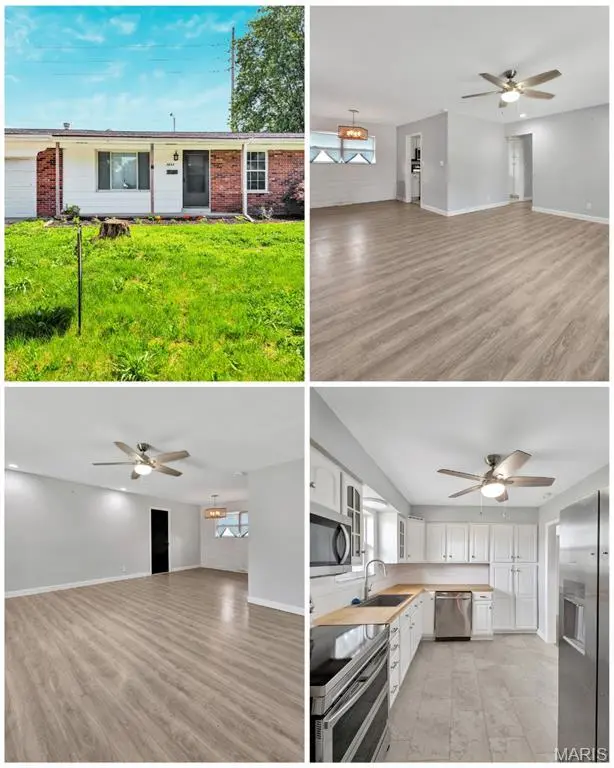
7632 Westchester Dr · Belleville, IL
Flood risk 1/10 · Minimal
- FEMA flood zone
- X
- Chance of flooding over 30 yrs
- 0.0%
- Est. flood insurance / yr
- $507 – $1,088
Fire risk 1/10 · Minimal
- Est. fire insurance / yr
- $804 – $1,492
Heat risk 5/10 · Moderate
- Hot days now (above 107°F)
- 7 days/yr
- Hot days in 30 yrs
- 21 days/yr
Wind risk 2/10 · Minimal
- Chance of severe wind over 30 yrs
- 1.0%
Air-quality risk 3/10 · Minor
- Unhealthy air days now
- 2 days/yr
- Unhealthy air days in 30 yrs
- 3 days/yr
Risk factors via First Street. Map © Google.
Why this score? — see what drove the D- grade
The composite is a weighted blend of 9 inputs, each scored 0–100. Each bar is that input's sub-score; the figure is the points it added to the 100-point composite (weight × sub-score).
- Appreciation +9.8/10.0
- Cash flow +9.2/30.0
- Livability +3.9/5.0
- ARV discount +3.6/15.0
- 1% rule +3.4/10.0
- DSCR +2.6/10.0
- Rent growth +2.5/5.0
- Condition / age +2.5/5.0
- Schools +2.2/10.0
$162,500
🖨 Deal sheet (PDF) 📄 Offer letter ✓ Due diligence
Listing remarks MLS
Price Reduced ~ Just a little cleaning up outside with new paint and flooring and you have got yourself a nice home! Large fenced backyard with two sheds that stay for extra storage! Three beds and bath ~ kitchen remodeled in last few years with separate dining area. Come take a look!
Key facts
- 9,583 sq ft lot
- Garage
- Built 1965
Property features AI
Finance
- Financial info: No second mortgage indicated
Exterior
- Parking: Attached garage (1 car)
- Utilities: Public water; Public sewer; Electric service (Ameren); Electricity connected; Water connected; Sewer connected
- Home design: Single-family residence; One level
- Construction: Brick exterior; Architectural shingle roof
- Exterior features: Front yard; Back yard; Shed(s)
Interior
- Kitchen: Main-level kitchen (12x9)
- Bedrooms: Three bedrooms, all on the main level (13x10; 10x10; plus one with unspecified dimensions)
- Bathrooms: One full bathroom on the main level (9x7)
- Heating & cooling: Forced air heating; Central air conditioning
- Interior features: Living room (17x14); Dining room (10x10); Additional main-level room (14x10)
Neighborhood map
What this means for you Summary
Snapshot
- This is a 3-bed/2.0-bath single-family listed at $162k.
Deal economics
- At list price, monthly cash flow is $-121 ($-1k/yr) — negative.
- To cash-flow at today's rent, offer at most $141k (13.1% below list).
- To meet the 1% rule (rent ≥ 1% of price), the offer needs to be $136k (16.1% below list).
- Recommended offer: $136k (16.1% below list) — sets the bar for 1% rule.
Location & tenants
- Location reads 78/100 on livability (#142 in IL, #2,604 nationally) — a middle-class / working-renter tenant base. Strengths: commute A+, cost of living A+, housing A+; Watch: crime F, amenities D-.
- Belleville Twp Hsd 201 (suburban): math 21% / reading 28% proficiency, ranked #308 of 620 in IL (top 50%) — low school quality limits family demand, transient renter base, plan for 1-2y turnover.
- Zoned schools: Ellis Elem School (math 34% / reading 34%, grade F, #517 of 2,056 statewide, top 28%, 358 students, 0% FRL); Harmony Intermediate Center (math 11% / reading 18%, grade F, #517 of 665 statewide, top 79%, 227 students, 0% FRL); Belleville High School-West (math 19% / reading 26%, grade F, #317 of 693 statewide, top 46%, 2,234 students, 0% FRL).
- Market conditions: 102 active listings in the ZIP; 3 comparable units currently listed for rent nearby; rentals at typical pace (median 15d on market — plan ~3-4 weeks tenant-placement turnaround); 783 units permitted in St. Clair County in 2024 (378 in 5+ unit buildings).
Forward outlook
- In year one you build about $17k of equity ($1k loan paydown + $15k appreciation (9.5% local appreciation)).
- St. Clair County population projected at -23% by 2050 — secular population decline; favor cash flow + early exit over multi-decade hold.
- By year 3, paydown + projected appreciation supports a ~$42k cash-out refi (75% LTV) — recoverable capital for the next deal without selling this one.
Negotiation context
- It's been on market 81 days — a 6% lower offer ($153k) is reasonable based on typical stale-listing flexibility.
- 5 sale attempts since 6y ago; this cycle's ask has dropped $12k (7%) from the opening price — seller is motivated, your offer sets the floor, not the list.
- Current owner paid $54k; list at $162k implies a 204% gain — meaningful room to come down on a strong offer.
Risks & watch-outs
- Climate carrying-cost: extreme-heat days projected 7→21/yr by 2055 (HVAC capex compounding) — expect insurance premiums to compound above CPI over the hold.
Questions for the listing agent
- What do current leases actually rent for vs. the listed asking? Can we see a recent rent roll and the last 12 months of T-12 income?
- It's been on market 81 days. Have you received any prior offers? Is the seller open to a 16% concession, seller financing, or rate buy-down credit?
- Built in 1965 — when were the roof, HVAC, electrical panel, plumbing, and water heater last replaced?
- Why hasn't it sold? Are there any deal-killer items the seller is aware of (foundation, flood, title, zoning, code violations)?
- Is there a deadline driving the sale (1031 exchange, divorce, estate, relocation)? That informs how much negotiation room exists.
- Crime grade is F in this area — have there been break-ins, vandalism, or insurance claims at this property in the last 3 years? What carrier currently insures it and at what premium?
- The area grade is low — what's the realistic commute time and amenity access for the typical tenant pool here? Any planned neighborhood developments (good or bad) we should know about?
- What's the average days-on-market for RENTAL listings here right now (not sales)? A rising rental-DOM trend means longer vacancies and softer asking-rent achievability than the comps imply.
- What's the recent tenant-quality profile in this submarket — average credit score on applications, eviction rate, late-payment / NSF rate, and stable-employment percentage? A property-management company in the area should have these aggregated.
- How much new for-sale + rental construction is in the pipeline within 1–3 miles? Heavy new supply typically softens prices + rents 12–24 months out; constrained supply supports both.
Investment metrics
- 1% rule
- 0.84% ✗
- Cap rate
- 5.40%
- Cash-on-cash
- -3.19%
- DSCR
- 0.86
- GRM
- 9.9
CMA / ARV
- ARV (on-the-fly)
- $149,600
- Comps found
- 12
Show comp detail 12 sales within ~0.75 mi
| Address | Dist | Beds/Ba | Sqft | Sold | Price | $/sf | Match |
|---|---|---|---|---|---|---|---|
| 204 Whitehall Ct | 0.39mi | 3/2.0 | 1,184 (+8%) | 5mo | $149,900 | $127 | 65 |
| 116 Lynnhaven Dr | 0.13mi | 3/1.0 | 1,232 (+12%) | 10mo | $165,000 | $134 | 62 |
| 13 Chamberlain Ct | 0.61mi | 2/1.0 (-1) | 1,110 (+1%) | 1mo | $165,000 | $149 | 60 |
| 1218 Express Dr | 0.48mi | 3/1.5 | 991 (-10%) | 1mo | $115,000 | $116 | 58 |
| 22 Briarwood Dr | 0.63mi | 3/1.0 | 1,100 (0%) | 12mo | $159,900 | $145 | 57 |
| 905 Blue Ridge Dr | 0.57mi | 3/1.0 | 1,152 (+5%) | 7mo | $181,500 | $158 | 56 |
| 212 Dorchester Dr | 0.50mi | 3/1.0 | 1,150 (+4%) | 12mo | $125,000 | $109 | 55 |
| 311 Chevy Chase Dr | 0.74mi | 3/2.5 | 1,176 (+7%) | 1mo | $245,000 | $208 | 51 |
| 928 Werner Rd | 0.64mi | 2/1.0 (-1) | 1,100 (0%) | 14mo | $149,900 | $136 | 50 |
| 7112 Carr Dr | 0.61mi | 3/1.0 | 1,079 (-2%) | 18mo | $139,500 | $129 | 49 |
| 8317 Old Saint Louis Rd | 0.62mi | 2/1.0 (-1) | 1,060 (-4%) | 12mo | $180,000 | $170 | 46 |
| 7108 Carr Dr | 0.63mi | 2/1.0 (-1) | 1,152 (+5%) | 14mo | $144,900 | $126 | 42 |
Match score weights: distance 35% · size 25% · config 20% · recency 20%. Top-matched comps best support the ARV.
Projected returns pro-forma
9.5% appreciation · 3.0% rent growth · sell at horizon
- IRR
- 20.9%
- Equity multiple
- 2.66×
- Total profit
- $75,325
- Equity at exit
- $140,499
- IRR
- 19.1%
- Equity multiple
- 5.98×
- Total profit
- $226,679
- Equity at exit
- $296,931
Cash invested: $45,500 (down + closing). Projections, not guarantees.
Landlord ↔ Tenant lean methodology
- Overall (STATE)
- 43 Moderately Tenant-Leaning
- State Illinois
- 43 Moderately Tenant-Leaning · D+7
- County
- — inherits STATE
- City
- — inherits STATE
ZIP-level market 62223
- Home prices YoY
- 3.8%
- Active inventory
- 102
- Price-to-rent
- 9.9×
Monthly cashflow live
- Estimated rent
- $1,363 medium interval (Pro) →
- Mortgage (P&I)
- −$852
- Tax from tax record
- −$278 /mo · $3,333/yr
- Insurance
- −$68
- HOA
- −$0
- Lot rent
- −$0
- Vacancy / Maint / Mgmt
- −$286
- Net cashflow
- $-121
Break-even live
Sensitivity live
| Price | -10% $-29 | -5% $-75 | +0% $-121 | +5% $-167 | +10% $-213 |
|---|---|---|---|---|---|
| Rent | -10% $-229 | -5% $-175 | +0% $-121 | +5% $-67 | +10% $-13 |
| Rate | -1.0pp $-39 | -0.5pp $-80 | base $-121 | +0.5pp $-163 | +1.0pp $-206 |
UW: 25.0% down · 7.5% · 30yr · 1.5% tax · 5.0% vac · 8.0% maint · 8.0% mgmt
Financing live
Cash to close
- Down payment
- $40,625
- Closing costs
- $4,875
- Reserves months
- —
- Total cash needed
- —
Loan-product check · same deal, 3 products live
Conventional
25% down · 7.5% · 30yr
- Down + closing
- —
- Monthly P&I
- —
- Monthly cashflow
- —
- DSCR
- —
- Eligible?
- —
Personal DTI + credit; lowest rate.
DSCR
20% down · 8.5% · 30yr
- Down + closing
- —
- Monthly P&I
- —
- Monthly cashflow
- —
- DSCR
- —
- Eligible?
- —
No personal income docs; deal must DSCR.
Hard money
10% down · 12.0% · 12mo
- Down + closing
- —
- Monthly P&I
- —
- Monthly cashflow
- —
- DSCR
- —
- Eligible?
- —
Short-term bridge; refi at stabilization.
Rent comps 3 comps
| Address | Beds | Baths | Sqft | Rent | $/sqft | DOM | Units | Dist |
|---|---|---|---|---|---|---|---|---|
| 920 S 74th St Belleville, IL | 2.0 | 1.0 | 1300 | $1,400 | $1.08 | 15d | 1 | 0.42mi |
| 7235 Westfield Plaza Dr Belleville, IL | 1.0–2.0 | 1.0 | 795 | $975 | $1.23 | 5d | 1 | 0.62mi |
| 6105 W Washington St Belleville, IL | 3.0 | 1.5 | 1120 | $1,575 | $1.41 | 26d | 1 | 1.27mi |
Listing history 31 events
-
2026-06-22days on market $162,500 Active 81 DOM
-
2026-06-21days on market $162,500 Active 80 DOM
-
2026-06-19price $162,500 Active 77 DOM
-
2026-06-18days on market $174,500 Active 77 DOM
-
2026-06-17days on market $174,500 Active 76 DOM
-
2026-06-16days on market $174,500 Active 75 DOM
-
2026-06-15days on market $174,500 Active 74 DOM
-
2026-06-13days on market $174,500 Active 72 DOM
-
2026-06-09days on market $174,500 Active 68 DOM
-
2026-06-08days on market $174,500 Active 67 DOM
-
2026-06-07days on market $174,500 Active 66 DOM
-
2026-06-03days on market $174,500 Active 62 DOM
-
2026-06-02days on market $174,500 Active 61 DOM
-
2026-06-02price $174,500 Active 60 DOM
-
2026-06-01days on market $174,900 Active 60 DOM
-
2026-05-31days on market $174,900 Active 59 DOM
-
2026-04-03$175,000 Active
-
2026-03-27historical $175,000
-
2021-05-21soldstatus $53,500
-
2021-05-03soldstatus Closed 285-char remark
Show marketing remark (285 chars)
Price Reduced ~ Just a little cleaning up outside with new paint and flooring and you have got yourself a nice home! Large fenced backyard with two sheds that stay for extra storage! Three beds and bath ~ kitchen remodeled in last few years with separate dining area. Come take a look!
-
2021-04-07status Pending 285-char remark
Show marketing remark (285 chars)
Price Reduced ~ Just a little cleaning up outside with new paint and flooring and you have got yourself a nice home! Large fenced backyard with two sheds that stay for extra storage! Three beds and bath ~ kitchen remodeled in last few years with separate dining area. Come take a look!
-
2021-04-03status Active 285-char remark
Show marketing remark (285 chars)
Price Reduced ~ Just a little cleaning up outside with new paint and flooring and you have got yourself a nice home! Large fenced backyard with two sheds that stay for extra storage! Three beds and bath ~ kitchen remodeled in last few years with separate dining area. Come take a look!
-
2021-03-26status Pending 285-char remark
Show marketing remark (285 chars)
Price Reduced ~ Just a little cleaning up outside with new paint and flooring and you have got yourself a nice home! Large fenced backyard with two sheds that stay for extra storage! Three beds and bath ~ kitchen remodeled in last few years with separate dining area. Come take a look!
-
2021-03-24price $50,000 285-char remark
Show marketing remark (285 chars)
Price Reduced ~ Just a little cleaning up outside with new paint and flooring and you have got yourself a nice home! Large fenced backyard with two sheds that stay for extra storage! Three beds and bath ~ kitchen remodeled in last few years with separate dining area. Come take a look!
-
2021-03-22status Active 285-char remark
Show marketing remark (285 chars)
Price Reduced ~ Just a little cleaning up outside with new paint and flooring and you have got yourself a nice home! Large fenced backyard with two sheds that stay for extra storage! Three beds and bath ~ kitchen remodeled in last few years with separate dining area. Come take a look!
-
2021-03-01historical Active Under Contract 285-char remark
Show marketing remark (285 chars)
Price Reduced ~ Just a little cleaning up outside with new paint and flooring and you have got yourself a nice home! Large fenced backyard with two sheds that stay for extra storage! Three beds and bath ~ kitchen remodeled in last few years with separate dining area. Come take a look!
-
2021-02-09status Active 285-char remark
Show marketing remark (285 chars)
Price Reduced ~ Just a little cleaning up outside with new paint and flooring and you have got yourself a nice home! Large fenced backyard with two sheds that stay for extra storage! Three beds and bath ~ kitchen remodeled in last few years with separate dining area. Come take a look!
-
2021-02-08historical Active Under Contract 285-char remark
Show marketing remark (285 chars)
Price Reduced ~ Just a little cleaning up outside with new paint and flooring and you have got yourself a nice home! Large fenced backyard with two sheds that stay for extra storage! Three beds and bath ~ kitchen remodeled in last few years with separate dining area. Come take a look!
-
2020-12-29$79,900 Active 285-char remark
Show marketing remark (285 chars)
Price Reduced ~ Just a little cleaning up outside with new paint and flooring and you have got yourself a nice home! Large fenced backyard with two sheds that stay for extra storage! Three beds and bath ~ kitchen remodeled in last few years with separate dining area. Come take a look!
-
2004-07-30soldstatus $93,000
-
2003-07-03soldstatus $91,000
ⓘ Source: listings_history table (triggers on properties + properties_extension) + one-shot
backfill from property_details.listing_events for pre-trigger history.
Tax reassessment forecast IL · Partial reset (capped growth)
- Current annual tax
- $3,333 · $278/mo
- Projected year-2 tax
- $3,511 · $293/mo
- Expected delta
- +$178/yr (+$15/mo · 5.3%)
ⓘ Screening estimate from a state-policy table — verify with the county assessor before closing.
Climate risk First Street
- Flood 1/10 Low FEMA zone X · 0% chance over 30 yrs
- Wildfire 1/10 Low
- Heat 5/10 Major 7 d/yr ≥107°F today · 21 d/yr by 30 yrs out
- Wind 2/10 Low 100% chance of damaging wind over 30 yrs
- Air quality 3/10 Moderate 2 unhealthy d/yr today · 3 by 30 yrs out
Nearby sold comps map
Loading sold comps map…
Walkable amenities ~0.75 mi
Loading nearby amenities…
Taxation est. · year 1
- Rental income
- $16,354
- − Mortgage interest
- −$9,103
- − Property taxes
- −$3,333
- − Insurance
- −$812
- − Repairs & maintenance
- −$1,308
- − Management
- −$1,308
- − Depreciation
- −$4,727
- Taxable loss
- −$4,237
- Est. tax savings @ 24.0%
- +$1,017
- After-tax cash flow
- $-434/yr
For passive investors: Depreciation is non-cash, so a rental often shows a tax loss while cash-flowing — sheltering income. Rental losses are passive: they offset passive income freely, and up to $25,000/yr can offset ordinary (W-2) income if you actively participate and your MAGI is under $100k (phasing out to $0 by $150k); unused losses carry forward. On sale, claimed depreciation is recaptured at up to 25%, and gains may owe capital-gains tax (a 1031 exchange can defer both). Figures are a year-1 estimate at your 24.0% rate — not tax advice; consult a CPA.
Schools (NCES district)
- District
- Belleville Twp Hsd 201
- NCES district ID
- 1705640
- Math proficiency
- 21% ▼ -8.00%
- Reading proficiency
- 28% ▼ -3.00%
- Median HH income
- $58,064
- Composite
- 22.39/100
- National rank
- #8115
- State rank
- #308 of 620 in IL
Livability — Belleville
- Score
- 78/100
- State rank
- #142
- US rank
- #2604
Category grades
Schools grade is shown separately in the Schools card above.
Census & demographics
- County
- Saint Clair County · 169,691 people
- City population
- 47,407
- Metro
- St. Louis, MO-IL
- Population (ZIP)
- 16,269
- Household income
- $73,700
- Rent vs Own
- Severe rent burden
- 656.0
Population outlook (St. Clair County) Hauer SSP2
- Today (2025)
- 250,366 people
- By 2030
- 240,511 · -3.9%
- By 2040
- 217,391 · -13.2%
- By 2050
- 192,699 · -23.0%
- By 2075
- 140,637 · -43.8%
- By 2100
- 100,499 · -59.9%
Race, ethnicity, and origin ACS 2023
- Neighborhood character
- Majority White (62%)
- Race & ethnicity
- White 62% Black 27% Two or more races 9% Hispanic / Latino 4%
- Common ancestry
- Romanian 3% Lithuanian 3% Slovak 2%
- Foreign-born
- 2% · Canada, Guatemala
- Languages at home
- 96% English-only · Spanish 2%
Political lean MEDSL · St. Clair
- 2024 margin
- Lean D (+7.9) · D 53.0% · R 45.1% · Other 1.8%
- 2008→2024 swing
- -14.6pp toward R · 2008: 22.4pp · 2024: 7.9pp
- All cycles
- 2024: D+7.9 2020: D+8.7 2016: D+5.6 2012: D+14.5 2008: D+22.4
Not yet ingested
- Civics
- —
Market trends
- HPI YoY
- ▲ 9.50%
- Current HPI
- 259.15
- Rent YoY
- —
- Metro
- St. Louis, MO-IL
- State GDP YoY
- ▲ 1.59%
- F500 in state
- 60
Industry mix (Fortune 500 HQ in IL)
| Industry | F500 HQs | Revenue |
|---|---|---|
| Insurance | 4 | $201B |
|
||
| Consumer Goods | 4 | $87B |
|
||
| Industrial Machinery | 3 | $64B |
|
||
| Healthcare | 2 | $55B |
|
||
| Retail / Pharmacy | 1 | $148B |
|
||
| Agriculture / Food | 1 | $86B |
|
||
Price history
+92.3% since first listed15 events — show timeline
- 2026-04-03 Listed $175,000 MARIS as Distributed by MLS Grid
- 2026-03-27 Coming Soon $175,000 MARIS as Distributed by MLS Grid
- 2021-05-21 Sold (Public Records) $53,500 Public Records
- 2021-05-03 Sold (MLS) — MARIS as Distributed by MLS Grid
- 2021-04-07 Pending — MARIS as Distributed by MLS Grid
- 2021-04-03 Relisted — MARIS as Distributed by MLS Grid
- 2021-03-26 Pending — MARIS as Distributed by MLS Grid
- 2021-03-24 Price Changed $50,000 MARIS as Distributed by MLS Grid
- 2021-03-22 Relisted — MARIS as Distributed by MLS Grid
- 2021-03-01 Contingent — MARIS as Distributed by MLS Grid
- 2021-02-09 Relisted — MARIS as Distributed by MLS Grid
- 2021-02-08 Contingent — MARIS as Distributed by MLS Grid
- 2020-12-29 Listed $79,900 MARIS as Distributed by MLS Grid
- 2004-07-30 Sold (Public Records) $93,000 Public Records
- 2003-07-03 Sold (Public Records) $91,000 Public Records
Property tax history
+4.2%/yrLatest (2024): $3,333 · +7.1% YoY. Source: county tax records.
Cash-flow waterfall
monthlySold comps — $/sqft
last 12 mo · ≤1 miLoading sold comps…