 🏗️ New Construction
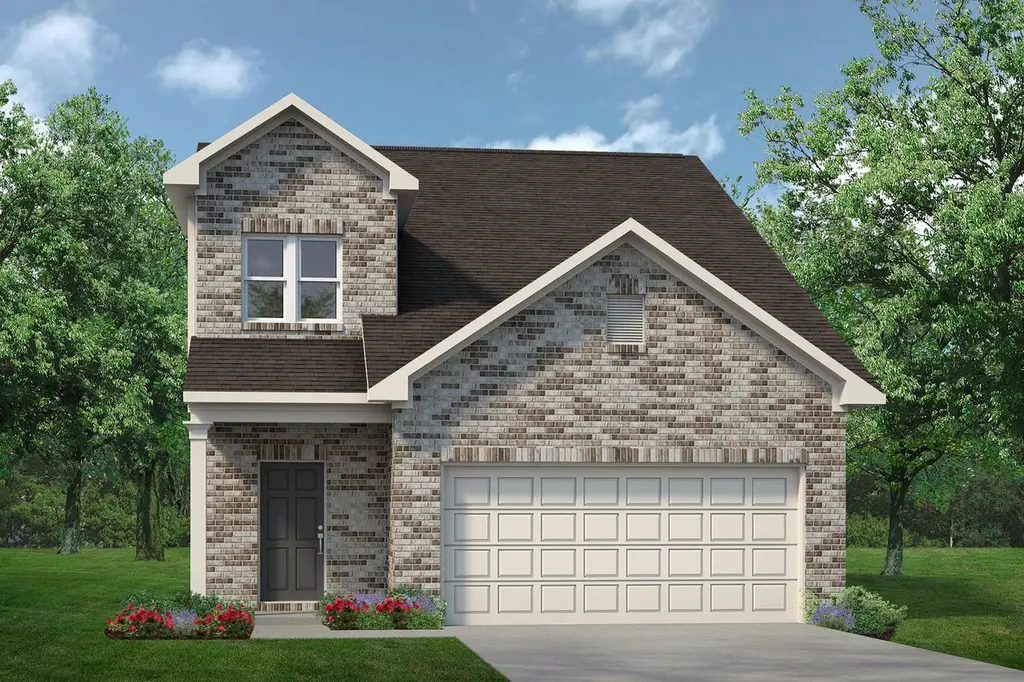
The Sparrow II Plan · Willis, TX
Flood risk 1/10 · Minimal
- FEMA flood zone
- X (unshaded)
- Chance of flooding over 30 yrs
- 0.0%
- Est. flood insurance / yr
- $507 – $1,088
Fire risk 5/10 · Moderate
- Est. fire insurance / yr
- $1,222 – $2,270
Heat risk 8/10 · Major
- Hot days now (above 111°F)
- 7 days/yr
- Hot days in 30 yrs
- 23 days/yr
Wind risk 8/10 · Major
- Chance of severe wind over 30 yrs
- 99.0%
Air-quality risk 2/10 · Minimal
- Unhealthy air days now
- 1 days/yr
- Unhealthy air days in 30 yrs
- 1 days/yr
Risk factors via First Street. Map © Google.
Why this score? — see what drove the D grade
The composite is a weighted blend of 9 inputs, each scored 0–100. Each bar is that input's sub-score; the figure is the points it added to the 100-point composite (weight × sub-score).
- Cash flow +14.0/30.0
- ARV discount +7.5/15.0
- DSCR +4.2/10.0
- Condition / age +4.0/5.0
- 1% rule +3.9/10.0
- Schools +3.2/10.0
- Livability +3.1/5.0
- Rent growth +2.0/5.0
- Appreciation +0.0/10.0
$248,990
🖨 Deal sheet (PDF) 📄 Offer letter ✓ Due diligence
Listing remarks
The Sparrow II offers great versatility with an open-concept kitchen, dining, and family room on the first floor. The primary suite at the back of the main level features a stylish en suite bathroom and a spacious walk-in closet. Upstairs, you'll find three bedrooms, a full bathroom, and a large loft area, which can be converted into a fifth bedroom and a third bathroom. Enhance your backyard by adding a covered rear patio for the perfect outdoor space.
Key facts
- Large loft area
- Open-concept kitchen
- Covered rear patio
Tags
Property features AI
Finance
- Financial info: List price $248,990
Exterior
- Parking: 2 parking spaces
- Utilities: Has heating; Has cooling
- Home design: Single-family plan (The Sparrow II)
- Exterior features: Living area approximately 2397; Located at 12595 Canyon Falls Blvd, Willis TX 77318
Interior
- Bedrooms: 4 bedrooms
- Bathrooms: 2 full bathrooms; 1 half bathroom
- Heating & cooling: Heat pump heating; Central air conditioning
- Interior features: Plan is The Sparrow II (new construction plan); Active listing
Neighborhood map
What this means for you Summary
Snapshot
- This is a 4-bed/2.5-bath single-family listed at $249k. Condition is rated good.
Deal economics
- At list price, monthly cash flow is $36 ($433/yr) — positive.
- The deal already cash-flows at list — no discount required.
- To meet the 1% rule (rent ≥ 1% of price), the offer needs to be $248k (0.4% below list).
- Recommended offer: $245k (1.5% below list) — sets the bar for market timing.
- Cap rate 6.4% vs local median 4.7% in Willis — top-decile yield for the area; either an underpriced asset or a hidden risk that comps aren't pricing in. Stress-test before assuming the spread holds.
Location & tenants
- Location reads 62/100 on livability (#933 in TX) — a middle-class / working-renter tenant base. Strengths: cost of living A+, housing A+; Watch: crime C-, employment D+, amenities F.
- Willis ISD (rural): math 33% / reading 40% proficiency, ranked #458 of 826 in TX (top 55%) — families likely to look elsewhere, expect single-tenant / working-renter base with shorter leases.
- Zoned schools: C C Hardy El (math 32% / reading 29%, grade F, #2,464 of 4,322 statewide, top 58%, 752 students, 83% FRL); Lynn Lucas Middle (math 23% / reading 32%, grade F, #1,156 of 1,662 statewide, top 71%, 971 students, 74% FRL); Willis H S (math 19% / reading 46%, grade F, #1,029 of 1,632 statewide, top 64%, 2,521 students, 57% FRL) — zoned schools average 71% FRL vs 56% district-wide (16 pts higher); higher-poverty schools than district average — tighter screening recommended.
- Market conditions: Rents soft (-2.1%/yr); 1199 active listings in the ZIP; 1 comparable units currently listed for rent nearby; solid renter incomes; 13,259 units permitted in Montgomery County in 2024 (1,402 in 5+ unit buildings).
- This rent runs 32% of the median local income ($92k/yr) — at the standard rent-burdened threshold; future hikes will face affordability resistance.
Forward outlook
- Local home prices are declining (-3.0%/yr); year-one equity from $2k of loan paydown is wiped out by about $8k of value loss. Plan a longer hold.
- Montgomery County population projected at +65% by 2050 — long-run rental-demand tailwind backs the buy-and-hold thesis.
Negotiation context
- It's been on market 23 days — a 2% lower offer ($245k) is reasonable based on typical stale-listing flexibility.
Risks & watch-outs
- Climate carrying-cost: severe wind risk, 99% chance of damaging wind over 30y; moderate wildfire risk; extreme-heat days projected 7→23/yr by 2055 (HVAC capex compounding) — expect insurance premiums to compound above CPI over the hold.
Questions for the listing agent
- Is there a deadline driving the sale (1031 exchange, divorce, estate, relocation)? That informs how much negotiation room exists.
- Schools are D-rated, which usually means shorter tenancies and higher turnover. Who's the typical renter profile here, and what's been the actual vacancy rate?
- The area grade is low — what's the realistic commute time and amenity access for the typical tenant pool here? Any planned neighborhood developments (good or bad) we should know about?
- What's the average days-on-market for RENTAL listings here right now (not sales)? A rising rental-DOM trend means longer vacancies and softer asking-rent achievability than the comps imply.
- What's the recent tenant-quality profile in this submarket — average credit score on applications, eviction rate, late-payment / NSF rate, and stable-employment percentage? A property-management company in the area should have these aggregated.
- How much new for-sale + rental construction is in the pipeline within 1–3 miles? Heavy new supply typically softens prices + rents 12–24 months out; constrained supply supports both.
Investment metrics
- 1% rule
- 0.89% ✗
- Cap rate
- 6.45%
- Cash-on-cash
- 0.56%
- DSCR
- 1.02
- GRM
- 9.4
CMA / ARV
- ARV (median comp)
- $278,238
- List price
- $248,990
- Delta
- -10.51%
- Verdict
- UNDERPRICED
- Comps
- 20 within 1.0 mi
Show comp detail 10 sales within ~0.75 mi
| Address | Dist | Beds/Ba | Sqft | Sold | Price | $/sf | Match |
|---|---|---|---|---|---|---|---|
| 12575 Canyon Falls Blvd | 0.07mi | 4/3.0 | 2,402 (+0%) | 20mo | $310,000 | $129 | 78 |
| 9749 Enclave Ridge Rd | 0.13mi | 4/2.5 | 2,173 (-9%) | 2mo | $282,555 | $130 | 76 |
| 9765 Enclave Ridge Rd | 0.15mi | 4/2.5 | 2,173 (-9%) | 4mo | $290,160 | $134 | 74 |
| 12375 Sunset Canyon Way | 0.27mi | 4/3.5 | 2,253 (-6%) | 1mo | $288,075 | $128 | 72 |
| 12307 Sunset Canyon Way | 0.25mi | 4/3.5 | 2,253 (-6%) | 6mo | $334,910 | $149 | 69 |
| 12739 Woodcreek Dr | 0.41mi | 3/3.0 (-1) | 2,284 (-5%) | 0mo | $340,000 | $149 | 66 |
| 9758 Enclave Ridge Rd | 0.16mi | 3/2.5 (-1) | 2,061 (-14%) | 2mo | $259,990 | $126 | 63 |
| 12079 Noble Heart Dr | 0.35mi | 4/3.5 | 2,300 (-4%) | 18mo | $350,000 | $152 | 58 |
| 240 River Grove St | 0.75mi | 5/3.0 (+1) | 2,358 (-2%) | 15mo | $314,990 | $134 | 43 |
| 13074 Falling Oak Dr | 0.58mi | 4/2.0 | 2,128 (-11%) | 21mo | $155,000 | $73 | 34 |
Match score weights: distance 35% · size 25% · config 20% · recency 20%. Top-matched comps best support the ARV.
Projected returns pro-forma
-3.0% appreciation · 0.0% rent growth · sell at horizon
- IRR
- -18.8%
- Equity multiple
- 0.36×
- Total profit
- $-50,016
- Equity at exit
- $41,486
- IRR
- -19.0%
- Equity multiple
- 0.12×
- Total profit
- $-68,524
- Equity at exit
- $24,057
Cash invested: $77,907 (down + closing). Projections, not guarantees.
Landlord ↔ Tenant lean methodology
- Overall (STATE)
- 87 Strongly Landlord-Friendly
- State Texas
- 87 Strongly Landlord-Friendly · R+5
- County
- — inherits STATE
- City
- — inherits STATE
ZIP-level market 77318
- Home prices YoY
- -32.7%
- Rents YoY
- -2.1%
- Active inventory
- 1199
- Price-to-rent
- 8.4×
Monthly cashflow live
- Estimated rent
- $2,480 medium interval (Pro) →
- Mortgage (P&I)
- −$1,459
- Tax est. 1.5%
- −$348 /mo · $4,174/yr
- Insurance
- −$116
- HOA
- −$0
- Vacancy / Maint / Mgmt
- −$521
- Net cashflow
- $36
Break-even live
Sensitivity live
| Price | -10% $228 | -5% $132 | +0% $36 | +5% $-60 | +10% $-156 |
|---|---|---|---|---|---|
| Rent | -10% $-160 | -5% $-62 | +0% $36 | +5% $134 | +10% $232 |
| Rate | -1.0pp $176 | -0.5pp $107 | base $36 | +0.5pp $-36 | +1.0pp $-109 |
UW: 25.0% down · 7.5% · 30yr · 1.5% tax · 5.0% vac · 8.0% maint · 8.0% mgmt
Financing live
Cash to close
- Down payment
- $69,559
- Closing costs
- $8,347
- Reserves months
- —
- Total cash needed
- —
Loan-product check · same deal, 3 products live
Conventional
25% down · 7.5% · 30yr
- Down + closing
- —
- Monthly P&I
- —
- Monthly cashflow
- —
- DSCR
- —
- Eligible?
- —
Personal DTI + credit; lowest rate.
DSCR
20% down · 8.5% · 30yr
- Down + closing
- —
- Monthly P&I
- —
- Monthly cashflow
- —
- DSCR
- —
- Eligible?
- —
No personal income docs; deal must DSCR.
Hard money
10% down · 12.0% · 12mo
- Down + closing
- —
- Monthly P&I
- —
- Monthly cashflow
- —
- DSCR
- —
- Eligible?
- —
Short-term bridge; refi at stabilization.
Rent comps 1 comps
| Address | Beds | Baths | Sqft | Rent | $/sqft | DOM | Units | Dist |
|---|---|---|---|---|---|---|---|---|
| 347 Skyline Ridge Dr Willis, TX | 3.0 | 3.0 | 3000 | $3,100 | $1.03 | 45d | 1 | 1.50mi |
Listing history 17 events
-
2026-06-21days on market $248,990 Active 23 DOM
-
2026-06-18days on market $248,990 Active 20 DOM
-
2026-06-17days on market $248,990 Active 19 DOM
-
2026-06-16days on market $248,990 Active 18 DOM
-
2026-06-15days on market $248,990 Active 17 DOM
-
2026-06-13days on market $248,990 Active 15 DOM
-
2026-06-09days on market $248,990 Active 11 DOM
-
2026-06-08days on market $248,990 Active 10 DOM
-
2026-06-07days on market $248,990 Active 9 DOM
-
2026-06-04days on market $248,990 Active 6 DOM
-
2026-06-03days on market $248,990 Active 5 DOM
-
2026-06-02days on market $248,990 Active 4 DOM
-
2026-06-01days on market $248,990 Active 3 DOM
-
2026-05-31days on market $248,990 Active 2 DOM
-
2026-05-14price $248,990 457-char remark
-
2026-05-04price $263,990 457-char remark
-
2026-03-09$260,990 Active 457-char remark
ⓘ Source: listings_history table (triggers on properties + properties_extension) + one-shot
backfill from property_details.listing_events for pre-trigger history.
Climate risk First Street
- Flood 1/10 Low FEMA zone X (unshaded) · 0% chance over 30 yrs
- Wildfire 5/10 Major
- Heat 8/10 Severe 7 d/yr ≥111°F today · 23 d/yr by 30 yrs out
- Wind 8/10 Severe 99% chance of damaging wind over 30 yrs
- Air quality 2/10 Low 1 unhealthy d/yr today · 1 by 30 yrs out
Nearby sold comps map
Loading sold comps map…
Walkable amenities ~0.75 mi
Loading nearby amenities…
Taxation est. · year 1
- Rental income
- $29,756
- − Mortgage interest
- −$15,586
- − Property taxes
- −$4,174
- − Insurance
- −$1,391
- − Repairs & maintenance
- −$2,380
- − Management
- −$2,380
- − Depreciation
- −$8,094
- Taxable loss
- −$4,249
- Est. tax savings @ 24.0%
- +$1,020
- After-tax cash flow
- $1,453/yr
For passive investors: Depreciation is non-cash, so a rental often shows a tax loss while cash-flowing — sheltering income. Rental losses are passive: they offset passive income freely, and up to $25,000/yr can offset ordinary (W-2) income if you actively participate and your MAGI is under $100k (phasing out to $0 by $150k); unused losses carry forward. On sale, claimed depreciation is recaptured at up to 25%, and gains may owe capital-gains tax (a 1031 exchange can defer both). Figures are a year-1 estimate at your 24.0% rate — not tax advice; consult a CPA.
Condition & rehab AI · 12 photos
The Sparrow II is a well-maintained single-family home with good curb appeal and interior condition. It offers a good return on investment with minor updates that can significantly enhance its resale and rental value.
Value-add opportunities
- Both Painting exterior and interior walls — Fresh paint enhances curb appeal and interior aesthetics.
- Both Landscaping improvements — Enhances curb appeal and adds value to the property.
- Both New flooring in high-traffic areas — Fresh flooring improves aesthetics and reduces wear and tear.
- Both New kitchen appliances — Modern appliances add value and functionality to the kitchen.
- Both New bathroom fixtures — Modern fixtures enhance the bathrooms and add value to the property.
Renovation cost estimate screening
Value-add ROI direction
- Both Painting exterior and interior walls — Fresh paint enhances curb appeal and interior aesthetics. ↑
- Both Landscaping improvements — Enhances curb appeal and adds value to the property. ↑
- Both New flooring in high-traffic areas — Fresh flooring improves aesthetics and reduces wear and tear. ↑
- Both New kitchen appliances — Modern appliances add value and functionality to the kitchen. ↑
- Both New bathroom fixtures — Modern fixtures enhance the bathrooms and add value to the property. ↑
ⓘ Cost ranges are severity-bucket heuristics (US national rule-of-thumb). Get contractor quotes + a written scope before underwriting a rehab budget.
Schools (NCES district)
- District
- Willis ISD
- NCES district ID
- 4845900
- Math proficiency
- 33% ▼ -15.00%
- Reading proficiency
- 40% ▼ -2.00%
- Median HH income
- $57,828
- Composite
- 32.32/100
- National rank
- #5746
- State rank
- #458 of 826 in TX
Livability — Willis
- Score
- 62/100
- State rank
- #933
- US rank
- #16579
Category grades
Schools grade is shown separately in the Schools card above.
Census & demographics
- Census place
- Willis, TX
- County
- Montgomery County · 663,713 people
- City population
- 38,421
- Metro
- Houston-The Woodlands-Sugar Land, TX
- Population (ZIP)
- 20,792
- Household income
- $92,415
- Rent vs Own
- Severe rent burden
- 279.0
Population outlook (Montgomery County) Hauer SSP2
- Today (2025)
- 713,896 people
- By 2030
- 805,263 · +12.8%
- By 2040
- 992,708 · +39.1%
- By 2050
- 1,179,590 · +65.2%
- By 2075
- 1,628,084 · +128.1%
- By 2100
- 1,937,880 · +171.5%
Race, ethnicity, and origin ACS 2023
- Neighborhood character
- Predominantly White (72%)
- Race & ethnicity
- White 72% Hispanic / Latino 17% Two or more races 14% Black 3%
- Hispanic origin (detail)
- Mexican 12%
- Common ancestry
- Lithuanian 4% Slovak 2% Serbian 2%
- Foreign-born
- 6% · Canada, Jamaica
- Languages at home
- 88% English-only · Spanish 10%
Political lean MEDSL · Montgomery
- 2024 margin
- Solid R (+45.5) · D 26.8% · R 72.3%
- 2008→2024 swing
- +7.2pp toward D · 2008: -52.7pp · 2024: -45.5pp
- All cycles
- 2024: R+45.5 2020: R+43.8 2016: R+51.4 2012: R+60.7 2008: R+52.7
Not yet ingested
- Civics
- —
Market trends
- HPI YoY
- ▼ -114.58%
- Current HPI
- 236.256
- Rent YoY
- ▼ -2.09%
- Metro
- Houston-The Woodlands-Sugar Land, TX
- State GDP YoY
- ▲ 3.95%
- F500 in state
- 110
Industry mix (Fortune 500 HQ in TX)
| Industry | F500 HQs | Revenue |
|---|---|---|
| Energy | 16 | $1,198B |
|
||
| Technology | 5 | $198B |
|
||
| Engineering / Construction | 4 | $72B |
|
||
| Energy Services | 3 | $60B |
|
||
| Utilities | 3 | $41B |
|
||
| Healthcare | 2 | $330B |
|
||
Cash-flow waterfall
monthlySold comps — $/sqft
last 12 mo · ≤1 miLoading sold comps…