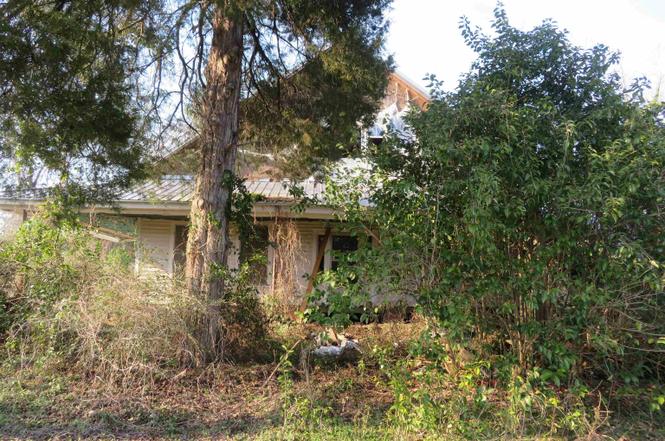
1350 4 Holes Rd · Cameron, SC
Flood risk 6/10 · Moderate
- FEMA flood zone
- AE
- Chance of flooding over 30 yrs
- 0.7%
- Est. flood insurance / yr
- $1,737 – $8,500
Fire risk 4/10 · Minor
- Est. fire insurance / yr
- $783 – $1,453
Heat risk 6/10 · Moderate
- Hot days now (above 108°F)
- 7 days/yr
- Hot days in 30 yrs
- 15 days/yr
Wind risk 8/10 · Major
- Chance of severe wind over 30 yrs
- 80.0%
Air-quality risk 3/10 · Minor
- Unhealthy air days now
- 3 days/yr
- Unhealthy air days in 30 yrs
- 3 days/yr
Risk factors via First Street. Map © Google.
Why this score? — see what drove the B grade
The composite is a weighted blend of 9 inputs, each scored 0–100. Each bar is that input's sub-score; the figure is the points it added to the 100-point composite (weight × sub-score).
- Cash flow +30.0/30.0
- 1% rule +10.0/10.0
- DSCR +10.0/10.0
- ARV discount +7.5/15.0
- Schools +5.0/10.0
- Livability +3.3/5.0
- Rent growth +2.5/5.0
- Condition / age +2.5/5.0
- Appreciation +0.0/10.0
$85,000
🖨 Deal sheet (PDF) 📄 Offer letter ✓ Due diligence
Listing remarks
INVESTORS INVESTORS INVESTORS! Investor Special in Orangeburg! This 3320 sq ft ranch-style home sits on a full 1-acre lot and is already framed for a 5-bedroom, 2.5-bath layout saving you time and getting you straight to the value-add stage. Major structural framing is complete, allowing you to focus on finishing and maximizing returns. With an estimated ARV of $350,000 - $400,000, this project presents a clear opportunity for strong profit margins whether you're flipping, holding as a high-capacity rental, or adding to your investment portfolio. The expansive lot provides additional upside potential for outdoor upgrades, added features, or future enhancements to increase resale value. Bein
Key facts
- Expansive lot
- Full 1-acre lot
- 1 acre lot
Tags
Property features AI
Finance
- Other: Approximately 1 acre lot; Paved road access
Exterior
- Utilities: Public water; Public sewer
- Home design: Two-story home; Facing/entry level: Main
- Construction: Crawlspace foundation
- Exterior features: Covered front porch; Wood exterior finish
Interior
- Kitchen: Kitchen on main level with hardwood floor
- Bedrooms: Main-level master bedroom with private bath; Additional bedrooms with hardwood floors
- Flooring: Hardwood floors in living spaces and bedrooms
- Bathrooms: Two full bathrooms; One partial bathroom; One half bathroom on main level
- Interior features: Attic access; Unfinished lower level
Neighborhood map
What this means for you Summary
Snapshot
- This is a 5-bed/2.5-bath single-family listed at $85k.
Deal economics
- At list price, monthly cash flow is $103 ($1k/yr) — positive.
- The deal already cash-flows at list — no discount required.
- Meets the 1% rule at list price ($1k rent vs $85k).
- Recommended offer: $77k (9.0% below list) — sets the bar for market timing.
Location & tenants
- Location reads 66/100 on livability (#125 in SC) — a middle-class / working-renter tenant base. Strengths: cost of living A+, housing A+; Watch: crime C-, amenities F, commute F.
- Zoned schools: Whittaker Elementary (math 24%, 415 students, 100% FRL); Orangeburg Wilkinson High (math 22%, 1,073 students, 100% FRL).
- Market conditions: 226 active listings in the ZIP; 87 units permitted in Orangeburg County in 2024 (0 in 5+ unit buildings).
Forward outlook
- Local home prices are declining (-3.0%/yr); year-one equity from $588 of loan paydown is wiped out by about $3k of value loss. Plan a longer hold.
- Orangeburg County population projected at -27% by 2050 — secular population decline; favor cash flow + early exit over multi-decade hold.
Negotiation context
- It's been on market 105 days — a 9% lower offer ($77k) is reasonable based on typical stale-listing flexibility.
- 8 sale attempts since 5y ago; this cycle's ask has dropped $20k (19%) from the opening price — seller is motivated, your offer sets the floor, not the list.
- Current owner paid $36k; list at $85k implies a 136% gain — meaningful room to come down on a strong offer.
Risks & watch-outs
- Watch-outs: flood insurance adds $427/mo; built in 1914 — expect roof / HVAC / electrical / plumbing capex.
- Climate carrying-cost: in FEMA flood zone AE (mandatory federal flood insurance); severe wind risk, 80% chance of damaging wind over 30y; extreme-heat days projected 7→15/yr by 2055 (HVAC capex compounding) — expect insurance premiums to compound above CPI over the hold.
Questions for the listing agent
- It's been on market 105 days. Have you received any prior offers? Is the seller open to a 9% concession, seller financing, or rate buy-down credit?
- Built in 1914 — when were the roof, HVAC, electrical panel, plumbing, and water heater last replaced?
- What's the actual annual flood-insurance premium (NFIP or private), and is the property in a SFHA with mandatory coverage?
- Why hasn't it sold? Are there any deal-killer items the seller is aware of (foundation, flood, title, zoning, code violations)?
- Is there a deadline driving the sale (1031 exchange, divorce, estate, relocation)? That informs how much negotiation room exists.
- Schools are F-rated, which usually means shorter tenancies and higher turnover. Who's the typical renter profile here, and what's been the actual vacancy rate?
- What's the average days-on-market for RENTAL listings here right now (not sales)? A rising rental-DOM trend means longer vacancies and softer asking-rent achievability than the comps imply.
- What's the recent tenant-quality profile in this submarket — average credit score on applications, eviction rate, late-payment / NSF rate, and stable-employment percentage? A property-management company in the area should have these aggregated.
- How much new for-sale + rental construction is in the pipeline within 1–3 miles? Heavy new supply typically softens prices + rents 12–24 months out; constrained supply supports both.
Investment metrics
- 1% rule
- 1.66% ✓
- Cap rate
- 13.77%
- Cash-on-cash
- 26.69%
- DSCR
- 2.19
- GRM
- 5.0
CMA / ARV
No comps found within radius.
Projected returns pro-forma
-3.0% appreciation · 3.0% rent growth · sell at horizon
- IRR
- -7.9%
- Equity multiple
- 0.71×
- Total profit
- $-6,937
- Equity at exit
- $12,674
- IRR
- 2.1%
- Equity multiple
- 1.15×
- Total profit
- $3,550
- Equity at exit
- $7,349
Cash invested: $23,800 (down + closing). Projections, not guarantees.
Landlord ↔ Tenant lean methodology
- Overall (STATE)
- 90 Strongly Landlord-Friendly
- State South Carolina
- 90 Strongly Landlord-Friendly · R+6
- County
- — inherits STATE
- City
- — inherits STATE
ZIP-level market 29115
- Home prices YoY
- -27.3%
- Active inventory
- 226
- Price-to-rent
- 5.0×
Monthly cashflow live
- Estimated rent
- $1,414 medium interval (Pro) →
- Mortgage (P&I)
- −$446
- Tax est. 1.5%
- −$106 /mo · $1,275/yr
- Insurance
- −$35
- Flood insurance flood zone
- −$427 /mo · $5,118/yr
- HOA
- −$0
- Vacancy / Maint / Mgmt
- −$297
- Net cashflow
- $103
Break-even live
Sensitivity live
| Price | -10% $162 | -5% $132 | +0% $103 | +5% $74 | +10% $44 |
|---|---|---|---|---|---|
| Rent | -10% $-9 | -5% $47 | +0% $103 | +5% $159 | +10% $215 |
| Rate | -1.0pp $146 | -0.5pp $125 | base $103 | +0.5pp $81 | +1.0pp $58 |
UW: 25.0% down · 7.5% · 30yr · 1.5% tax · 5.0% vac · 8.0% maint · 8.0% mgmt
Financing live
Cash to close
- Down payment
- $21,250
- Closing costs
- $2,550
- Reserves months
- —
- Total cash needed
- —
Loan-product check · same deal, 3 products live
Conventional
25% down · 7.5% · 30yr
- Down + closing
- —
- Monthly P&I
- —
- Monthly cashflow
- —
- DSCR
- —
- Eligible?
- —
Personal DTI + credit; lowest rate.
DSCR
20% down · 8.5% · 30yr
- Down + closing
- —
- Monthly P&I
- —
- Monthly cashflow
- —
- DSCR
- —
- Eligible?
- —
No personal income docs; deal must DSCR.
Hard money
10% down · 12.0% · 12mo
- Down + closing
- —
- Monthly P&I
- —
- Monthly cashflow
- —
- DSCR
- —
- Eligible?
- —
Short-term bridge; refi at stabilization.
Listing history 35 events
-
2026-06-19days on market $85,000 Active 105 DOM
-
2026-06-18days on market $85,000 Active 104 DOM
-
2026-06-17days on market $85,000 Active 103 DOM
-
2026-06-16days on market $85,000 Active 102 DOM
-
2026-06-15days on market $85,000 Active 101 DOM
-
2026-06-14days on market $85,000 Active 99 DOM
-
2026-06-12days on market $85,000 Active 98 DOM
-
2026-06-09days on market $85,000 Active 95 DOM
-
2026-06-08days on market $85,000 Active 94 DOM
-
2026-06-07days on market $85,000 Active 93 DOM
-
2026-06-07days on market $85,000 Active 92 DOM
-
2026-06-04days on market $85,000 Active 89 DOM
-
2026-06-02days on market $85,000 Active 88 DOM
-
2026-06-01days on market $85,000 Active 87 DOM
-
2026-05-31days on market $85,000 Active 86 DOM
-
2026-05-31days on market $85,000 Active 85 DOM
-
2026-03-07price $85,000
-
2026-03-06$105,000 Active
-
2024-10-01historical
-
2024-03-12status Active
-
2024-02-18historical
-
2023-08-22status Active
-
2023-08-16historical
-
2023-07-14status Active
-
2023-06-29status Pending
-
2023-03-15$99,000 Active
-
2022-08-04historical
-
2022-07-12$50,000 Active
-
2021-12-19historical
-
2021-10-28status Active
-
2021-09-30status Pending
-
2021-08-25price $87,500
-
2021-08-24price $87,500
-
2021-08-24$75,000 Active
-
2017-09-14soldstatus $36,000 Closed
ⓘ Source: listings_history table (triggers on properties + properties_extension) + one-shot
backfill from property_details.listing_events for pre-trigger history.
Climate risk First Street
- Flood 6/10 Major FEMA zone AE · 70% chance over 30 yrs
- Wildfire 4/10 Moderate
- Heat 6/10 Major 7 d/yr ≥108°F today · 15 d/yr by 30 yrs out
- Wind 8/10 Severe 80% chance of damaging wind over 30 yrs
- Air quality 3/10 Moderate 3 unhealthy d/yr today · 3 by 30 yrs out
Nearby sold comps map
Loading sold comps map…
Walkable amenities ~0.75 mi
Loading nearby amenities…
Taxation est. · year 1
- Rental income
- $16,965
- − Mortgage interest
- −$4,761
- − Property taxes
- −$1,275
- − Insurance
- −$5,544
- − Repairs & maintenance
- −$1,357
- − Management
- −$1,357
- − Depreciation
- −$2,473
- Taxable income
- $198
- Est. tax owed @ 24.0%
- −$48
- After-tax cash flow
- $1,187/yr
For passive investors: Depreciation is non-cash, so a rental often shows a tax loss while cash-flowing — sheltering income. Rental losses are passive: they offset passive income freely, and up to $25,000/yr can offset ordinary (W-2) income if you actively participate and your MAGI is under $100k (phasing out to $0 by $150k); unused losses carry forward. On sale, claimed depreciation is recaptured at up to 25%, and gains may owe capital-gains tax (a 1031 exchange can defer both). Figures are a year-1 estimate at your 24.0% rate — not tax advice; consult a CPA.
Schools (NCES district)
No district data.
Livability — Cameron
- Score
- 66/100
- State rank
- #125
- US rank
- #12359
Category grades
Schools grade is shown separately in the Schools card above.
Census & demographics
- Population (ZIP)
- 27,179
Population outlook (Orangeburg County) Hauer SSP2
- Today (2025)
- 82,698 people
- By 2030
- 78,615 · -4.9%
- By 2040
- 69,308 · -16.2%
- By 2050
- 60,629 · -26.7%
- By 2075
- 42,678 · -48.4%
- By 2100
- 28,136 · -66.0%
Race, ethnicity, and origin ACS 2023
- Neighborhood character
- Predominantly Black (76%)
- Race & ethnicity
- Black 76% White 20% Hispanic / Latino 2% Two or more races 2%
- Foreign-born
- 2% · Canada
- Languages at home
- 97% English-only · Spanish 2%
Political lean MEDSL · Orangeburg
- 2024 margin
- Strong D (+24.6) · D 61.8% · R 37.2% · Other 1.1%
- 2008→2024 swing
- -13.5pp toward R · 2008: 38.1pp · 2024: 24.6pp
- All cycles
- 2024: D+24.6 2020: D+33.2 2016: D+37.0 2012: D+43.5 2008: D+38.1
Not yet ingested
- Civics
- —
Market trends
- HPI YoY
- ▼ -56.65%
- Current HPI
- 150.823
- Rent YoY
- —
- Metro
- —
- State GDP YoY
- ▲ 4.51%
- F500 in state
- 2
Industry mix (Fortune 500 HQ in SC)
| Industry | F500 HQs | Revenue |
|---|---|---|
| Packaging | 1 | $7B |
|
||
Price history
+136.1% since first listed19 events — show timeline
- 2026-03-07 Price Changed $85,000 Consolidated MLS
- 2026-03-06 Listed $105,000 Consolidated MLS
- 2024-10-01 Listing Removed — Charleston Trident MLS
- 2024-03-12 Relisted — Charleston Trident MLS
- 2024-02-18 Listing Removed — Charleston Trident MLS
- 2023-08-22 Relisted — Charleston Trident MLS
- 2023-08-16 Listing Removed — Charleston Trident MLS
- 2023-07-14 Relisted — Charleston Trident MLS
- 2023-06-29 Pending — Charleston Trident MLS
- 2023-03-15 Listed $99,000 Charleston Trident MLS
- 2022-08-04 Delisted — Consolidated MLS
- 2022-07-12 Listed $50,000 Consolidated MLS
- 2021-12-19 Listing Removed — Charleston Trident MLS
- 2021-10-28 Relisted — Charleston Trident MLS
- 2021-09-30 Pending — Charleston Trident MLS
- 2021-08-25 Price Changed $87,500 Consolidated MLS
- 2021-08-24 Price Changed $87,500 Charleston Trident MLS
- 2021-08-24 Listed $75,000 Charleston Trident MLS
- 2017-09-14 Sold (MLS) $36,000 Charleston Trident MLS
Cash-flow waterfall
monthlySold comps — $/sqft
last 12 mo · ≤1 miLoading sold comps…