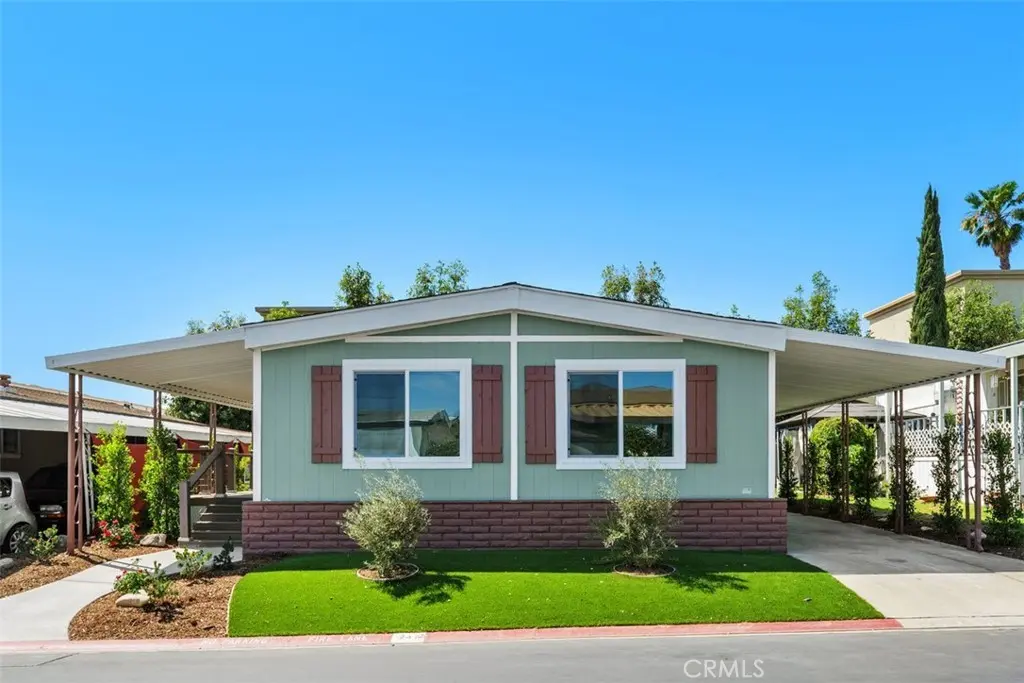
1456 E Philadelphia St Spc 247 · Ontario, CA
Flood risk 4/10 · Minor
- FEMA flood zone
- X
- Chance of flooding over 30 yrs
- 0.2%
- Est. flood insurance / yr
- $507 – $1,088
Fire risk 1/10 · Minimal
- Est. fire insurance / yr
- $659 – $1,223
Heat risk 8/10 · Major
- Hot days now (above 100°F)
- 7 days/yr
- Hot days in 30 yrs
- 19 days/yr
Wind risk 1/10 · Minimal
- Chance of severe wind over 30 yrs
- —
Air-quality risk 9/10 · Severe
- Unhealthy air days now
- 23 days/yr
- Unhealthy air days in 30 yrs
- 26 days/yr
Risk factors via First Street. Map © Google.
Why this score? — see what drove the B- grade
The composite is a weighted blend of 9 inputs, each scored 0–100. Each bar is that input's sub-score; the figure is the points it added to the 100-point composite (weight × sub-score).
- Cash flow +29.9/30.0
- DSCR +10.0/10.0
- 1% rule +8.4/10.0
- ARV discount +7.5/15.0
- Schools +3.7/10.0
- Livability +3.2/5.0
- Rent growth +3.1/5.0
- Condition / age +2.5/5.0
- Appreciation +0.0/10.0
$219,999
🖨 Deal sheet (PDF) 📄 Offer letter ✓ Due diligence
Listing remarks
Beautiful 2-bedroom 2 bath mobile home located in the exclusive Rancho Ontario. This home is a turnkey completed remodeled, it offers an open concept kitchen with an island, step-in bathrooms, ceiling fans new hardscape beautiful open porch. Renovated amenities await you offering a heated pool and spa opened year-round, a hall to host any event, our clubhouse offers a billiards room, card table room, a fitness room as well as a gym or lounge area to just sit and relax. The Park also offers an active area with two pickleball courts, bocce ball and we didn't forget about your fur babies, two dog parks. Don't miss out on touring and calling it home.
Key facts
- Dog parks
- Open concept kitchen
- Pickleball courts
Tags
Property features AI
Finance
- Other: Manager approval required for sale/rental
- Financial info: Land lease of $1,800 per month (park source)
- HOA & community: Senior community; Amenities include pool, spa, clubhouse, banquet facilities, card room, billiard room, gym/exercise room, bocce ball court, pickleball, dog park, barbecue area
Exterior
- Parking: Carport with space for 3 vehicles; Park name: Rancho Ontario; RV parking available for a fee
- Utilities: Public sewer; District/public water
- Home design: Single-story manufactured home (model: Canyon Crest); Mobile home size approximately 24 ft by 48 ft; Mobile home remains on site; Facing/entry from Philadelphia St
- Construction: Single-story structure; Year built per public records
- Exterior features: Community heated in-ground gunite pool; Community spa; No fencing; Site zoned approximately 6–10 units per acre
Interior
- Bathrooms: 2 full bathrooms
- Interior features: One-level floor plan; Entry on Philadelphia St; In-ground, heated gunite spa in the community
- Laundry & utility: Washer hookup; Gas and electric dryer hookups; Community laundry available
Neighborhood map
What this means for you Summary
Snapshot
- This is a 2-bed/2.0-bath manufactured listed at $220k.
Deal economics
- At list price, monthly cash flow is $817 ($10k/yr) — positive.
- The deal already cash-flows at list — no discount required.
- Meets the 1% rule at list price ($3k rent vs $220k).
- Recommended offer: $200k (9.0% below list) — sets the bar for market timing.
- Cap rate 10.7% vs local median 2.7% in Ontario — top-decile yield for the area; either an underpriced asset or a hidden risk that comps aren't pricing in. Stress-test before assuming the spread holds.
Location & tenants
- Location reads 63/100 on livability (#435 in CA) — a middle-class / working-renter tenant base. Strengths: commute A-, housing B+; Watch: cost of living F, health & safety F.
- Ontario-Montclair (urban): math 35% / reading 44% proficiency, ranked #731 of 1,400 in CA (top 52%) — families likely to look elsewhere, expect single-tenant / working-renter base with shorter leases; 75% free/reduced lunch — lower-income household profile, screen leases tightly.
- Zoned schools: Bon View Elementary (620 students, 84% FRL); De Anza Middle (530 students, 82% FRL); Colony High (math 42% / reading 67%, grade C-, #256 of 1,170 statewide, top 24%, 2,122 students, 71% FRL) — zoned schools at 79% FRL track the district average.
- Zoned-school proficiency averages 54% at this address vs 40% district-wide (+15 pts) — the actual schools serving this property are materially stronger than the Ontario-Montclair average implies; a family-tenant draw the district grade alone would hide.
- Market conditions: Rents rising (+2.4%/yr); 321 active listings in the ZIP; solid renter incomes; 5,458 units permitted in San Bernardino County in 2024 (1,500 in 5+ unit buildings).
- This rent runs 35% of the median local income ($101k/yr) — at the standard rent-burdened threshold; future hikes will face affordability resistance.
Forward outlook
- Local home prices are declining (-3.0%/yr); year-one equity from $2k of loan paydown is wiped out by about $7k of value loss. Plan a longer hold.
- San Bernardino County population projected at +15% by 2050 — modest demand growth; plan on rents tracking national, not racing it.
- At projected returns (-3.0% appreciation + 2.4% rent growth), your $62k cash investment doubles in ~8 years — after that, you're playing with house money.
Negotiation context
- It's been on market 97 days — a 9% lower offer ($200k) is reasonable based on typical stale-listing flexibility.
Risks & watch-outs
- Climate carrying-cost: extreme-heat days projected 7→19/yr by 2055 (HVAC capex compounding) — expect insurance premiums to compound above CPI over the hold.
Questions for the listing agent
- It's been on market 97 days. Have you received any prior offers? Is the seller open to a 9% concession, seller financing, or rate buy-down credit?
- Why hasn't it sold? Are there any deal-killer items the seller is aware of (foundation, flood, title, zoning, code violations)?
- Is there a deadline driving the sale (1031 exchange, divorce, estate, relocation)? That informs how much negotiation room exists.
- Schools are F-rated, which usually means shorter tenancies and higher turnover. Who's the typical renter profile here, and what's been the actual vacancy rate?
- What's the average days-on-market for RENTAL listings here right now (not sales)? A rising rental-DOM trend means longer vacancies and softer asking-rent achievability than the comps imply.
- What's the recent tenant-quality profile in this submarket — average credit score on applications, eviction rate, late-payment / NSF rate, and stable-employment percentage? A property-management company in the area should have these aggregated.
- How much new for-sale + rental construction is in the pipeline within 1–3 miles? Heavy new supply typically softens prices + rents 12–24 months out; constrained supply supports both.
Investment metrics
- 1% rule
- 1.34% ✓
- Cap rate
- 10.75%
- Cash-on-cash
- 15.91%
- DSCR
- 1.71
- GRM
- 6.2
CMA / ARV
No comps found within radius.
Projected returns pro-forma
-3.0% appreciation · 2.39% rent growth · sell at horizon
- IRR
- 6.1%
- Equity multiple
- 1.24×
- Total profit
- $14,614
- Equity at exit
- $32,803
- IRR
- 15.0%
- Equity multiple
- 2.18×
- Total profit
- $72,579
- Equity at exit
- $19,021
Cash invested: $61,600 (down + closing). Projections, not guarantees.
Landlord ↔ Tenant lean methodology
- Overall (STATE)
- 18 Strongly Tenant-Friendly
- State California
- 18 Strongly Tenant-Friendly · D+13
- County
- — inherits STATE
- City
- — inherits STATE
ZIP-level market 91761
- Rents YoY
- 2.4%
- Active inventory
- 321
- Price-to-rent
- 6.2×
Monthly cashflow live
- Estimated rent
- $2,958 medium interval (Pro) →
- Mortgage (P&I)
- −$1,154
- Tax est. 1.5%
- −$275 /mo · $3,300/yr
- Insurance
- −$92
- HOA
- −$0
- Vacancy / Maint / Mgmt
- −$621
- Net cashflow
- $817
Break-even live
Sensitivity live
| Price | -10% $969 | -5% $893 | +0% $817 | +5% $741 | +10% $665 |
|---|---|---|---|---|---|
| Rent | -10% $583 | -5% $700 | +0% $817 | +5% $934 | +10% $1,051 |
| Rate | -1.0pp $928 | -0.5pp $873 | base $817 | +0.5pp $760 | +1.0pp $702 |
UW: 25.0% down · 7.5% · 30yr · 1.5% tax · 5.0% vac · 8.0% maint · 8.0% mgmt
Financing live
Cash to close
- Down payment
- $55,000
- Closing costs
- $6,600
- Reserves months
- —
- Total cash needed
- —
Loan-product check · same deal, 3 products live
Conventional
25% down · 7.5% · 30yr
- Down + closing
- —
- Monthly P&I
- —
- Monthly cashflow
- —
- DSCR
- —
- Eligible?
- —
Personal DTI + credit; lowest rate.
DSCR
20% down · 8.5% · 30yr
- Down + closing
- —
- Monthly P&I
- —
- Monthly cashflow
- —
- DSCR
- —
- Eligible?
- —
No personal income docs; deal must DSCR.
Hard money
10% down · 12.0% · 12mo
- Down + closing
- —
- Monthly P&I
- —
- Monthly cashflow
- —
- DSCR
- —
- Eligible?
- —
Short-term bridge; refi at stabilization.
Listing history 18 events
-
2026-06-21days on market $219,999 Active 97 DOM
-
2026-06-18days on market $219,999 Active 94 DOM
-
2026-06-17days on market $219,999 Active 93 DOM
-
2026-06-16days on market $219,999 Active 92 DOM
-
2026-06-15days on market $219,999 Active 91 DOM
-
2026-06-13days on market $219,999 Active 89 DOM
-
2026-06-13days on market $219,999 Active 88 DOM
-
2026-06-09days on market $219,999 Active 85 DOM
-
2026-06-08days on market $219,999 Active 84 DOM
-
2026-06-07days on market $219,999 Active 83 DOM
-
2026-06-04pricedays on market $219,999 Active 80 DOM
-
2026-06-03days on market $229,999 Active 79 DOM
-
2026-06-02days on market $229,999 Active 78 DOM
-
2026-06-01days on market $229,999 Active 77 DOM
-
2026-05-31days on market $229,999 Active 76 DOM
-
2026-04-25price $229,999
-
2026-04-22price $235,999
-
2026-03-16$238,999 Active
ⓘ Source: listings_history table (triggers on properties + properties_extension) + one-shot
backfill from property_details.listing_events for pre-trigger history.
Climate risk First Street
- Flood 4/10 Moderate FEMA zone X · 20% chance over 30 yrs
- Wildfire 1/10 Low
- Heat 8/10 Severe 7 d/yr ≥100°F today · 19 d/yr by 30 yrs out
- Wind 1/10 Low
- Air quality 9/10 Extreme 23 unhealthy d/yr today · 26 by 30 yrs out
Nearby sold comps map
Loading sold comps map…
Walkable amenities ~0.75 mi
Loading nearby amenities…
Taxation est. · year 1
- Rental income
- $35,501
- − Mortgage interest
- −$12,323
- − Property taxes
- −$3,300
- − Insurance
- −$1,100
- − Repairs & maintenance
- −$2,840
- − Management
- −$2,840
- − Depreciation
- −$6,400
- Taxable income
- $6,698
- Est. tax owed @ 24.0%
- −$1,607
- After-tax cash flow
- $8,194/yr
For passive investors: Depreciation is non-cash, so a rental often shows a tax loss while cash-flowing — sheltering income. Rental losses are passive: they offset passive income freely, and up to $25,000/yr can offset ordinary (W-2) income if you actively participate and your MAGI is under $100k (phasing out to $0 by $150k); unused losses carry forward. On sale, claimed depreciation is recaptured at up to 25%, and gains may owe capital-gains tax (a 1031 exchange can defer both). Figures are a year-1 estimate at your 24.0% rate — not tax advice; consult a CPA.
Schools (NCES district)
- District
- Ontario-Montclair
- NCES district ID
- 0628470
- Math proficiency
- 35% ▲ 4.00%
- Reading proficiency
- 44% ▲ 2.00%
- Median HH income
- $50,668
- Composite
- 36.57/100
- National rank
- #9282
- State rank
- #731 of 1400 in CA
Livability — Ontario
- Score
- 63/100
- State rank
- #435
- US rank
- #14949
Category grades
Schools grade is shown separately in the Schools card above.
Census & demographics
- Census place
- Ontario, CA
- County
- San Bernardino County · 2,030,291 people
- City population
- 183,440
- Metro
- Riverside-San Bernardino-Ontario, CA
- Population (ZIP)
- 62,935
- Household income
- $100,578
- Rent vs Own
- Severe rent burden
- 1853.0
Population outlook (San Bernardino County) Hauer SSP2
- Today (2025)
- 2,300,329 people
- By 2030
- 2,378,907 · +3.4%
- By 2040
- 2,523,137 · +9.7%
- By 2050
- 2,642,388 · +14.9%
- By 2075
- 2,880,769 · +25.2%
- By 2100
- 2,909,436 · +26.5%
Race, ethnicity, and origin ACS 2023
- Neighborhood character
- Predominantly Hispanic (66%)
- Race & ethnicity
- Hispanic / Latino 66% Two or more races 23% White 15% Asian 9% Black 6% Native American 2%
- Hispanic origin (detail)
- Mexican 59%
- Common ancestry
- Iranian 1% Lithuanian 1% Italian 1%
- Foreign-born
- 24% · Canada, China, Vietnam
- Languages at home
- 51% English-only · Spanish 41% Chinese 3% Tagalog/Filipino 1%
Political lean MEDSL · San Bernardino
- 2024 margin
- Toss-up / Even · D 47.5% · R 49.7% · Other 2.8%
- 2008→2024 swing
- -8.5pp toward R · 2008: 6.3pp · 2024: -2.1pp
- All cycles
- 2024: R+2.1 2020: D+10.7 2016: D+9.8 2012: D+5.4 2008: D+6.3
Not yet ingested
- Civics
- —
Market trends
- HPI YoY
- ▼ -374.91%
- Current HPI
- 400.5674
- Rent YoY
- ▲ 2.39%
- Metro
- Riverside-San Bernardino-Ontario, CA
- State GDP YoY
- ▲ 3.21%
- F500 in state
- 116
Industry mix (Fortune 500 HQ in CA)
| Industry | F500 HQs | Revenue |
|---|---|---|
| Technology | 27 | $1,492B |
|
||
| Financial Services | 3 | $174B |
|
||
| Retail | 3 | $44B |
|
||
| Insurance | 3 | $26B |
|
||
| Media / Entertainment | 2 | $115B |
|
||
| Pharmaceuticals / Biotech | 2 | $62B |
|
||
Price history
-3.8% since first listed3 events — show timeline
- 2026-04-25 Price Changed $229,999 CRMLS
- 2026-04-22 Price Changed $235,999 CRMLS
- 2026-03-16 Listed $238,999 CRMLS
Property tax history
+0.1%/yrLatest (2025): $122 · +0.3% YoY. Source: county tax records.
Cash-flow waterfall
monthlySold comps — $/sqft
last 12 mo · ≤1 miLoading sold comps…