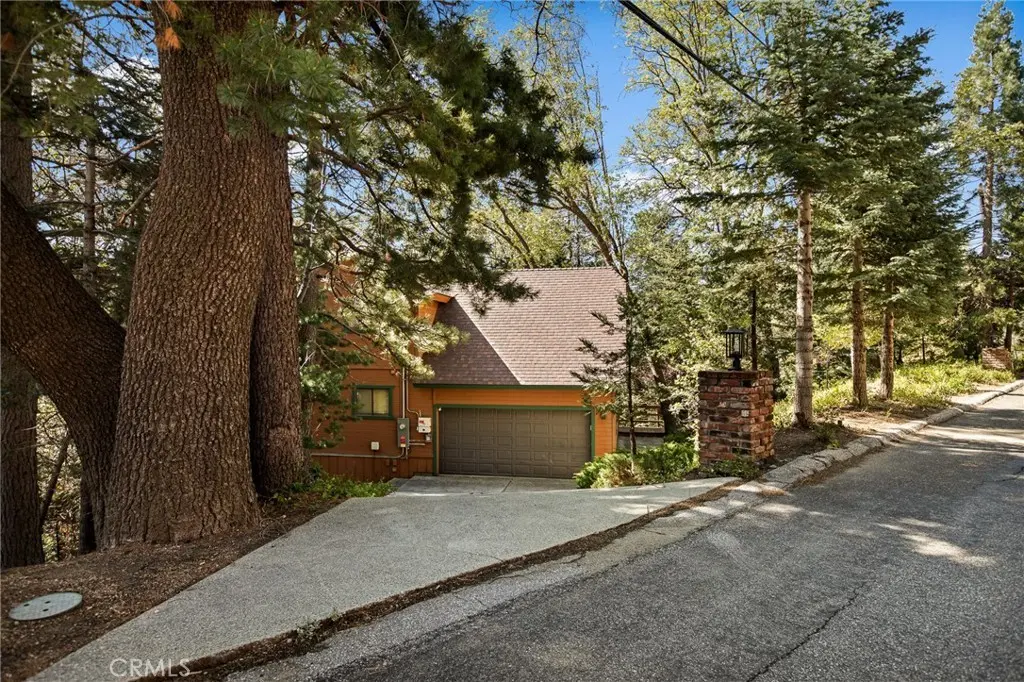
109 Old Toll · Lake Arrowhead, CA
Flood risk 1/10 · Minimal
- FEMA flood zone
- X (unshaded)
- Chance of flooding over 30 yrs
- 0.0%
- Est. flood insurance / yr
- $473 – $860
Fire risk 6/10 · Moderate
- Est. fire insurance / yr
- $659 – $1,223
Heat risk 3/10 · Minor
- Hot days now (above threshold)
- 3 days/yr
- Hot days in 30 yrs
- 3 days/yr
Wind risk 1/10 · Minimal
- Chance of severe wind over 30 yrs
- —
Air-quality risk 10/10 · Severe
- Unhealthy air days now
- 30 days/yr
- Unhealthy air days in 30 yrs
- 37 days/yr
Risk factors via First Street. Map © Google.
Why this score? — see what drove the D grade
The composite is a weighted blend of 9 inputs, each scored 0–100. Each bar is that input's sub-score; the figure is the points it added to the 100-point composite (weight × sub-score).
- ARV discount +15.0/15.0
- Cash flow +8.0/30.0
- Appreciation +5.0/10.0
- Livability +2.7/5.0
- Rent growth +2.5/5.0
- Condition / age +2.5/5.0
- Schools +2.1/10.0
- DSCR +2.0/10.0
- 1% rule +1.9/10.0
$724,900
🖨 Deal sheet (PDF) 📄 Offer letter ✓ Due diligence
Listing remarks
When opportunity knocks, you PICK UP! Clay for molding — a rare ruby in the rough with deep mountain vibes for days. This home has the bones; with a little TLC it will shine as a neighborhood standout. Cradled like a baby on a treed lot in a sought-after & direct-hike community, it feels cool and serene with wooded walls and large windows that bring the outdoors in for full effect living. A dreamy primary suite, whimsical “fairytale” touches throughout, gorgeous tile, brick, and exposed beams create instant character — impressive from the first foot in the door. Enjoy a great room, expansive decking, and abundant guest space. True privacy is enhanced by an adja
Key facts
- Large windows
- Primary suite
- Expansive decking
Tags
Property features AI
Finance
- Other: Single-family unit; No common walls; Additional parcel(s) present
- Financial info: Property listed as a fixer
- HOA & community: Community features: watersports, golf course, BLM/national forest access, rural setting, horse trails, hiking, fishing, mountainous terrain, lake access, biking, gutters, park, hunting, dog park
Exterior
- Parking: Attached garage; Two garage spaces; Driveway with down-slope from street; Total two parking spaces
- Utilities: Public sewer; District/public water; Natural gas connected; Electricity connected; Water connected
- Home design: House; Two stories; Entry on level 2
- Construction: Wood construction; Composition roof; Raised foundation; Built year per assessor
- Exterior features: Deck; Patio; Down slope from street lot; Has view; No pool
Interior
- Kitchen: Gas range; Dishwasher; Formal dining room and eat-in kitchen; Kitchen open to family room
- Bedrooms: No main-level bedrooms
- Flooring: Carpet; Laminate
- Bathrooms: Three full bathrooms; One half bathroom; Bathrooms include bathtub and shower
- Heating & cooling: Central furnace heating
- Interior features: Beamed ceilings; Wood product walls; Living room balcony; Attached living room deck; Two staircases; Open floor plan; Tile counters; Three or more levels; Main level has one bathroom
- Laundry & utility: Dedicated laundry room; Washer included; Dryer included
Neighborhood map
What this means for you Summary
Snapshot
- This is a 5-bed/4.0-bath single-family listed at $725k.
Deal economics
- At list price, monthly cash flow is $-752 ($-9k/yr) — negative.
- To cash-flow at today's rent, offer at most $592k (18.3% below list).
- To meet the 1% rule (rent ≥ 1% of price), the offer needs to be $501k (30.9% below list).
- Recommended offer: $501k (30.9% below list) — sets the bar for 1% rule.
- Cap rate 5.0% vs local median 2.8% in Lake Arrowhead — top-decile yield for the area; either an underpriced asset or a hidden risk that comps aren't pricing in. Stress-test before assuming the spread holds.
Location & tenants
- Location reads 53/100 on livability (#965 in CA) — a working-class tenant base; expect higher turnover. Strengths: housing A-, commute B+, employment B; Watch: health & safety C-, crime D+, amenities F.
- Rim Of The World Unified (town): math 13% / reading 34% proficiency, ranked #415 of 517 in CA (top 80%) — low school quality limits family demand, transient renter base, plan for 1-2y turnover.
- Zoned schools: Lake Arrowhead Elementary (421 students, 54% FRL); Mary P. Henck Intermediate (math 13% / reading 36%, grade F, #277 of 498 statewide, top 73%, 585 students, 61% FRL); Rim of The World Senior High (math 12% / reading 32%, grade F, #950 of 1,170 statewide, top 82%, 917 students, 52% FRL).
- Market conditions: 24 active listings in the ZIP; 7 comparable units currently listed for rent nearby; rentals lingering (median 46d on market — plan ~5-8 weeks vacancy on turnover, expect pricing pressure); 57% of comp listings sitting > 30 days — soft ceiling on asking rent; 5,458 units permitted in San Bernardino County in 2024 (1,500 in 5+ unit buildings).
Forward outlook
- In year one you build about $27k of equity ($5k loan paydown + $22k appreciation (3.0% local appreciation)).
- San Bernardino County population projected at +15% by 2050 — modest demand growth; plan on rents tracking national, not racing it.
- By year 2, paydown + projected appreciation supports a ~$44k cash-out refi (75% LTV) — recoverable capital for the next deal without selling this one.
Negotiation context
- It's been on market 52 days — a 3% lower offer ($703k) is reasonable based on typical stale-listing flexibility.
- 9 sale attempts since 20y ago; this cycle's ask has dropped $54k (7%) from the opening price — seller is motivated, your offer sets the floor, not the list.
- Current owner paid $528k; 37% above their basis — modest negotiation headroom, anchor on the comps not their cost.
Risks & watch-outs
- Climate carrying-cost: major wildfire risk — expect insurance premiums to compound above CPI over the hold.
Questions for the listing agent
- What do current leases actually rent for vs. the listed asking? Can we see a recent rent roll and the last 12 months of T-12 income?
- It's been on market 52 days. Have you received any prior offers? Is the seller open to a 31% concession, seller financing, or rate buy-down credit?
- Built in 1977 — when were the roof, HVAC, electrical panel, plumbing, and water heater last replaced?
- Is there a deadline driving the sale (1031 exchange, divorce, estate, relocation)? That informs how much negotiation room exists.
- Schools are D-rated, which usually means shorter tenancies and higher turnover. Who's the typical renter profile here, and what's been the actual vacancy rate?
- Crime grade is D in this area — have there been break-ins, vandalism, or insurance claims at this property in the last 3 years? What carrier currently insures it and at what premium?
- The area grade is low — what's the realistic commute time and amenity access for the typical tenant pool here? Any planned neighborhood developments (good or bad) we should know about?
- What's the average days-on-market for RENTAL listings here right now (not sales)? A rising rental-DOM trend means longer vacancies and softer asking-rent achievability than the comps imply.
- What's the recent tenant-quality profile in this submarket — average credit score on applications, eviction rate, late-payment / NSF rate, and stable-employment percentage? A property-management company in the area should have these aggregated.
- How much new for-sale + rental construction is in the pipeline within 1–3 miles? Heavy new supply typically softens prices + rents 12–24 months out; constrained supply supports both.
Investment metrics
- 1% rule
- 0.69% ✗
- Cap rate
- 5.05%
- Cash-on-cash
- -4.45%
- DSCR
- 0.80
- GRM
- 12.1
CMA / ARV
- ARV (median comp)
- $1,013,210
- List price
- $724,900
- Delta
- -28.46%
- Verdict
- UNDERPRICED
- Comps
- 20 within 1.0 mi
Show comp detail 12 sales within ~0.75 mi
| Address | Dist | Beds/Ba | Sqft | Sold | Price | $/sf | Match |
|---|---|---|---|---|---|---|---|
| 273 Shasta Dr | 0.22mi | 5/5.0 | 3,073 (-7%) | 9mo | $693,000 | $226 | 67 |
| 381 Old Toll Rd | 0.35mi | 4/3.5 (-1) | 3,283 (-1%) | 11mo | $775,000 | $236 | 66 |
| 432 Grizzly Rd | 0.43mi | 4/2.5 (-1) | 3,365 (+2%) | 5mo | $875,000 | $260 | 62 |
| 277 Grizzly Rd | 0.24mi | 5/3.5 | 2,824 (-15%) | 2mo | $895,000 | $317 | 61 |
| 439 Old Toll Rd | 0.42mi | 4/3.5 (-1) | 3,336 (+1%) | 14mo | $625,000 | $187 | 60 |
| 430 Rainier Rd | 0.47mi | 4/2.5 (-1) | 3,167 (-4%) | 9mo | $800,000 | $253 | 52 |
| 27442 Meadow Bay Dr | 0.62mi | 4/3.5 (-1) | 3,240 (-2%) | 10mo | $1,216,000 | $375 | 52 |
| 420 Golf Course Rd | 0.62mi | 5/3.5 | 3,598 (+9%) | 4mo | $1,800,000 | $500 | 51 |
| 161 Rocky Point Rd | 0.45mi | 4/4.0 (-1) | 3,720 (+12%) | 7mo | $2,550,000 | $685 | 48 |
| 499 Golf Course Ln | 0.65mi | 4/3.5 (-1) | 3,253 (-2%) | 19mo | $1,065,500 | $328 | 44 |
| 27556 Meadow Bay Dr | 0.65mi | 4/3.5 (-1) | 3,046 (-8%) | 18mo | $1,800,000 | $591 | 34 |
| 263 Golf Course Rd | 0.37mi | 4/2.5 (-1) | 2,820 (-15%) | 16mo | $670,000 | $238 | 34 |
Match score weights: distance 35% · size 25% · config 20% · recency 20%. Top-matched comps best support the ARV.
Projected returns pro-forma
3.0% appreciation · 3.0% rent growth · sell at horizon
- IRR
- 3.4%
- Equity multiple
- 1.19×
- Total profit
- $39,329
- Equity at exit
- $325,946
- IRR
- 6.7%
- Equity multiple
- 2.02×
- Total profit
- $207,087
- Equity at exit
- $502,322
Cash invested: $202,972 (down + closing). Projections, not guarantees.
Landlord ↔ Tenant lean methodology
- Overall (STATE)
- 18 Strongly Tenant-Friendly
- State California
- 18 Strongly Tenant-Friendly · D+13
- County
- — inherits STATE
- City
- — inherits STATE
ZIP-level market 92317
- Active inventory
- 24
- Price-to-rent
- 12.1×
Monthly cashflow live
- Estimated rent
- $5,012 high interval (Pro) →
- Mortgage (P&I)
- −$3,801
- Tax from tax record
- −$608 /mo · $7,297/yr
- Insurance
- −$302
- HOA
- −$0
- Vacancy / Maint / Mgmt
- −$1,053
- Net cashflow
- $-752
Break-even live
Sensitivity live
| Price | -10% $-342 | -5% $-547 | +0% $-752 | +5% $-957 | +10% $-1,162 |
|---|---|---|---|---|---|
| Rent | -10% $-1,148 | -5% $-950 | +0% $-752 | +5% $-554 | +10% $-356 |
| Rate | -1.0pp $-387 | -0.5pp $-568 | base $-752 | +0.5pp $-940 | +1.0pp $-1,131 |
UW: 25.0% down · 7.5% · 30yr · 1.5% tax · 5.0% vac · 8.0% maint · 8.0% mgmt
Financing live
Cash to close
- Down payment
- $181,225
- Closing costs
- $21,747
- Reserves months
- —
- Total cash needed
- —
Loan-product check · same deal, 3 products live
Conventional
25% down · 7.5% · 30yr
- Down + closing
- —
- Monthly P&I
- —
- Monthly cashflow
- —
- DSCR
- —
- Eligible?
- —
Personal DTI + credit; lowest rate.
DSCR
20% down · 8.5% · 30yr
- Down + closing
- —
- Monthly P&I
- —
- Monthly cashflow
- —
- DSCR
- —
- Eligible?
- —
No personal income docs; deal must DSCR.
Hard money
10% down · 12.0% · 12mo
- Down + closing
- —
- Monthly P&I
- —
- Monthly cashflow
- —
- DSCR
- —
- Eligible?
- —
Short-term bridge; refi at stabilization.
Rent comps 7 comps
| Address | Beds | Baths | Sqft | Rent | $/sqft | DOM | Units | Dist |
|---|---|---|---|---|---|---|---|---|
| 27313 Pinewood Dr Lake Arrowhead, CA | 4.0 | 2.5 | 2746 | $4,500 | $1.64 | 26d | 1 | 0.13mi |
| 27598 Meadow Bay Dr Lake Arrowhead, CA | 5.0 | 3.5 | 4063 | $9,000 | $2.22 | 45d | 1 | 0.62mi |
| 400 Cottage Grove Rd Lake Arrowhead, CA | 4.0 | 4.0 | 2500 | $5,700 | $2.28 | 45d | 1 | 0.91mi |
| 943 Nadelhorn Dr Lake Arrowhead, CA | 5.0 | 3.5 | 2890 | $3,800 | $1.31 | 45d | 1 | 1.03mi |
| 246 N Fairway Dr Lake Arrowhead, CA | 4.0 | 3.5 | 2439 | $3,500 | $1.44 | 18d | 1 | 1.24mi |
| 27775 Matterhorn Dr Lake Arrowhead, CA | 4.0 | 3.5 | 2706 | $4,000 | $1.48 | 0d | 1 | 1.44mi |
| 887 Talisman Ln Lake Arrowhead, CA | 4.0 | 3.0 | 3622 | $4,900 | $1.35 | 45d | 1 | 1.44mi |
Listing history 34 events
-
2026-06-21days on market $724,900 Active 52 DOM
-
2026-06-18days on market $724,900 Active 49 DOM
-
2026-06-17days on market $724,900 Active 48 DOM
-
2026-06-16days on market $724,900 Active 47 DOM
-
2026-06-15days on market $724,900 Active 46 DOM
-
2026-06-13days on market $724,900 Active 44 DOM
-
2026-06-13days on market $724,900 Active 43 DOM
-
2026-06-09days on market $724,900 Active 40 DOM
-
2026-06-08days on market $724,900 Active 39 DOM
-
2026-06-07days on market $724,900 Active 38 DOM
-
2026-06-04pricedays on market $724,900 Active 35 DOM
-
2026-06-03days on market $749,000 Active 34 DOM
-
2026-06-02days on market $749,000 Active 33 DOM
-
2026-06-01days on market $749,000 Active 32 DOM
-
2026-05-31days on market $749,000 Active 31 DOM
-
2026-04-30$779,000 Active 894-char remark
-
2022-08-26historical
-
2022-08-25historical
-
2022-08-24historical
-
2022-08-24historical
-
2017-11-17soldstatus $528,000
-
2017-11-17soldstatus $528,000 Closed Sale
-
2017-11-17soldstatus $528,000
-
2017-11-17soldstatus $528,000
-
2017-10-13status Pending Sale
-
2017-05-05$549,000 Active
-
2017-05-05$549,000
-
2017-05-05$549,000
-
2017-01-28historical
-
2016-07-28$569,000 Active
-
2016-07-28$569,000
-
2015-04-30$579,000
-
2014-05-23$589,000
-
2006-05-22$649,000
ⓘ Source: listings_history table (triggers on properties + properties_extension) + one-shot
backfill from property_details.listing_events for pre-trigger history.
Tax reassessment forecast CA · Resets to sale price
- Current annual tax
- $7,297 · $608/mo
- Projected year-2 tax
- $7,297 · $608/mo
- Expected delta
- $0/yr ($0/mo · 0.0%)
ⓘ Screening estimate from a state-policy table — verify with the county assessor before closing.
Climate risk First Street
- Flood 1/10 Low FEMA zone X (unshaded) · 0% chance over 30 yrs
- Wildfire 6/10 Major
- Heat 3/10 Moderate
- Wind 1/10 Low
- Air quality 10/10 Extreme 30 unhealthy d/yr today · 37 by 30 yrs out
Nearby sold comps map
Loading sold comps map…
Walkable amenities ~0.75 mi
Loading nearby amenities…
Taxation est. · year 1
- Rental income
- $60,147
- − Mortgage interest
- −$40,606
- − Property taxes
- −$7,297
- − Insurance
- −$3,624
- − Repairs & maintenance
- −$4,812
- − Management
- −$4,812
- − Depreciation
- −$21,088
- Taxable loss
- −$22,092
- Est. tax savings @ 24.0%
- +$5,302
- After-tax cash flow
- $-3,721/yr
For passive investors: Depreciation is non-cash, so a rental often shows a tax loss while cash-flowing — sheltering income. Rental losses are passive: they offset passive income freely, and up to $25,000/yr can offset ordinary (W-2) income if you actively participate and your MAGI is under $100k (phasing out to $0 by $150k); unused losses carry forward. On sale, claimed depreciation is recaptured at up to 25%, and gains may owe capital-gains tax (a 1031 exchange can defer both). Figures are a year-1 estimate at your 24.0% rate — not tax advice; consult a CPA.
Schools (NCES district)
- District
- Rim Of The World Unified
- NCES district ID
- 0632610
- Math proficiency
- 13% ▼ -10.00%
- Reading proficiency
- 34% ▼ -7.00%
- Median HH income
- $55,860
- Composite
- 21.29/100
- National rank
- #8389
- State rank
- #415 of 517 in CA
Livability — Lake Arrowhead
- Score
- 53/100
- State rank
- #965
- US rank
- #24524
Category grades
Schools grade is shown separately in the Schools card above.
Census & demographics
- Census place
- Lake Arrowhead, CA
- City population
- 6,246
- Population (ZIP)
- 708
Population outlook (San Bernardino County) Hauer SSP2
- Today (2025)
- 2,300,329 people
- By 2030
- 2,378,907 · +3.4%
- By 2040
- 2,523,137 · +9.7%
- By 2050
- 2,642,388 · +14.9%
- By 2075
- 2,880,769 · +25.2%
- By 2100
- 2,909,436 · +26.5%
Race, ethnicity, and origin ACS 2023
- Neighborhood character
- Predominantly White (69%)
- Race & ethnicity
- White 69% Hispanic / Latino 20% Two or more races 7% Black 3%
- Hispanic origin (detail)
- Mexican 20%
- Common ancestry
- Serbian 16% German 8% Italian 7%
- Foreign-born
- 17% · Canada
- Languages at home
- 87% English-only · Spanish 8% Russian/Polish/Slavic 3% German/W. Germanic 2%
Political lean MEDSL · San Bernardino
- 2024 margin
- Toss-up / Even · D 47.5% · R 49.7% · Other 2.8%
- 2008→2024 swing
- -8.5pp toward R · 2008: 6.3pp · 2024: -2.1pp
- All cycles
- 2024: R+2.1 2020: D+10.7 2016: D+9.8 2012: D+5.4 2008: D+6.3
Not yet ingested
- Civics
- —
Market trends
- HPI YoY
- —
- Current HPI
- —
- Rent YoY
- —
- Metro
- —
- State GDP YoY
- ▲ 3.21%
- F500 in state
- 116
Industry mix (Fortune 500 HQ in CA)
| Industry | F500 HQs | Revenue |
|---|---|---|
| Technology | 27 | $1,492B |
|
||
| Financial Services | 3 | $174B |
|
||
| Retail | 3 | $44B |
|
||
| Insurance | 3 | $26B |
|
||
| Media / Entertainment | 2 | $115B |
|
||
| Pharmaceuticals / Biotech | 2 | $62B |
|
||
Price history
+11.7% since first listed21 events — show timeline
- 2026-06-03 Price Changed $724,900 CRMLS
- 2026-05-19 Price Changed $749,000 CRMLS
- 2026-04-30 Listed $779,000 CRMLS
- 2022-08-26 Listing Removed — CRMLS
- 2022-08-25 Listing Removed — CRMLS
- 2022-08-24 Listing Removed — CRMLS
- 2022-08-24 Listing Removed — CRMLS
- 2017-11-17 Sold (Public Records) $528,000 Public Records
- 2017-11-17 Sold (MLS) $528,000 MRCAOR
- 2017-11-17 Sold (MLS) $528,000 CRMLS
- 2017-11-17 Sold (MLS) $528,000 CRMLS
- 2017-10-13 Pending — CRMLS
- 2017-05-05 Listed $549,000 CRMLS
- 2017-05-05 Listed $549,000 MRCAOR
- 2017-05-05 Listed $549,000 CRMLS
- 2017-01-28 Listing Removed — CRMLS
- 2016-07-28 Listed $569,000 CRMLS
- 2016-07-28 Listed $569,000 CRMLS
- 2015-04-30 Listed $579,000 CRMLS
- 2014-05-23 Listed $589,000 CRMLS
- 2006-05-22 Listed $649,000 CRMLS
Property tax history
+1.7%/yrLatest (2025): $7,297 · +5.8% YoY. Source: county tax records.
Cash-flow waterfall
monthlySold comps — $/sqft
last 12 mo · ≤1 miLoading sold comps…