39681 Bluestem Rd E · Davenport, WA
Flood risk No data
- FEMA flood zone
- —
- Chance of flooding over 30 yrs
- —
- Est. flood insurance / yr
- —
Fire risk No data
- Est. fire insurance / yr
- —
Heat risk No data
- Hot days now (above threshold)
- —
- Hot days in 30 yrs
- —
Wind risk No data
- Chance of severe wind over 30 yrs
- —
Air-quality risk No data
- Unhealthy air days now
- —
- Unhealthy air days in 30 yrs
- —
Risk factors via First Street. Map © Google.
Why this score? — see what drove the B grade
The composite is a weighted blend of 9 inputs, each scored 0–100. Each bar is that input's sub-score; the figure is the points it added to the 100-point composite (weight × sub-score).
- Cash flow +30.0/30.0
- 1% rule +10.0/10.0
- DSCR +10.0/10.0
- ARV discount +7.5/15.0
- Schools +5.7/10.0
- Livability +3.6/5.0
- Rent growth +2.5/5.0
- Condition / age +1.0/5.0
- Appreciation +0.0/10.0
$59,950
🖨 Deal sheet (PDF) 📄 Offer letter ✓ Due diligence
Listing remarks
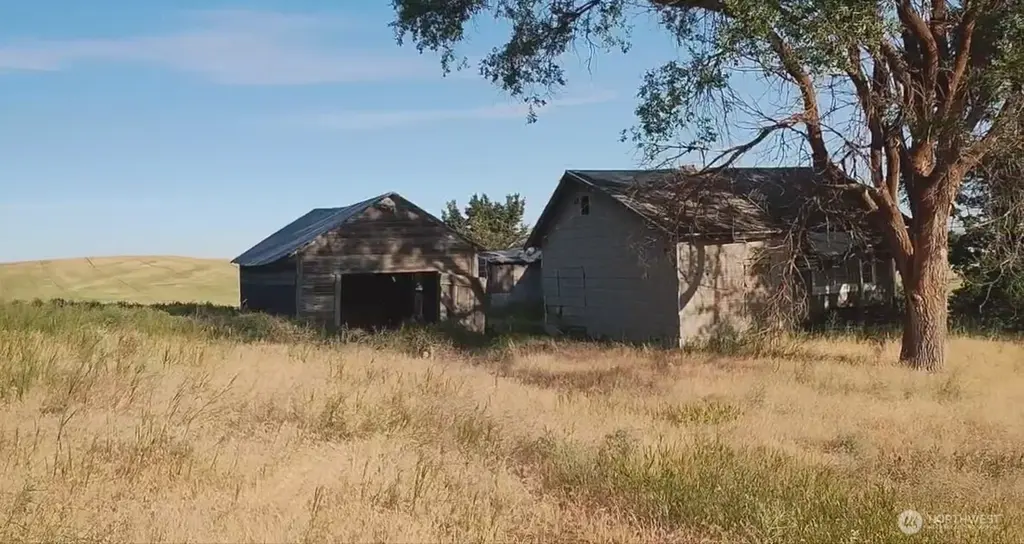
Ready to build your dream homestead? Owner financing available, making it easier than ever to start your journey. This rural gem located in Bluestem WA a true ghost town offers land equipped with electric, drilled well, and septic—perfect starting point for your new home. Enjoy wide-open skies, peaceful living, and room to grow. Ideal for those seeking self-sufficiency with modern comforts already in place. Don’t miss this rare opportunity to create the lifestyle you’ve been dreaming of—bring your plans and make it your own!
Key facts
- Septic
- Drilled well
- 0.4 acre lot
Tags
Neighborhood map
What this means for you Summary
Snapshot
- This is a 2-bed/1.0-bath single-family listed at $60k. Condition is rated poor.
Deal economics
- At list price, monthly cash flow is $841 ($10k/yr) — positive.
- The deal already cash-flows at list — no discount required.
- Meets the 1% rule at list price ($2k rent vs $60k).
- Recommended offer: $53k (12.0% below list) — sets the bar for market timing.
- Cap rate 23.1% vs local median 2.2% in Davenport — top-decile yield for the area; either an underpriced asset or a hidden risk that comps aren't pricing in. Stress-test before assuming the spread holds.
Location & tenants
- Location reads 72/100 on livability (#213 in WA) — a middle-class / working-renter tenant base. Strengths: cost of living A+, housing A+, health & safety A+; Watch: amenities F, commute F.
- Davenport School District (rural): math 63% / reading 68% proficiency, ranked #34 of 291 in WA (top 12%) — acceptable for families but not a draw, mixed tenant base, ~2y average lease.
- Zoned schools: Davenport Elementary (299 students, 56% FRL) — zoned schools average 56% FRL vs 38% district-wide (19 pts higher); higher-poverty schools than district average — tighter screening recommended.
- Market conditions: 180 active listings in the ZIP; 49 units permitted in Lincoln County in 2024 (0 in 5+ unit buildings).
Forward outlook
- Local home prices are declining (-3.0%/yr); year-one equity from $414 of loan paydown is wiped out by about $2k of value loss. Plan a longer hold.
- Lincoln County population projected at -20% by 2050 — secular population decline; favor cash flow + early exit over multi-decade hold.
- At projected returns (-3.0% appreciation + 3.0% rent growth), your $17k cash investment doubles in ~2 years — after that, you're playing with house money.
Negotiation context
- It's been on market 149 days — a 12% lower offer ($53k) is reasonable based on typical stale-listing flexibility.
- 3 sale attempts with the ask held roughly flat each time — persistent listings suggest the price (not the market) is what's stuck; bring a comps-based counter.
Risks & watch-outs
- Watch-outs: built in 1900 — expect roof / HVAC / electrical / plumbing capex.
Questions for the listing agent
- It's been on market 149 days. Have you received any prior offers? Is the seller open to a 12% concession, seller financing, or rate buy-down credit?
- Have any recent inspections been done? Can we get a copy of the seller's disclosures and any deferred-maintenance estimates?
- Built in 1900 — when were the roof, HVAC, electrical panel, plumbing, and water heater last replaced?
- Why hasn't it sold? Are there any deal-killer items the seller is aware of (foundation, flood, title, zoning, code violations)?
- Is there a deadline driving the sale (1031 exchange, divorce, estate, relocation)? That informs how much negotiation room exists.
- Schools are A-rated — typically a magnet for longer-tenancy family renters. What's the average tenant stay here, and is there a school-zone premium baked into asking?
- What's the average days-on-market for RENTAL listings here right now (not sales)? A rising rental-DOM trend means longer vacancies and softer asking-rent achievability than the comps imply.
- What's the recent tenant-quality profile in this submarket — average credit score on applications, eviction rate, late-payment / NSF rate, and stable-employment percentage? A property-management company in the area should have these aggregated.
- How much new for-sale + rental construction is in the pipeline within 1–3 miles? Heavy new supply typically softens prices + rents 12–24 months out; constrained supply supports both.
Investment metrics
- 1% rule
- 2.65% ✓
- Cap rate
- 23.12%
- Cash-on-cash
- 60.10%
- DSCR
- 3.67
- GRM
- 3.1
CMA / ARV
No comps found within radius.
Projected returns pro-forma
-3.0% appreciation · 3.0% rent growth · sell at horizon
- IRR
- 58.8%
- Equity multiple
- 3.61×
- Total profit
- $43,853
- Equity at exit
- $8,939
- IRR
- 63.6%
- Equity multiple
- 7.39×
- Total profit
- $107,229
- Equity at exit
- $5,183
Cash invested: $16,786 (down + closing). Projections, not guarantees.
Landlord ↔ Tenant lean methodology
- Overall (STATE)
- 28 Tenant-Leaning
- State Washington
- 28 Tenant-Leaning · D+8
- County
- — inherits STATE
- City
- — inherits STATE
ZIP-level market 99122
- Home prices YoY
- -17.6%
- Active inventory
- 180
- Price-to-rent
- 3.1×
Monthly cashflow live
- Estimated rent
- $1,589 medium interval (Pro) →
- Mortgage (P&I)
- −$314
- Tax est. 1.5%
- −$75 /mo · $899/yr
- Insurance
- −$25
- HOA
- −$0
- Vacancy / Maint / Mgmt
- −$334
- Net cashflow
- $841
Break-even live
Sensitivity live
| Price | -10% $882 | -5% $861 | +0% $841 | +5% $820 | +10% $799 |
|---|---|---|---|---|---|
| Rent | -10% $715 | -5% $778 | +0% $841 | +5% $903 | +10% $966 |
| Rate | -1.0pp $871 | -0.5pp $856 | base $841 | +0.5pp $825 | +1.0pp $809 |
UW: 25.0% down · 7.5% · 30yr · 1.5% tax · 5.0% vac · 8.0% maint · 8.0% mgmt
Financing live
Cash to close
- Down payment
- $14,988
- Closing costs
- $1,798
- Reserves months
- —
- Total cash needed
- —
Loan-product check · same deal, 3 products live
Conventional
25% down · 7.5% · 30yr
- Down + closing
- —
- Monthly P&I
- —
- Monthly cashflow
- —
- DSCR
- —
- Eligible?
- —
Personal DTI + credit; lowest rate.
DSCR
20% down · 8.5% · 30yr
- Down + closing
- —
- Monthly P&I
- —
- Monthly cashflow
- —
- DSCR
- —
- Eligible?
- —
No personal income docs; deal must DSCR.
Hard money
10% down · 12.0% · 12mo
- Down + closing
- —
- Monthly P&I
- —
- Monthly cashflow
- —
- DSCR
- —
- Eligible?
- —
Short-term bridge; refi at stabilization.
Listing history 22 events
-
2026-06-21days on market $59,950 Active 149 DOM
-
2026-06-21days on market $59,950 Active 148 DOM
-
2026-06-18days on market $59,950 Active 146 DOM
-
2026-06-17days on market $59,950 Active 145 DOM
-
2026-06-16days on market $59,950 Active 144 DOM
-
2026-06-15days on market $59,950 Active 143 DOM
-
2026-06-15days on market $59,950 Active 142 DOM
-
2026-06-13days on market $59,950 Active 141 DOM
-
2026-06-12days on market $59,950 Active 140 DOM
-
2026-06-09days on market $59,950 Active 137 DOM
-
2026-06-08days on market $59,950 Active 136 DOM
-
2026-06-08days on market $59,950 Active 135 DOM
-
2026-06-07days on market $59,950 Active 134 DOM
-
2026-06-03days on market $59,950 Active 131 DOM
-
2026-06-02days on market $59,950 Active 130 DOM
-
2026-06-01days on market $59,950 Active 129 DOM
-
2026-05-31days on market $59,950 Active 128 DOM
-
2026-04-30status Active
-
2026-04-28status Pending
-
2026-02-02status Active
-
2026-01-19status Pending
-
2026-01-07$59,950 Active
ⓘ Source: listings_history table (triggers on properties + properties_extension) + one-shot
backfill from property_details.listing_events for pre-trigger history.
Nearby sold comps map
Loading sold comps map…
Walkable amenities ~0.75 mi
Loading nearby amenities…
Taxation est. · year 1
- Rental income
- $19,063
- − Mortgage interest
- −$3,358
- − Property taxes
- −$899
- − Insurance
- −$300
- − Repairs & maintenance
- −$1,525
- − Management
- −$1,525
- − Depreciation
- −$1,744
- Taxable income
- $9,712
- Est. tax owed @ 24.0%
- −$2,331
- After-tax cash flow
- $7,757/yr
For passive investors: Depreciation is non-cash, so a rental often shows a tax loss while cash-flowing — sheltering income. Rental losses are passive: they offset passive income freely, and up to $25,000/yr can offset ordinary (W-2) income if you actively participate and your MAGI is under $100k (phasing out to $0 by $150k); unused losses carry forward. On sale, claimed depreciation is recaptured at up to 25%, and gains may owe capital-gains tax (a 1031 exchange can defer both). Figures are a year-1 estimate at your 24.0% rate — not tax advice; consult a CPA.
Condition & rehab AI · 8 photos
This property is in a state of abandonment and requires extensive repairs and maintenance to be considered habitable. Clearing vegetation and repairing the roof are the highest-priority updates to improve its value.
Repairs flagged
- Major roof — Missing shingles, exposed structure
- Major exterior — Overgrown vegetation, dilapidated structures
- Major HVAC/mechanicals — No visible HVAC/mechanicals
Value-add opportunities
- Both Clear overgrown vegetation and repair roof — Improves curb appeal and functionality
- Both Repair and replace roof — Essential for structural integrity and functionality
- Both Repair and replace exterior — Improves curb appeal and functionality
- Both Install HVAC/mechanicals — Essential for comfort and functionality
Renovation cost estimate screening
| Repair item | Severity | Est. cost |
|---|---|---|
| roof · Missing shingles, exposed structure | Major | $15,000–50,000 |
| exterior · Overgrown vegetation, dilapidated structures | Major | $15,000–50,000 |
| HVAC/mechanicals · No visible HVAC/mechanicals | Major | $15,000–50,000 |
| Total estimated repair cost · 3 items | $45,000–150,000 |
Value-add ROI direction
- Both Clear overgrown vegetation and repair roof — Improves curb appeal and functionality ↑
- Both Repair and replace roof — Essential for structural integrity and functionality ↑
- Both Repair and replace exterior — Improves curb appeal and functionality ↑
- Both Install HVAC/mechanicals — Essential for comfort and functionality ↑
ⓘ Cost ranges are severity-bucket heuristics (US national rule-of-thumb). Get contractor quotes + a written scope before underwriting a rehab budget.
Schools (NCES district)
- District
- Davenport School District
- NCES district ID
- 5302010
- Math proficiency
- 63% ▼ -5.00%
- Reading proficiency
- 68% ▼ -5.00%
- Median HH income
- $52,713
- Composite
- 57.27/100
- National rank
- #2305
- State rank
- #34 of 291 in WA
Livability — Davenport
- Score
- 72/100
- State rank
- #213
- US rank
- #6059
Category grades
Schools grade is shown separately in the Schools card above.
Census & demographics
- Population (ZIP)
- 4,044
Population outlook (Lincoln County) Hauer SSP2
- Today (2025)
- 9,599 people
- By 2030
- 9,146 · -4.7%
- By 2040
- 8,298 · -13.6%
- By 2050
- 7,683 · -20.0%
- By 2075
- 6,790 · -29.3%
- By 2100
- 6,029 · -37.2%
Race, ethnicity, and origin ACS 2023
- Neighborhood character
- Predominantly White (86%)
- Race & ethnicity
- White 86% Two or more races 6% Hispanic / Latino 4% Native American 4%
- Common ancestry
- Portuguese 4% Italian 3% Slovak 2%
- Foreign-born
- 1% · Canada
- Languages at home
- 97% English-only · Spanish 1% Tagalog/Filipino 1%
Political lean MEDSL · Lincoln
- 2024 margin
- Solid R (+50.6) · D 23.6% · R 74.2% · Other 2.2%
- 2008→2024 swing
- -20.9pp toward R · 2008: -29.6pp · 2024: -50.6pp
- All cycles
- 2024: R+50.6 2020: R+48.9 2016: R+50.2 2012: R+40.9 2008: R+29.6
Not yet ingested
- Civics
- —
Market trends
- HPI YoY
- ▼ -57.76%
- Current HPI
- 270.3074
- Rent YoY
- —
- Metro
- —
- State GDP YoY
- ▲ 4.65%
- F500 in state
- 22
Industry mix (Fortune 500 HQ in WA)
| Industry | F500 HQs | Revenue |
|---|---|---|
| Retail | 2 | $269B |
|
||
| Technology / Retail | 1 | $638B |
|
||
| Technology | 1 | $245B |
|
||
| Telecommunications | 1 | $38B |
|
||
| Food / Beverage | 1 | $36B |
|
||
| Automotive / Trucks | 1 | $34B |
|
||
Price history
5 events — show timeline
- 2026-04-30 Relisted — NWMLS as Distributed by MLS Grid
- 2026-04-28 Pending — NWMLS as Distributed by MLS Grid
- 2026-02-02 Relisted — NWMLS as Distributed by MLS Grid
- 2026-01-19 Pending — NWMLS as Distributed by MLS Grid
- 2026-01-07 Listed $59,950 NWMLS as Distributed by MLS Grid
Cash-flow waterfall
monthlySold comps — $/sqft
last 12 mo · ≤1 miLoading sold comps…