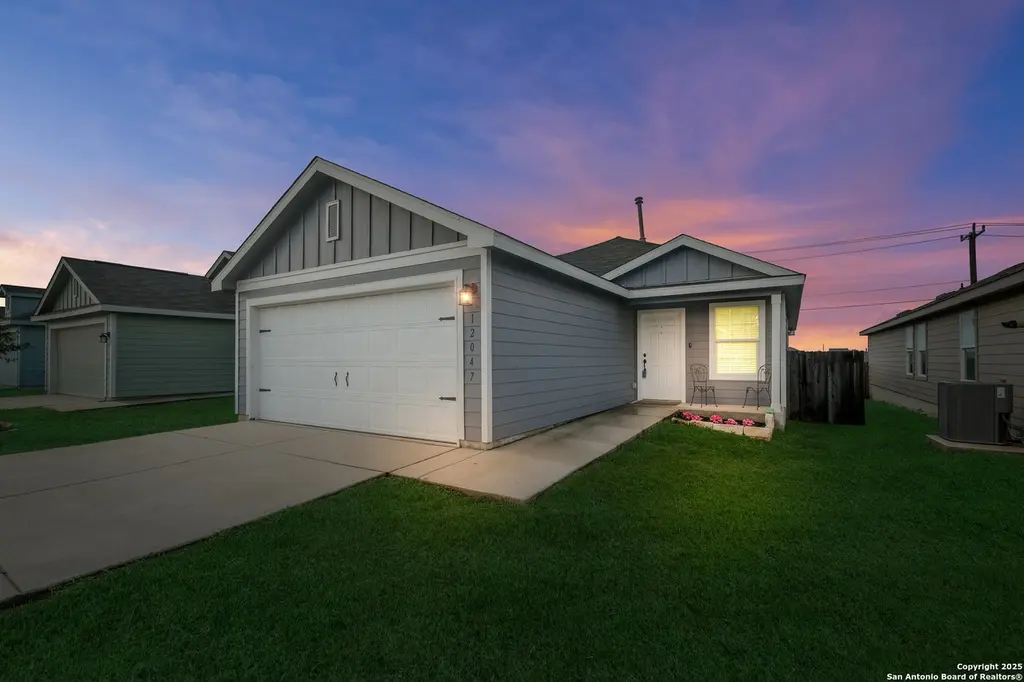
12047 Overton Way · San Antonio, TX
Flood risk 1/10 · Minimal
- FEMA flood zone
- X (unshaded)
- Chance of flooding over 30 yrs
- 0.0%
- Est. flood insurance / yr
- $507 – $1,088
Fire risk 5/10 · Moderate
- Est. fire insurance / yr
- $1,222 – $2,270
Heat risk 8/10 · Major
- Hot days now (above 109°F)
- 6 days/yr
- Hot days in 30 yrs
- 19 days/yr
Wind risk 8/10 · Major
- Chance of severe wind over 30 yrs
- 80.0%
Air-quality risk 2/10 · Minimal
- Unhealthy air days now
- 0 days/yr
- Unhealthy air days in 30 yrs
- 1 days/yr
Risk factors via First Street. Map © Google.
Why this score? — see what drove the D- grade
The composite is a weighted blend of 9 inputs, each scored 0–100. Each bar is that input's sub-score; the figure is the points it added to the 100-point composite (weight × sub-score).
- ARV discount +13.0/15.0
- Cash flow +6.8/30.0
- Appreciation +6.0/10.0
- Livability +4.0/5.0
- 1% rule +2.6/10.0
- Condition / age +2.5/5.0
- Schools +1.8/10.0
- DSCR +1.0/10.0
- Rent growth +0.7/5.0
$213,000
🖨 Deal sheet (PDF) 📄 Offer letter ✓ Due diligence
Listing remarks MLS
Seller is offering concessions! This generous incentive can be applied towards closing costs or to buy down the buyer's interest rate. Welcome to 12047 Overton Way, San Antonio, TX 78221-a charming Cottage Collection home featuring 3 bedrooms, 2 full baths, and 1,266 sq. ft. of efficient living space. The open-concept layout connects the kitchen, dining, and living areas, perfect for everyday living and entertaining. The kitchen offers granite countertops, a gas range, and open sightlines to the dining area. The private primary suite is located at the rear of the home and includes a spacious bath and large walk-in closet. Two secondary bedrooms and a full bath sit toward the front, ideal for guests or a home office. Enjoy added privacy with no rear neighbors and convenient access to nearby parks and the scenic Million Del Lago Golf Course. Low-maintenance living in a quiet, amenity-rich community.
Key facts
- No rear neighbors
- Large walk-in closet
- Granite countertops
Tags
Neighborhood map
What this means for you Summary
Snapshot
- This is a 3-bed/2.0-bath single-family listed at $213k.
Deal economics
- At list price, monthly cash flow is $-333 ($-4k/yr) — negative.
- To cash-flow at today's rent, offer at most $154k (27.6% below list).
- To meet the 1% rule (rent ≥ 1% of price), the offer needs to be $161k (24.4% below list).
- Recommended offer: $154k (27.6% below list) — sets the bar for cash-flow.
Location & tenants
- Location reads 80/100 on livability (#31 in TX, #1,616 nationally) — a professional / high-income tenant draw. Strengths: amenities A+, commute A+, cost of living A+; Watch: crime F.
- Southside ISD (rural): math 16% / reading 25% proficiency, ranked #771 of 826 in TX (top 93%) — low school quality limits family demand, transient renter base, plan for 1-2y turnover; 76% free/reduced lunch — lower-income household profile, screen leases tightly.
- Zoned schools: W M Pearce Pri (math 20% / reading 22%, grade F, #3,492 of 4,322 statewide, top 81%, 466 students, 90% FRL); Julius L Matthey Middle (math 17% / reading 25%, grade F, #1,387 of 1,662 statewide, top 85%, 604 students, 92% FRL); Southside H S (math 18% / reading 25%, grade F, #1,377 of 1,632 statewide, top 85%, 1,685 students, 85% FRL).
- Market conditions: Rents falling (-7.2%/yr); 389 active listings in the ZIP; 24 comparable units currently listed for rent nearby; rentals at typical pace (median 23d on market — plan ~3-4 weeks tenant-placement turnaround); 8,308 units permitted in Bexar County in 2024 (2,506 in 5+ unit buildings).
- This rent runs 30% of the median local income ($64k/yr) — at the standard rent-burdened threshold; future hikes will face affordability resistance.
Forward outlook
- In year one you build about $6k of equity ($1k loan paydown + $4k appreciation (2.0% local appreciation)).
- Bexar County population projected at +50% by 2050 — long-run rental-demand tailwind backs the buy-and-hold thesis.
- By year 6, paydown + projected appreciation supports a ~$31k cash-out refi (75% LTV) — recoverable capital for the next deal without selling this one.
Negotiation context
- It's been on market 179 days — a 12% lower offer ($187k) is reasonable based on typical stale-listing flexibility.
Risks & watch-outs
- Climate carrying-cost: severe wind risk, 80% chance of damaging wind over 30y; moderate wildfire risk; extreme-heat days projected 6→19/yr by 2055 (HVAC capex compounding) — expect insurance premiums to compound above CPI over the hold.
Questions for the listing agent
- What do current leases actually rent for vs. the listed asking? Can we see a recent rent roll and the last 12 months of T-12 income?
- It's been on market 179 days. Have you received any prior offers? Is the seller open to a 28% concession, seller financing, or rate buy-down credit?
- What does the HOA fee cover, when was the last increase, and are there any pending special assessments or reserve-fund shortfalls?
- Why hasn't it sold? Are there any deal-killer items the seller is aware of (foundation, flood, title, zoning, code violations)?
- Is there a deadline driving the sale (1031 exchange, divorce, estate, relocation)? That informs how much negotiation room exists.
- Crime grade is F in this area — have there been break-ins, vandalism, or insurance claims at this property in the last 3 years? What carrier currently insures it and at what premium?
- The area grade is low — what's the realistic commute time and amenity access for the typical tenant pool here? Any planned neighborhood developments (good or bad) we should know about?
- What's the average days-on-market for RENTAL listings here right now (not sales)? A rising rental-DOM trend means longer vacancies and softer asking-rent achievability than the comps imply.
- What's the recent tenant-quality profile in this submarket — average credit score on applications, eviction rate, late-payment / NSF rate, and stable-employment percentage? A property-management company in the area should have these aggregated.
- How much new for-sale + rental construction is in the pipeline within 1–3 miles? Heavy new supply typically softens prices + rents 12–24 months out; constrained supply supports both.
Investment metrics
- 1% rule
- 0.76% ✗
- Cap rate
- 4.42%
- Cash-on-cash
- -6.70%
- DSCR
- 0.70
- GRM
- 11.0
CMA / ARV
- ARV (median comp)
- $242,363
- List price
- $213,000
- Delta
- -12.12%
- Verdict
- UNDERPRICED
- Comps
- 20 within 1.0 mi
Show comp detail 12 sales within ~0.75 mi
| Address | Dist | Beds/Ba | Sqft | Sold | Price | $/sf | Match |
|---|---|---|---|---|---|---|---|
| 711 Cook Bnd | 0.07mi | 3/2.0 | 1,276 (0%) | 4mo | $154,000 | $121 | 93 |
| 11910 Kingfisher | 0.22mi | 3/2.0 | 1,192 (-7%) | 0mo | $199,000 | $167 | 79 |
| 11934 Catbird | 0.19mi | 3/2.0 | 1,211 (-5%) | 10mo | $210,000 | $173 | 75 |
| 12060 Overton | 0.04mi | 3/2.0 | 1,450 (+14%) | 2mo | $225,000 | $155 | 73 |
| 13026 Lorena Ochoa | 0.63mi | 3/2.0 | 1,242 (-3%) | 8mo | $215,025 | $173 | 60 |
| 13375 Furyk Dr | 0.55mi | 3/2.0 | 1,213 (-5%) | 9mo | $202,999 | $167 | 58 |
| 13226 Club House Blvd | 0.65mi | 3/2.0 | 1,315 (+3%) | 8mo | $219,925 | $167 | 58 |
| 751 Vermilion | 0.27mi | 3/2.0 | 1,454 (+14%) | 8mo | $234,999 | $162 | 57 |
| 13463 Furyk Dr | 0.59mi | 3/2.0 | 1,354 (+6%) | 9mo | $192,049 | $142 | 55 |
| 13234 Club House Blvd | 0.63mi | 4/2.0 (+1) | 1,377 (+8%) | 1mo | $246,675 | $179 | 52 |
| 13214 Club House Blvd | 0.63mi | 4/2.0 (+1) | 1,377 (+8%) | 9mo | $218,704 | $159 | 45 |
| 13126 Lorena Ochoa | 0.65mi | 4/2.0 (+1) | 1,377 (+8%) | 8mo | $218,409 | $159 | 45 |
Match score weights: distance 35% · size 25% · config 20% · recency 20%. Top-matched comps best support the ARV.
Projected returns pro-forma
2.03% appreciation · 0.0% rent growth · sell at horizon
- IRR
- -3.4%
- Equity multiple
- 0.82×
- Total profit
- $-10,922
- Equity at exit
- $84,341
- IRR
- -0.1%
- Equity multiple
- 0.99×
- Total profit
- $-595
- Equity at exit
- $121,704
Cash invested: $59,640 (down + closing). Projections, not guarantees.
Landlord ↔ Tenant lean methodology
- Overall (STATE)
- 87 Strongly Landlord-Friendly
- State Texas
- 87 Strongly Landlord-Friendly · R+5
- County
- — inherits STATE
- City
- — inherits STATE
ZIP-level market 78221
- Home prices YoY
- 0.8%
- Rents YoY
- -7.2%
- Active inventory
- 389
- Price-to-rent
- 11.0×
Monthly cashflow live
- Estimated rent
- $1,611 high interval (Pro) →
- Mortgage (P&I)
- −$1,117
- Tax from tax record
- −$371 /mo · $4,451/yr
- Insurance
- −$89
- HOA
- −$29
- Vacancy / Maint / Mgmt
- −$338
- Net cashflow
- $-333
Break-even live
Sensitivity live
| Price | -10% $-213 | -5% $-273 | +0% $-333 | +5% $-393 | +10% $-454 |
|---|---|---|---|---|---|
| Rent | -10% $-460 | -5% $-397 | +0% $-333 | +5% $-270 | +10% $-206 |
| Rate | -1.0pp $-226 | -0.5pp $-279 | base $-333 | +0.5pp $-388 | +1.0pp $-445 |
UW: 25.0% down · 7.5% · 30yr · 1.5% tax · 5.0% vac · 8.0% maint · 8.0% mgmt
Financing live
Cash to close
- Down payment
- $53,250
- Closing costs
- $6,390
- Reserves months
- —
- Total cash needed
- —
Loan-product check · same deal, 3 products live
Conventional
25% down · 7.5% · 30yr
- Down + closing
- —
- Monthly P&I
- —
- Monthly cashflow
- —
- DSCR
- —
- Eligible?
- —
Personal DTI + credit; lowest rate.
DSCR
20% down · 8.5% · 30yr
- Down + closing
- —
- Monthly P&I
- —
- Monthly cashflow
- —
- DSCR
- —
- Eligible?
- —
No personal income docs; deal must DSCR.
Hard money
10% down · 12.0% · 12mo
- Down + closing
- —
- Monthly P&I
- —
- Monthly cashflow
- —
- DSCR
- —
- Eligible?
- —
Short-term bridge; refi at stabilization.
Rent comps 24 comps
| Address | Beds | Baths | Sqft | Rent | $/sqft | DOM | Units | Dist |
|---|---|---|---|---|---|---|---|---|
| 12030 Picard Bnd San Antonio, TX | 3.0 | 2.0 | 1450 | $1,495 | $1.03 | 5d | 1 | 0.06mi |
| 12015 Still Pass San Antonio, TX | 4.0 | 2.0 | 1635 | $1,600 | $0.98 | 21d | 1 | 0.07mi |
| 934 Cook Bnd San Antonio, TX | 4.0 | 2.0 | 1627 | $1,445 | $0.89 | 25d | 1 | 0.12mi |
| 742 Haas Way San Antonio, TX | 4.0 | 2.0 | 1699 | $2,100 | $1.24 | 19d | 1 | 0.13mi |
| 12055 Links Pkwy San Antonio, TX | 3.0 | 2.0 | 1479 | $1,625 | $1.10 | 25d | 1 | 0.16mi |
| 718 Albatross Way San Antonio, TX | 3.0 | 2.0 | 1436 | $1,650 | $1.15 | 14d | 1 | 0.21mi |
| 1343 Art Wall Way San Antonio, TX | 3.0 | 2.0 | 1440 | $1,395 | $0.97 | 45d | 1 | 0.28mi |
| 11963 Sand Wedge Way San Antonio, TX | 3.0 | 3.5 | 1474 | $1,575 | $1.07 | 6d | 1 | 0.30mi |
| 13222 Dutra Rd San Antonio, TX | 3.0 | 2.0 | 1266 | $1,595 | $1.26 | 25d | 1 | 0.37mi |
| 1327 Mission Grande Unit 710 San Antonio, TX | 2.0 | 2.0 | 945 | $1,081 | $1.14 | 4d | 1 | 0.40mi |
| 907 Stricker Path San Antonio, TX | 3.0 | 2.0 | 1129 | $1,500 | $1.33 | 25d | 1 | 0.47mi |
| 1019 Magrum Way San Antonio, TX | 3.0 | 2.0 | 1300 | $1,445 | $1.11 | 12d | 1 | 0.49mi |
| 12910 Clubhouse Blvd San Antonio, TX | 1.0–3.0 | 1.0–2.0 | 920 | $1,384 | $1.50 | 3d | 27 | 0.51mi |
| 1038 Janzen Rd San Antonio, TX | 3.0 | 2.0 | 1125 | $1,725 | $1.53 | 23d | 1 | 0.54mi |
| 1115 Janzen Rd San Antonio, TX | 3.0 | 2.0 | 1300 | $1,595 | $1.23 | 45d | 1 | 0.55mi |
| 1019 Snedeker Dr San Antonio, TX | 3.0 | 2.0 | 1200 | $1,449 | $1.21 | 25d | 1 | 0.58mi |
| 13806 S Strange Way San Antonio, TX | 4.0 | 2.0 | 1668 | $1,795 | $1.08 | 25d | 1 | 0.72mi |
| 11426 Four Iron Way San Antonio, TX | 4.0 | 2.5 | 1814 | $1,695 | $0.93 | 6d | 1 | 0.75mi |
| 2203 Cielo Rio, Lot 102 San Antonio, TX | 2.0–4.0 | 2.0–2.5 | 1574 | $2,360 | $1.50 | 0d | 150 | 0.85mi |
| 1119 Jordan Xing San Antonio, TX | 3.0 | 2.0 | 1276 | $1,795 | $1.41 | 45d | 1 | 0.85mi |
| 1003 Beck Rd San Antonio, TX | 3.0 | 2.0 | 1213 | $1,490 | $1.23 | 6d | 1 | 1.00mi |
| 1030 Snedeker DR San Antonio, TX | 4.0 | 2.0 | 1500 | $1,499 | $1.00 | 25d | 1 | 1.00mi |
| 1015 Catalonia Pass San Antonio, TX | 3.0 | 2.0 | 1280 | $1,600 | $1.25 | 6d | 1 | 1.41mi |
| 1011 Catalonia Pass San Antonio, TX | 3.0 | 2.5 | 1470 | $1,700 | $1.16 | 25d | 1 | 1.41mi |
HOA detail
- Monthly dues
- $29 · $348/yr
- Likely covers
- gas
Listing history 16 events
-
2026-06-21days on market $213,000 Active 179 DOM
-
2026-06-18days on market $213,000 Active 176 DOM
-
2026-06-17days on market $213,000 Active 175 DOM
-
2026-06-16days on market $213,000 Active 174 DOM
-
2026-06-15days on market $213,000 Active 173 DOM
-
2026-06-13days on market $213,000 Active 171 DOM
-
2026-06-13days on market $213,000 Active 170 DOM
-
2026-06-09days on market $213,000 Active 167 DOM
-
2026-06-08days on market $213,000 Active 166 DOM
-
2026-06-07days on market $213,000 Active 165 DOM
-
2026-06-04days on market $213,000 Active 162 DOM
-
2026-06-03days on market $213,000 Active 161 DOM
-
2026-06-02days on market $213,000 Active 160 DOM
-
2026-06-01days on market $213,000 Active 159 DOM
-
2026-05-31days on market $213,000 Active 158 DOM
-
2025-12-24$213,000 New 917-char remark
Show marketing remark (917 chars)
Seller is offering concessions! This generous incentive can be applied towards closing costs or to buy down the buyer's interest rate. Welcome to 12047 Overton Way, San Antonio, TX 78221-a charming Cottage Collection home featuring 3 bedrooms, 2 full baths, and 1,266 sq. ft. of efficient living space. The open-concept layout connects the kitchen, dining, and living areas, perfect for everyday living and entertaining. The kitchen offers granite countertops, a gas range, and open sightlines to the dining area. The private primary suite is located at the rear of the home and includes a spacious bath and large walk-in closet. Two secondary bedrooms and a full bath sit toward the front, ideal for guests or a home office. Enjoy added privacy with no rear neighbors and convenient access to nearby parks and the scenic Million Del Lago Golf Course. Low-maintenance living in a quiet, amenity-rich community.
ⓘ Source: listings_history table (triggers on properties + properties_extension) + one-shot
backfill from property_details.listing_events for pre-trigger history.
Tax reassessment forecast TX · Resets to sale price
- Current annual tax
- $4,451 · $371/mo
- Projected year-2 tax
- $4,451 · $371/mo
- Expected delta
- $0/yr ($0/mo · 0.0%)
ⓘ Screening estimate from a state-policy table — verify with the county assessor before closing.
Climate risk First Street
- Flood 1/10 Low FEMA zone X (unshaded) · 0% chance over 30 yrs
- Wildfire 5/10 Major
- Heat 8/10 Severe 6 d/yr ≥109°F today · 19 d/yr by 30 yrs out
- Wind 8/10 Severe 80% chance of damaging wind over 30 yrs
- Air quality 2/10 Low 0 unhealthy d/yr today · 1 by 30 yrs out
Nearby sold comps map
Loading sold comps map…
Walkable amenities ~0.75 mi
Loading nearby amenities…
Taxation est. · year 1
- Rental income
- $19,329
- − Mortgage interest
- −$11,931
- − Property taxes
- −$4,451
- − Insurance
- −$1,065
- − Repairs & maintenance
- −$1,546
- − Management
- −$1,546
- − HOA
- −$348
- − Depreciation
- −$6,196
- Taxable loss
- −$7,755
- Est. tax savings @ 24.0%
- +$1,861
- After-tax cash flow
- $-2,137/yr
For passive investors: Depreciation is non-cash, so a rental often shows a tax loss while cash-flowing — sheltering income. Rental losses are passive: they offset passive income freely, and up to $25,000/yr can offset ordinary (W-2) income if you actively participate and your MAGI is under $100k (phasing out to $0 by $150k); unused losses carry forward. On sale, claimed depreciation is recaptured at up to 25%, and gains may owe capital-gains tax (a 1031 exchange can defer both). Figures are a year-1 estimate at your 24.0% rate — not tax advice; consult a CPA.
Schools (NCES district)
- District
- Southside ISD
- NCES district ID
- 4840920
- Math proficiency
- 16% ▼ -15.00%
- Reading proficiency
- 25% ▼ -2.00%
- Median HH income
- $43,526
- Composite
- 17.68/100
- National rank
- #9027
- State rank
- #771 of 826 in TX
Livability — San Antonio
- Score
- 80/100
- State rank
- #31
- US rank
- #1616
Category grades
Schools grade is shown separately in the Schools card above.
Census & demographics
- Census place
- San Antonio, TX
- County
- Bexar County · 1,990,555 people
- City population
- 1,806,925
- Metro
- San Antonio-New Braunfels, TX
- Population (ZIP)
- 42,178
- Household income
- $63,811
- Rent vs Own
- Severe rent burden
- 1180.0
Population outlook (Bexar County) Hauer SSP2
- Today (2025)
- 2,336,851 people
- By 2030
- 2,560,728 · +9.6%
- By 2040
- 3,020,569 · +29.3%
- By 2050
- 3,493,522 · +49.5%
- By 2075
- 4,668,459 · +99.8%
- By 2100
- 5,533,242 · +136.8%
Race, ethnicity, and origin ACS 2023
- Neighborhood character
- Predominantly Hispanic (89%)
- Race & ethnicity
- Hispanic / Latino 89% Two or more races 28% White 9% Native American 2%
- Hispanic origin (detail)
- Mexican 74%
- Common ancestry
- Lithuanian 1% Romanian 1%
- Foreign-born
- 16% · Canada
- Languages at home
- 45% English-only · Spanish 54%
Political lean MEDSL · Bexar
- 2024 margin
- Lean D (+9.8) · D 54.3% · R 44.6% · Other 1.1%
- 2008→2024 swing
- +4.2pp toward D · 2008: 5.6pp · 2024: 9.8pp
- All cycles
- 2024: D+9.8 2020: D+18.2 2016: D+13.5 2012: D+4.6 2008: D+5.6
Not yet ingested
- Civics
- —
Market trends
- HPI YoY
- ▲ 2.03%
- Current HPI
- 251.1635
- Rent YoY
- ▼ -7.21%
- Metro
- San Antonio-New Braunfels, TX
- State GDP YoY
- ▲ 3.95%
- F500 in state
- 110
Industry mix (Fortune 500 HQ in TX)
| Industry | F500 HQs | Revenue |
|---|---|---|
| Energy | 16 | $1,198B |
|
||
| Technology | 5 | $198B |
|
||
| Engineering / Construction | 4 | $72B |
|
||
| Energy Services | 3 | $60B |
|
||
| Utilities | 3 | $41B |
|
||
| Healthcare | 2 | $330B |
|
||
Price history
1 event — show timeline
- 2025-12-24 Listed $213,000 LERA
Property tax history
+19.8%/yrLatest (2025): $4,451 · -4.5% YoY. Source: county tax records.
Cash-flow waterfall
monthlySold comps — $/sqft
last 12 mo · ≤1 miLoading sold comps…