 Duplex
None · Troy, NY
Flood risk 8/10 · Major
- FEMA flood zone
- X (shaded)
- Chance of flooding over 30 yrs
- 0.78%
- Est. flood insurance / yr
- $473 – $860
Fire risk 4/10 · Minor
- Est. fire insurance / yr
- $691 – $1,283
Heat risk 4/10 · Minor
- Hot days now (above 95°F)
- 7 days/yr
- Hot days in 30 yrs
- 17 days/yr
Wind risk 3/10 · Minor
- Chance of severe wind over 30 yrs
- 6.0%
Air-quality risk 2/10 · Minimal
- Unhealthy air days now
- 0 days/yr
- Unhealthy air days in 30 yrs
- 1 days/yr
Risk factors via First Street. Map © Google.
Why this score? — see what drove the C grade
The composite is a weighted blend of 9 inputs, each scored 0–100. Each bar is that input's sub-score; the figure is the points it added to the 100-point composite (weight × sub-score).
- Cash flow +21.4/30.0
- ARV discount +13.2/15.0
- DSCR +6.8/10.0
- 1% rule +5.6/10.0
- Livability +4.0/5.0
- Schools +2.8/10.0
- Condition / age +2.8/5.0
- Rent growth +2.5/5.0
- Appreciation +0.0/10.0
$249,500
🖨 Deal sheet (PDF) 📄 Offer letter ✓ Due diligence
Multi-family units
County records classify this as Multi-Family (2-4 Unit). Listing-text estimate: 2 units. confirmed
Listing remarks MLS
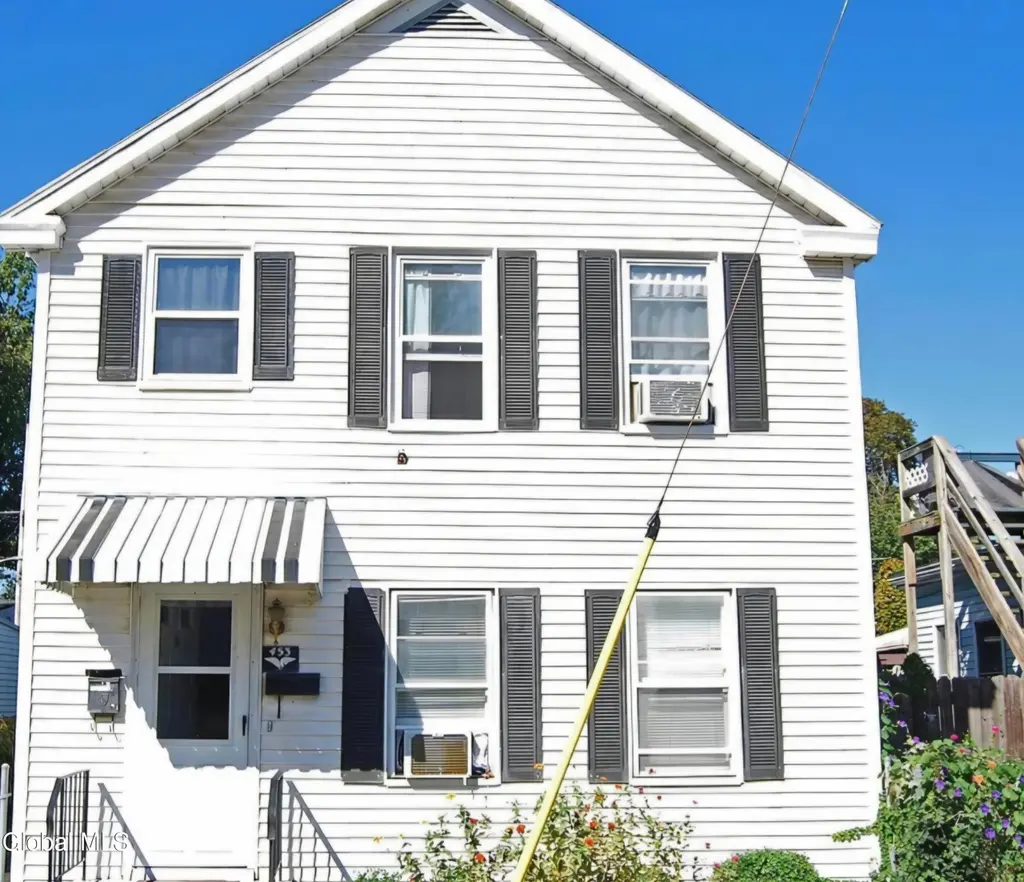
Great investment property, or attractive owner-occupant opportunity. Live in one unit and rent the other. Units separately metered. Cozy two-family that pays for itself! Move-in ready. Each unit has two bedrooms, a full bath and an eat-in kitchen. 1st floor has laundry room; 2nd floor has laundry area. Paddle fans. Recessed lighting. Exterior is low maintenance vinyl siding, with asphalt shingle roof. Fully fenced back yard with large deck. Off-street parking for 3 cars (parking spots could be rented separately). Close to 787, pulic transportation, parks, stores, restaurants and downtown Troy. Deck and most of interior painted recently. New hot-water heater 2026. Shed sold as-is.
Key facts
- Large deck
- Vinyl-sided
- Laundry room
Tags
Neighborhood map
What this means for you Summary
Snapshot
- This is a 2 × 2-bed/1-bath units multifamily listed at $250k. Condition is rated average.
Deal economics
- At list price, monthly cash flow is $316 ($4k/yr) — positive. Per door: $158/mo.
- The deal already cash-flows at list — no discount required.
- Meets the 1% rule at list price ($3k rent vs $250k).
- Recommended offer: $227k (9.0% below list) — sets the bar for market timing.
- Cap rate 8.1% vs local median 5.3% in Troy — top-decile yield for the area; either an underpriced asset or a hidden risk that comps aren't pricing in. Stress-test before assuming the spread holds.
Location & tenants
- Location reads 81/100 on livability (#88 in NY, #1,350 nationally) — a professional / high-income tenant draw. Strengths: amenities A+, commute A+, housing A+; Watch: employment C-, crime F.
- Lansingburgh Central School District (urban): math 31% / reading 35% proficiency, ranked #566 of 590 in NY (top 96%) — families likely to look elsewhere, expect single-tenant / working-renter base with shorter leases.
- Zoned schools: Turnpike Elementary School (534 students, 61% FRL); Knickerbacker Middle School (math 15% / reading 35%, grade F, #601 of 729 statewide, top 82%, 471 students, 75% FRL); Lansingburgh Senior High School (math 92%, 638 students, 75% FRL) — zoned schools average 70% FRL vs 51% district-wide (19 pts higher); higher-poverty schools than district average — tighter screening recommended.
- Market conditions: 76 active listings in the ZIP; 17 comparable units currently listed for rent nearby; rentals at typical pace (median 17d on market — plan ~3-4 weeks tenant-placement turnaround); 405 units permitted in Rensselaer County in 2024 (224 in 5+ unit buildings).
Forward outlook
- Local home prices are declining (-3.0%/yr); year-one equity from $2k of loan paydown is wiped out by about $7k of value loss. Plan a longer hold.
- Rensselaer County population projected to shrink 6% by 2050 — rents likely to lag national; underwrite the cash flow, not the appreciation.
Negotiation context
- It's been on market 101 days — a 9% lower offer ($227k) is reasonable based on typical stale-listing flexibility.
Risks & watch-outs
- Watch-outs: flood insurance adds $56/mo; built in 1890 — expect roof / HVAC / electrical / plumbing capex.
- Climate carrying-cost: severe flood risk — expect insurance premiums to compound above CPI over the hold.
Questions for the listing agent
- It's been on market 101 days. Have you received any prior offers? Is the seller open to a 9% concession, seller financing, or rate buy-down credit?
- Can we see the unit-by-unit rent roll, current vacancy, and any below-market leases? What's the average tenancy length?
- What capital expenditures (roof, boiler, parking lot, exteriors) have been made in the last 5 years, and what's planned in the next 2?
- Built in 1890 — when were the roof, HVAC, electrical panel, plumbing, and water heater last replaced?
- What's the actual annual flood-insurance premium (NFIP or private), and is the property in a SFHA with mandatory coverage?
- Why hasn't it sold? Are there any deal-killer items the seller is aware of (foundation, flood, title, zoning, code violations)?
- Is there a deadline driving the sale (1031 exchange, divorce, estate, relocation)? That informs how much negotiation room exists.
- Crime grade is F in this area — have there been break-ins, vandalism, or insurance claims at this property in the last 3 years? What carrier currently insures it and at what premium?
- What's the average days-on-market for RENTAL listings here right now (not sales)? A rising rental-DOM trend means longer vacancies and softer asking-rent achievability than the comps imply.
- What's the recent tenant-quality profile in this submarket — average credit score on applications, eviction rate, late-payment / NSF rate, and stable-employment percentage? A property-management company in the area should have these aggregated.
- How much new apartment / multifamily construction is in the pipeline within 1–3 miles? Heavy new supply (>2% of stock underway) typically softens rents 12–24 months out; light construction supports rent growth.
Investment metrics
- 1% rule
- 1.06% ✓
- Cap rate
- 8.08%
- Cash-on-cash
- 6.38%
- DSCR
- 1.28
- GRM
- 7.8
CMA / ARV
- ARV (median comp)
- $285,540
- List price
- $249,500
- Delta
- -12.62%
- Verdict
- UNDERPRICED
- Comps
- 20 within 1.0 mi
Show comp detail 7 sales within ~0.75 mi
| Address | Dist | Beds/Ba | Sqft | Sold | Price | $/sf | Match |
|---|---|---|---|---|---|---|---|
| 395 4th Ave | 0.16mi | 4/2.0 | 1,440 (-1%) | 22mo | $215,000 | $149 | 72 |
| 417 7th Ave | 0.21mi | 3/2.0 (-1) | 1,564 (+7%) | 21mo | $111,000 | $71 | 56 |
| 278 3rd Ave | 0.50mi | 4/2.0 | 1,628 (+12%) | 17mo | $190,000 | $117 | 43 |
| 89 Heartt Ave | 0.64mi | 3/2.0 (-1) | 1,584 (+8%) | 14mo | $240,000 | $152 | 40 |
| 660 2nd Ave | 0.57mi | 4/3.0 | 1,584 (+8%) | 21mo | $217,500 | $137 | 38 |
| 98 Hudson Ave | 0.74mi | 4/2.0 | 1,672 (+14%) | 7mo | $230,000 | $138 | 35 |
| 75 Ontario St | 0.56mi | 4/2.0 | 1,672 (+14%) | 19mo | $230,000 | $138 | 34 |
Match score weights: distance 35% · size 25% · config 20% · recency 20%. Top-matched comps best support the ARV.
Projected returns pro-forma
-3.0% appreciation · 3.0% rent growth · sell at horizon
- IRR
- -7.9%
- Equity multiple
- 0.71×
- Total profit
- $-20,224
- Equity at exit
- $37,201
- IRR
- 1.7%
- Equity multiple
- 1.12×
- Total profit
- $8,614
- Equity at exit
- $21,572
Cash invested: $69,860 (down + closing). Projections, not guarantees.
Landlord ↔ Tenant lean methodology
- Overall (STATE)
- 15 Strongly Tenant-Friendly
- State New York
- 15 Strongly Tenant-Friendly · D+10
- County
- — inherits STATE
- City
- — inherits STATE
ZIP-level market 12182
- Home prices YoY
- -15.6%
- Active inventory
- 76
- Price-to-rent
- 15.7×
Monthly cashflow live
- Estimated rent
- $2,653 high interval (Pro) →
- Mortgage (P&I)
- −$1,308
- Tax est. 1.5%
- −$312 /mo · $3,742/yr
- Insurance
- −$104
- Flood insurance flood zone
- −$56 /mo · $666/yr
- HOA
- −$0
- Lot rent
- −$0
- Vacancy / Maint / Mgmt
- −$557
- Net cashflow
- $316
Break-even live
Sensitivity live
| Price | -10% $489 | -5% $402 | +0% $316 | +5% $230 | +10% $144 |
|---|---|---|---|---|---|
| Rent | -10% $107 | -5% $211 | +0% $316 | +5% $421 | +10% $526 |
| Rate | -1.0pp $442 | -0.5pp $380 | base $316 | +0.5pp $251 | +1.0pp $186 |
2-unit breakdown (identical units grouped — click to expand)
| Units | Beds | Baths | Est. rent |
|---|---|---|---|
| 2× units | 2 | 1 | $2,652 |
| #1 | 2 | 1 | $1,326 |
| #2 | 2 | 1 | $1,326 |
| Total (2 units) | $2,653 | ||
UW: 25.0% down · 7.5% · 30yr · 1.5% tax · 5.0% vac · 8.0% maint · 8.0% mgmt
Financing live
Cash to close
- Down payment
- $62,375
- Closing costs
- $7,485
- Reserves months
- —
- Total cash needed
- —
Loan-product check · same deal, 3 products live
Conventional
25% down · 7.5% · 30yr
- Down + closing
- —
- Monthly P&I
- —
- Monthly cashflow
- —
- DSCR
- —
- Eligible?
- —
Personal DTI + credit; lowest rate.
DSCR
20% down · 8.5% · 30yr
- Down + closing
- —
- Monthly P&I
- —
- Monthly cashflow
- —
- DSCR
- —
- Eligible?
- —
No personal income docs; deal must DSCR.
Hard money
10% down · 12.0% · 12mo
- Down + closing
- —
- Monthly P&I
- —
- Monthly cashflow
- —
- DSCR
- —
- Eligible?
- —
Short-term bridge; refi at stabilization.
Rent comps 17 comps
| Address | Beds | Baths | Sqft | Rent | $/sqft | DOM | Units | Dist |
|---|---|---|---|---|---|---|---|---|
| 386 3rd Ave #1 Troy, NY | 3.0 | 1.0 | 1024 | $1,700 | $1.66 | 16d | 1 | 0.20mi |
| 290 2nd Ave Troy, NY | 3.0 | 1.0 | 1400 | $1,600 | $1.14 | 23d | 1 | 0.46mi |
| 53 Park Ave Cohoes, NY | 3.0 | 1.0 | 1875 | $1,600 | $0.85 | 16d | 1 | 0.61mi |
| 21 120th St Troy, NY | 4.0 | 1.0 | 1200 | $1,300 | $1.08 | 23d | 1 | 0.75mi |
| 750 2nd Ave Troy, NY | 1.0–3.0 | 1.0–1.5 | 1185 | $1,711 | $1.44 | 16d | 1 | 0.78mi |
| 157 6th Ave Unit 2 Troy, NY | 3.0 | 1.0 | 1300 | $1,350 | $1.04 | 21d | 1 | 0.84mi |
| 140 5th Ave Unit 2 Troy, NY | 3.0 | 1.0 | 1200 | $1,395 | $1.16 | 25d | 1 | 0.88mi |
| 131 6th Ave Troy, NY | 4.0 | 1.0 | 1400 | $2,325 | $1.66 | 16d | 1 | 0.91mi |
| 192 Saratoga St Cohoes, NY | 1.0–3.0 | 1.0–3.0 | 1157 | $2,600 | $2.25 | 16d | 4 | 1.10mi |
| 338 Saratoga St Unit 2 Cohoes, NY | 3.0 | 1.5 | 1200 | $1,495 | $1.25 | 46d | 1 | 1.20mi |
| 12 White St Cohoes, NY | 3.0 | 2.0 | 1790 | $2,895 | $1.62 | 21d | 1 | 1.21mi |
| 159 Main St #2 Cohoes, NY | 3.0 | 1.0 | 950 | $1,295 | $1.36 | 16d | 1 | 1.22mi |
| 53 Main St Unit 3 Cohoes, NY | 3.0 | 1.0 | 1200 | $1,345 | $1.12 | 25d | 1 | 1.26mi |
| 300 Ontario St Cohoes, NY | 3.0 | 1.0 | 1100 | $1,600 | $1.45 | 16d | 1 | 1.29mi |
| 143 President St Unit 2 Troy, NY | 4.0 | 1.0 | 1200 | $1,900 | $1.58 | 16d | 1 | 1.38mi |
| 3132-3134 6th Ave Troy, NY | 3.0 | 1.0 | 950 | $1,350 | $1.42 | 16d | 1 | 1.43mi |
| 121 Columbia Gdns Cohoes, NY | 1.0–3.0 | 1.0–2.0 | 863 | $2,294 | $2.66 | 16d | 7 | 1.47mi |
Listing history 17 events
-
2026-06-22days on market $249,500 Active 101 DOM
-
2026-06-18days on market $249,500 Active 98 DOM
-
2026-06-17days on market $249,500 Active 97 DOM
-
2026-06-16days on market $249,500 Active 96 DOM
-
2026-06-15days on market $249,500 Active 95 DOM
-
2026-06-14days on market $249,500 Active 93 DOM
-
2026-06-10days on market $249,500 Active 90 DOM
-
2026-06-09days on market $249,500 Active 89 DOM
-
2026-06-08days on market $249,500 Active 88 DOM
-
2026-06-07days on market $249,500 Active 87 DOM
-
2026-06-05days on market $249,500 Active 84 DOM
-
2026-06-03days on market $249,500 Active 83 DOM
-
2026-06-02days on market $249,500 Active 82 DOM
-
2026-06-01days on market $249,500 Active 81 DOM
-
2026-05-31days on market $249,500 Active 80 DOM
-
2026-05-31days on market $249,500 Active 79 DOM
-
2026-03-12$249,500 Active 688-char remark
Show marketing remark (688 chars)
Great investment property, or attractive owner-occupant opportunity. Live in one unit and rent the other. Units separately metered. Cozy two-family that pays for itself! Move-in ready. Each unit has two bedrooms, a full bath and an eat-in kitchen. 1st floor has laundry room; 2nd floor has laundry area. Paddle fans. Recessed lighting. Exterior is low maintenance vinyl siding, with asphalt shingle roof. Fully fenced back yard with large deck. Off-street parking for 3 cars (parking spots could be rented separately). Close to 787, pulic transportation, parks, stores, restaurants and downtown Troy. Deck and most of interior painted recently. New hot-water heater 2026. Shed sold as-is.
ⓘ Source: listings_history table (triggers on properties + properties_extension) + one-shot
backfill from property_details.listing_events for pre-trigger history.
Climate risk First Street
- Flood 8/10 Severe FEMA zone X (shaded) · 78% chance over 30 yrs
- Wildfire 4/10 Moderate
- Heat 4/10 Moderate 7 d/yr ≥95°F today · 17 d/yr by 30 yrs out
- Wind 3/10 Moderate 6% chance of damaging wind over 30 yrs
- Air quality 2/10 Low 0 unhealthy d/yr today · 1 by 30 yrs out
Nearby sold comps map
Loading sold comps map…
Walkable amenities ~0.75 mi
Loading nearby amenities…
Taxation est. · year 1
- Rental income
- $31,836
- − Mortgage interest
- −$13,976
- − Property taxes
- −$3,742
- − Insurance
- −$1,914
- − Repairs & maintenance
- −$2,547
- − Management
- −$2,547
- − Depreciation
- −$7,258
- Taxable loss
- −$148
- Est. tax savings @ 24.0%
- +$36
- After-tax cash flow
- $3,829/yr
For passive investors: Depreciation is non-cash, so a rental often shows a tax loss while cash-flowing — sheltering income. Rental losses are passive: they offset passive income freely, and up to $25,000/yr can offset ordinary (W-2) income if you actively participate and your MAGI is under $100k (phasing out to $0 by $150k); unused losses carry forward. On sale, claimed depreciation is recaptured at up to 25%, and gains may owe capital-gains tax (a 1031 exchange can defer both). Figures are a year-1 estimate at your 24.0% rate — not tax advice; consult a CPA.
Condition & rehab AI · 11 photos
This two-family home is move-in ready with recent updates to the exterior and interior. It requires some cosmetic updates to the kitchen and bathrooms to maximize its resale and rental value.
Repairs flagged
- Moderate kitchen cabinets — dated and worn
- Moderate kitchen appliances — dated and worn
- Moderate kitchen flooring — dated and worn
- Moderate bathroom tile — dated and worn
- Minor interior paint — some wear
Value-add opportunities
- Both paint interior walls — Fresh paint enhances curb appeal and interior aesthetics
- Both replace kitchen cabinets and appliances — Modern kitchen will attract more buyers/renters
- Both update bathroom tile — Fresh tile will improve the bathroom's appearance and functionality
Renovation cost estimate screening
| Repair item | Severity | Est. cost |
|---|---|---|
| kitchen cabinets · dated and worn | Moderate | $3,000–15,000 |
| kitchen appliances · dated and worn | Moderate | $3,000–15,000 |
| kitchen flooring · dated and worn | Moderate | $3,000–15,000 |
| bathroom tile · dated and worn | Moderate | $3,000–15,000 |
| interior paint · some wear | Minor | $500–3,000 |
| Total estimated repair cost · 5 items | $12,500–63,000 |
Value-add ROI direction
- Both paint interior walls — Fresh paint enhances curb appeal and interior aesthetics ↑
- Both replace kitchen cabinets and appliances — Modern kitchen will attract more buyers/renters ↑
- Both update bathroom tile — Fresh tile will improve the bathroom's appearance and functionality ↑
ⓘ Cost ranges are severity-bucket heuristics (US national rule-of-thumb). Get contractor quotes + a written scope before underwriting a rehab budget.
Schools (NCES district)
- District
- Lansingburgh Central School District
- NCES district ID
- 3616740
- Math proficiency
- 31% ▼ -7.00%
- Reading proficiency
- 35% ▼ -6.00%
- Median HH income
- $44,807
- Composite
- 28.19/100
- National rank
- #6810
- State rank
- #566 of 590 in NY
Livability — Troy
- Score
- 81/100
- State rank
- #88
- US rank
- #1350
Category grades
Schools grade is shown separately in the Schools card above.
Census & demographics
- Census place
- Troy, NY
- City population
- 53,479
- Population (ZIP)
- 14,273
Population outlook (Rensselaer County) Hauer SSP2
- Today (2025)
- 162,400 people
- By 2030
- 161,746 · -0.4%
- By 2040
- 158,095 · -2.7%
- By 2050
- 152,966 · -5.8%
- By 2075
- 140,767 · -13.3%
- By 2100
- 124,727 · -23.2%
Race, ethnicity, and origin ACS 2023
- Neighborhood character
- Predominantly White (70%)
- Race & ethnicity
- White 70% Black 14% Two or more races 12% Hispanic / Latino 7%
- Hispanic origin (detail)
- Puerto Rican 6%
- Common ancestry
- Lithuanian 7% Romanian 3% Iranian 1%
- Foreign-born
- 3% · Canada, Jamaica
- Languages at home
- 94% English-only · Spanish 4% Other Indo-European 1%
Political lean MEDSL · Rensselaer
- 2024 margin
- Toss-up / Even · D 50.7% · R 49.3%
- 2008→2024 swing
- -8.0pp toward R · 2008: 9.3pp · 2024: 1.4pp
- All cycles
- 2024: D+1.4 2020: D+5.6 2016: R+2.9 2012: D+11.8 2008: D+9.3
Not yet ingested
- Civics
- —
Market trends
- HPI YoY
- ▼ -50.58%
- Current HPI
- 273.5758
- Rent YoY
- —
- Metro
- —
- State GDP YoY
- ▲ 2.60%
- F500 in state
- 92
Industry mix (Fortune 500 HQ in NY)
| Industry | F500 HQs | Revenue |
|---|---|---|
| Financial Services | 10 | $950B |
|
||
| Consumer Goods | 9 | $162B |
|
||
| Insurance | 4 | $225B |
|
||
| Telecommunications | 2 | $144B |
|
||
| Pharmaceuticals | 2 | $112B |
|
||
| Media / Entertainment | 2 | $69B |
|
||
Price history
1 event — show timeline
- 2026-03-12 Listed $249,500 Global MLS
Cash-flow waterfall
monthlySold comps — $/sqft
last 12 mo · ≤1 miLoading sold comps…