 Duplex
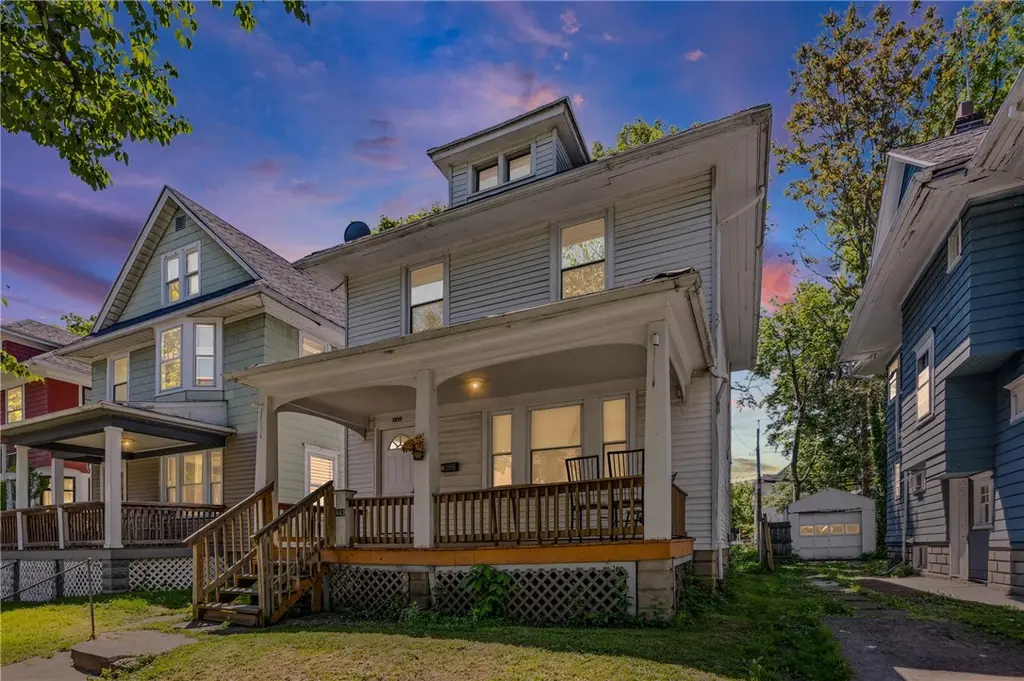
443 Melville St · Rochester, NY
Flood risk 1/10 · Minimal
- FEMA flood zone
- X (unshaded)
- Chance of flooding over 30 yrs
- 0.0%
- Est. flood insurance / yr
- $473 – $860
Fire risk 1/10 · Minimal
- Est. fire insurance / yr
- $691 – $1,283
Heat risk 2/10 · Minimal
- Hot days now (above 95°F)
- 7 days/yr
- Hot days in 30 yrs
- 15 days/yr
Wind risk 1/10 · Minimal
- Chance of severe wind over 30 yrs
- —
Air-quality risk 2/10 · Minimal
- Unhealthy air days now
- 1 days/yr
- Unhealthy air days in 30 yrs
- 2 days/yr
Risk factors via First Street. Map © Google.
Why this score? — see what drove the B- grade
The composite is a weighted blend of 9 inputs, each scored 0–100. Each bar is that input's sub-score; the figure is the points it added to the 100-point composite (weight × sub-score).
- Cash flow +30.0/30.0
- 1% rule +10.0/10.0
- DSCR +10.0/10.0
- ARV discount +4.9/15.0
- Rent growth +4.5/5.0
- Livability +3.8/5.0
- Condition / age +2.5/5.0
- Schools +1.9/10.0
- Appreciation +0.0/10.0
$109,000
🖨 Deal sheet (PDF) 📄 Offer letter ✓ Due diligence
Multi-family units
County records classify this as Multi-Family (2-4 Unit). Listing-text estimate: 2 units. confirmed
Listing remarks MLS
Another Rockin' Rochester Property! Duplex on border of the highly sought after North Winton Village area. One unit occupied (pays $600 and is current), one vacant (projected rent $700). Potential gross annual income of $15,600. Vacant unit needs a little lipstick before the next tenant moves in. Price reflects condition. Separate utilities. One newer furnace and 2 newer hot water tanks (2017), one older furnace. One new electric panel. Many thermopane windows, hardwood floors. Open front porch. Nice rear yard. Last C of O was issued in 2019. No longer transferable. Block foundation.
Key facts
- Separate utilities
- Income potential
- Updated duplex
Tags
Property features AI
Finance
- Other: Operating expense details: see remarks
- Financial info: Owner pays grounds care, trash collection, and water; Rent includes gardener, trash collection, and water; Two rental units with current rents: one at $850 (month-to-month), one at $1,100
Exterior
- Parking: No driveway; on-street parking
- Utilities: Public water connected; Sewer connected; Electric with circuit breakers
- Home design: 2-story residential building; Residential 2-unit zoning; Entry level features varied
- Construction: Aluminum siding; Wood siding; Blown-in insulation; Block foundation; Asphalt pitched roof; Copper plumbing; Built existing (year built details: existing)
- Exterior features: Balcony; Deck; Porch
Interior
- Kitchen: Oven/Range (in each unit); Refrigerator (in at least one unit)
- Bedrooms: Two 1-bedroom units (each unit has 1 bedroom)
- Flooring: Hardwood; Laminate; Tile; Varies
- Bathrooms: Two full bathrooms (one in each unit)
- Heating & cooling: Gas forced-air heating
- Interior features: Thermal windows; Natural woodwork; Programmable thermostat
- Laundry & utility: Gas water heater; Separate gas meters (2); Separate electric meters (2)
Neighborhood map
What this means for you Summary
Snapshot
- This is a 2 × 2-bed/1.0-bath units multifamily listed at $109k.
Deal economics
- At list price, monthly cash flow is $1k ($15k/yr) — positive. Per door: $619/mo.
- The deal already cash-flows at list — no discount required.
- Meets the 1% rule at list price ($2k rent vs $109k).
- Cap rate 19.9% vs local median 9.3% in Rochester — top-decile yield for the area; either an underpriced asset or a hidden risk that comps aren't pricing in. Stress-test before assuming the spread holds.
Location & tenants
- Location reads 76/100 on livability (#222 in NY, #3,482 nationally) — a middle-class / working-renter tenant base. Strengths: commute A+, cost of living A+, housing A+; Watch: crime F, employment F.
- Rochester City School District (urban): math 21% / reading 26% proficiency, ranked #589 of 590 in NY (top 100%) — low school quality limits family demand, transient renter base, plan for 1-2y turnover; 82% free/reduced lunch — lower-income household profile, screen leases tightly.
- Zoned schools: School 33-John James Audubon (math 2% / reading 17%, grade F, #2,075 of 2,108 statewide, top 99%, 963 students, 93% FRL); East Lower School (math 2% / reading 22%, grade F, #715 of 729 statewide, top 98%, 304 students, 86% FRL); Edison Career And Technology High School (math 44% / reading 50%, grade D-, #1,007 of 1,100 statewide, top 93%, 1,233 students, 91% FRL).
- Market conditions: Rents rising fast (+7.9%/yr); 200 active listings in the ZIP; 25 comparable units currently listed for rent nearby; rentals at typical pace (median 24d on market — plan ~3-4 weeks tenant-placement turnaround); 1,169 units permitted in Monroe County in 2024 (591 in 5+ unit buildings).
- At $2,449/mo this rent would consume 45% of the median local household income ($65k/yr) (locally 2183% of renters already pay >50% of income on rent) — very limited rent-growth headroom before tenants either downsize or default.
Forward outlook
- Local home prices are declining (-3.0%/yr); year-one equity from $754 of loan paydown is wiped out by about $3k of value loss. Plan a longer hold.
- Monroe County population projected to shrink 6% by 2050 — rents likely to lag national; underwrite the cash flow, not the appreciation.
- At projected returns (-3.0% appreciation + 7.9% rent growth), your $31k cash investment doubles in ~3 years — after that, you're playing with house money.
Negotiation context
- Only 6 days on market — expect competitive offers; lowballing is unlikely to land.
- 4 sale attempts since 11y ago with the ask held roughly flat each time — persistent listings suggest the price (not the market) is what's stuck; bring a comps-based counter.
- Current owner paid $61k; list at $109k implies a 79% gain — meaningful room to come down on a strong offer.
Risks & watch-outs
- Watch-outs: built in 1920 — expect roof / HVAC / electrical / plumbing capex.
Questions for the listing agent
- Can we see the unit-by-unit rent roll, current vacancy, and any below-market leases? What's the average tenancy length?
- What capital expenditures (roof, boiler, parking lot, exteriors) have been made in the last 5 years, and what's planned in the next 2?
- Built in 1920 — when were the roof, HVAC, electrical panel, plumbing, and water heater last replaced?
- Is there a deadline driving the sale (1031 exchange, divorce, estate, relocation)? That informs how much negotiation room exists.
- Schools are D-rated, which usually means shorter tenancies and higher turnover. Who's the typical renter profile here, and what's been the actual vacancy rate?
- Crime grade is F in this area — have there been break-ins, vandalism, or insurance claims at this property in the last 3 years? What carrier currently insures it and at what premium?
- What's the average days-on-market for RENTAL listings here right now (not sales)? A rising rental-DOM trend means longer vacancies and softer asking-rent achievability than the comps imply.
- What's the recent tenant-quality profile in this submarket — average credit score on applications, eviction rate, late-payment / NSF rate, and stable-employment percentage? A property-management company in the area should have these aggregated.
- How much new apartment / multifamily construction is in the pipeline within 1–3 miles? Heavy new supply (>2% of stock underway) typically softens rents 12–24 months out; light construction supports rent growth.
Investment metrics
- 1% rule
- 2.25% ✓
- Cap rate
- 19.92%
- Cash-on-cash
- 48.68%
- DSCR
- 3.17
- GRM
- 3.7
CMA / ARV
- ARV (on-the-fly)
- $103,016
- Comps found
- 3
Show comp detail 3 sales within ~0.75 mi
| Address | Dist | Beds/Ba | Sqft | Sold | Price | $/sf | Match |
|---|---|---|---|---|---|---|---|
| 482 Melville St | 0.06mi | 3/2.0 (+1) | 1,416 (+9%) | 24mo | $112,000 | $79 | 58 |
| 816 Atlantic Ave | 0.70mi | 2/2.0 | 1,310 (+0%) | 12mo | $225,000 | $172 | 57 |
| 35 Cummings St | 0.62mi | 3/2.0 (+1) | 1,200 (-8%) | 21mo | $80,000 | $67 | 35 |
Match score weights: distance 35% · size 25% · config 20% · recency 20%. Top-matched comps best support the ARV.
Projected returns pro-forma
-3.0% appreciation · 7.89% rent growth · sell at horizon
- IRR
- 51.5%
- Equity multiple
- 3.42×
- Total profit
- $73,836
- Equity at exit
- $16,252
- IRR
- 58.8%
- Equity multiple
- 8.32×
- Total profit
- $223,254
- Equity at exit
- $9,424
Cash invested: $30,520 (down + closing). Projections, not guarantees.
Landlord ↔ Tenant lean methodology
- Overall (STATE)
- 15 Strongly Tenant-Friendly
- State New York
- 15 Strongly Tenant-Friendly · D+10
- County
- — inherits STATE
- City
- — inherits STATE
ZIP-level market 14609
- Home prices YoY
- -30.4%
- Rents YoY
- 7.9%
- Active inventory
- 200
- Price-to-rent
- 7.4×
Monthly cashflow live
- Estimated rent
- $2,449 high interval (Pro) →
- Mortgage (P&I)
- −$572
- Tax from tax record
- −$80 /mo · $955/yr
- Insurance
- −$45
- HOA
- −$0
- Lot rent
- −$0
- Vacancy / Maint / Mgmt
- −$514
- Net cashflow
- $1,238
Break-even live
Sensitivity live
| Price | -10% $1,300 | -5% $1,269 | +0% $1,238 | +5% $1,207 | +10% $1,176 |
|---|---|---|---|---|---|
| Rent | -10% $1,045 | -5% $1,141 | +0% $1,238 | +5% $1,335 | +10% $1,432 |
| Rate | -1.0pp $1,293 | -0.5pp $1,266 | base $1,238 | +0.5pp $1,210 | +1.0pp $1,181 |
2-unit breakdown (identical units grouped — click to expand)
| Units | Beds | Baths | Est. rent |
|---|---|---|---|
| 2× units | 2 | 1 | $2,450 |
| #1 | 2 | 1 | $1,225 |
| #2 | 2 | 1 | $1,225 |
| Total (2 units) | $2,449 | ||
UW: 25.0% down · 7.5% · 30yr · 1.5% tax · 5.0% vac · 8.0% maint · 8.0% mgmt
Financing live
Cash to close
- Down payment
- $27,250
- Closing costs
- $3,270
- Reserves months
- —
- Total cash needed
- —
Loan-product check · same deal, 3 products live
Conventional
25% down · 7.5% · 30yr
- Down + closing
- —
- Monthly P&I
- —
- Monthly cashflow
- —
- DSCR
- —
- Eligible?
- —
Personal DTI + credit; lowest rate.
DSCR
20% down · 8.5% · 30yr
- Down + closing
- —
- Monthly P&I
- —
- Monthly cashflow
- —
- DSCR
- —
- Eligible?
- —
No personal income docs; deal must DSCR.
Hard money
10% down · 12.0% · 12mo
- Down + closing
- —
- Monthly P&I
- —
- Monthly cashflow
- —
- DSCR
- —
- Eligible?
- —
Short-term bridge; refi at stabilization.
Rent comps 25 comps
| Address | Beds | Baths | Sqft | Rent | $/sqft | DOM | Units | Dist |
|---|---|---|---|---|---|---|---|---|
| 1159 Culver Rd Unit A2 UP Rochester, NY | 3.0 | 1.0 | 1313 | $1,500 | $1.14 | 46d | 1 | 0.11mi |
| 459-461 Parsells Ave Rochester, NY | 2.0 | 1.0 | 1053 | $1,450 | $1.38 | 26d | 1 | 0.12mi |
| 420 Rosewood Ter Rochester, NY | 3.0 | 1.0 | 1246 | $1,300 | $1.04 | 5d | 1 | 0.13mi |
| 1079 Garson Ave Rochester, NY | 3.0 | 1.5 | 1273 | $2,100 | $1.65 | 13d | 1 | 0.47mi |
| 182 Laurelton Rd Unit 182 Rochester, NY | 2.0 | 1.5 | 1000 | $1,600 | $1.60 | 13d | 1 | 0.48mi |
| 322 Wisconsin St Rochester, NY | 2.0 | 1.0 | 1100 | $1,200 | $1.09 | 23d | 1 | 0.51mi |
| 126 Parsells Ave Rochester, NY | 3.0 | 1.0 | 1574 | $1,800 | $1.14 | 46d | 1 | 0.55mi |
| 126 Parsells Ave Rochester, NY | 3.0 | 1.0 | 1574 | $1,800 | $1.14 | 23d | 1 | 0.55mi |
| 222 Ellison St Rochester, NY | 2.0 | 1.0 | 971 | $1,000 | $1.03 | 16d | 1 | 0.57mi |
| 86-88 Baycliff Dr Unit 86 Rochester, NY | 2.0 | 1.0 | 900 | $1,030 | $1.14 | 23d | 1 | 0.66mi |
| 108 Bowman St Unit 1 Rochester, NY | 3.0 | 1.0 | 1200 | $1,600 | $1.33 | 46d | 1 | 0.66mi |
| 1890 Clifford Ave Rochester, NY | 3.0 | 1.0 | 936 | $1,800 | $1.92 | 26d | 1 | 0.70mi |
| 36 Charwood Cir Irondequoit, NY | 2.0 | 1.0–1.5 | 1000 | $1,675 | $1.68 | 46d | 3 | 1.09mi |
| 36 Charwood Cir Irondequoit, NY | 1.0–2.0 | 1.0–1.5 | 930 | $2,005 | $2.16 | 5d | 9 | 1.09mi |
| 326 Northland Ave Rochester, NY | 3.0 | 1.0 | 1168 | $1,500 | $1.28 | 5d | 1 | 1.12mi |
| 933 University Ave Rochester, NY | 1.0–2.0 | 1.0–2.0 | 1295 | $3,815 | $2.94 | 5d | 12 | 1.14mi |
| — Rochester, NY | 3.0 | 1.0 | 1025 | $1,450 | $1.41 | 46d | 1 | 1.20mi |
| 733 University Ave #3 Rochester, NY | 3.0 | 1.5 | 1400 | $1,850 | $1.32 | 46d | 1 | 1.23mi |
| 21 Rundel Park Unit 2 Rochester, NY | 2.0 | 1.0 | 1250 | $2,099 | $1.68 | 21d | 1 | 1.31mi |
| 1600 East Ave Rochester, NY | 3.0 | 1.0–2.0 | 944 | $2,397 | $2.54 | 5d | 1 | 1.34mi |
| 25 Trust St Rochester, NY | 3.0 | 1.5 | 1003 | $1,600 | $1.60 | 5d | 1 | 1.40mi |
| 15 Vick Park B Unit A Rochester, NY | 2.0 | 1.5 | 1616 | $2,350 | $1.45 | 26d | 1 | 1.41mi |
| 737 East Ave Rochester, NY | 1.0 | 2.0 | 900 | $1,350 | $1.50 | 23d | 1 | 1.43mi |
| 18 Vick Park B Unit B Rochester, NY | 1.0 | 1.0 | 950 | $1,400 | $1.47 | 46d | 1 | 1.44mi |
| 811 Portland Ave Rochester, NY | 2.0 | 1.0 | 1616 | $1,300 | $0.80 | 17d | 1 | 1.50mi |
Listing history 7 events
-
2026-06-13status $109,000 Pending 6 DOM
-
2026-06-10days on market $109,000 Active 6 DOM
-
2026-06-09days on market $109,000 Active 5 DOM
-
2026-06-09days on market $109,000 Active 4 DOM
-
2026-06-07days on market $109,000 Active 3 DOM
-
2026-06-05remarks 693-char remark
-
2026-06-05$109,000 Active 1 DOM
ⓘ Source: listings_history table (triggers on properties + properties_extension) + one-shot
backfill from property_details.listing_events for pre-trigger history.
Tax reassessment forecast NY · Partial reset (capped growth)
- Current annual tax
- $955 · $80/mo
- Projected year-2 tax
- $1,399 · $117/mo
- Expected delta
- +$443/yr (+$37/mo · 46.4%)
ⓘ Screening estimate from a state-policy table — verify with the county assessor before closing.
Climate risk First Street
- Flood 1/10 Low FEMA zone X (unshaded) · 0% chance over 30 yrs
- Wildfire 1/10 Low
- Heat 2/10 Low 7 d/yr ≥95°F today · 15 d/yr by 30 yrs out
- Wind 1/10 Low
- Air quality 2/10 Low 1 unhealthy d/yr today · 2 by 30 yrs out
Nearby sold comps map
Loading sold comps map…
Walkable amenities ~0.75 mi
Loading nearby amenities…
Taxation est. · year 1
- Rental income
- $29,388
- − Mortgage interest
- −$6,106
- − Property taxes
- −$955
- − Insurance
- −$545
- − Repairs & maintenance
- −$2,351
- − Management
- −$2,351
- − Depreciation
- −$3,171
- Taxable income
- $13,909
- Est. tax owed @ 24.0%
- −$3,338
- After-tax cash flow
- $11,519/yr
For passive investors: Depreciation is non-cash, so a rental often shows a tax loss while cash-flowing — sheltering income. Rental losses are passive: they offset passive income freely, and up to $25,000/yr can offset ordinary (W-2) income if you actively participate and your MAGI is under $100k (phasing out to $0 by $150k); unused losses carry forward. On sale, claimed depreciation is recaptured at up to 25%, and gains may owe capital-gains tax (a 1031 exchange can defer both). Figures are a year-1 estimate at your 24.0% rate — not tax advice; consult a CPA.
Schools (NCES district)
- District
- Rochester City School District
- NCES district ID
- 3624750
- Math proficiency
- 21% ▬ 0.00%
- Reading proficiency
- 26% ▲ 4.00%
- Median HH income
- $30,923
- Composite
- 18.98/100
- National rank
- #8850
- State rank
- #589 of 590 in NY
Livability — Rochester
- Score
- 76/100
- State rank
- #222
- US rank
- #3482
Category grades
Schools grade is shown separately in the Schools card above.
Census & demographics
- Census place
- Rochester, NY
- County
- Monroe County · 674,131 people
- City population
- 432,803
- Metro
- Rochester, NY
- Population (ZIP)
- 40,274
- Household income
- $64,603
- Rent vs Own
- Severe rent burden
- 2183.0
Population outlook (Monroe County) Hauer SSP2
- Today (2025)
- 759,460 people
- By 2030
- 757,154 · -0.3%
- By 2040
- 740,644 · -2.5%
- By 2050
- 714,443 · -5.9%
- By 2075
- 645,883 · -15.0%
- By 2100
- 547,084 · -28.0%
Race, ethnicity, and origin ACS 2023
- Neighborhood character
- Diverse neighborhood (Simpson 0.69)
- Race & ethnicity
- White 44% Black 28% Hispanic / Latino 20% Two or more races 10% Asian 2%
- Hispanic origin (detail)
- Puerto Rican 15% Cuban 1% Dominican 1%
- Common ancestry
- Romanian 4% Lithuanian 2% Iranian 1%
- Foreign-born
- 8% · Canada
- Languages at home
- 81% English-only · Spanish 14% Russian/Polish/Slavic 2% Other Indo-European 1%
Political lean MEDSL · Monroe
- 2024 margin
- D (+19.1) · D 59.5% · R 40.5%
- 2008→2024 swing
- +1.4pp toward D · 2008: 17.7pp · 2024: 19.1pp
- All cycles
- 2024: D+19.1 2020: D+21.0 2016: D+14.1 2012: D+17.4 2008: D+17.7
Not yet ingested
- Civics
- —
Market trends
- HPI YoY
- ▼ -143.57%
- Current HPI
- 328.7053
- Rent YoY
- ▲ 7.89%
- Metro
- Rochester, NY
- State GDP YoY
- ▲ 2.60%
- F500 in state
- 92
Industry mix (Fortune 500 HQ in NY)
| Industry | F500 HQs | Revenue |
|---|---|---|
| Financial Services | 10 | $950B |
|
||
| Consumer Goods | 9 | $162B |
|
||
| Insurance | 4 | $225B |
|
||
| Telecommunications | 2 | $144B |
|
||
| Pharmaceuticals | 2 | $112B |
|
||
| Media / Entertainment | 2 | $69B |
|
||
Price history
+447.7% since first listed12 events — show timeline
- 2026-06-04 Listed $109,000 UNYREIS
- 2024-10-23 Listing Removed — UNYREIS
- 2024-09-25 Listed $89,000 UNYREIS
- 2022-12-08 Sold (MLS) $61,000 UNYREIS
- 2022-12-07 Sold (Public Records) $61,000 Public Records
- 2022-11-07 Pending — UNYREIS
- 2022-11-01 Listed $50,000 UNYREIS
- 2019-02-05 Sold (Public Records) $39,000 Public Records
- 2015-08-25 Sold (Public Records) $16,750 Public Records
- 2015-08-25 Sold (MLS) $16,750 UNYREIS
- 2015-07-29 Pending — UNYREIS
- 2015-07-19 Listed $19,900 UNYREIS
Property tax history
+1.5%/yrLatest (2025): $955 · +2.1% YoY. Source: county tax records.
Cash-flow waterfall
monthlySold comps — $/sqft
last 12 mo · ≤1 miLoading sold comps…