 Triplex
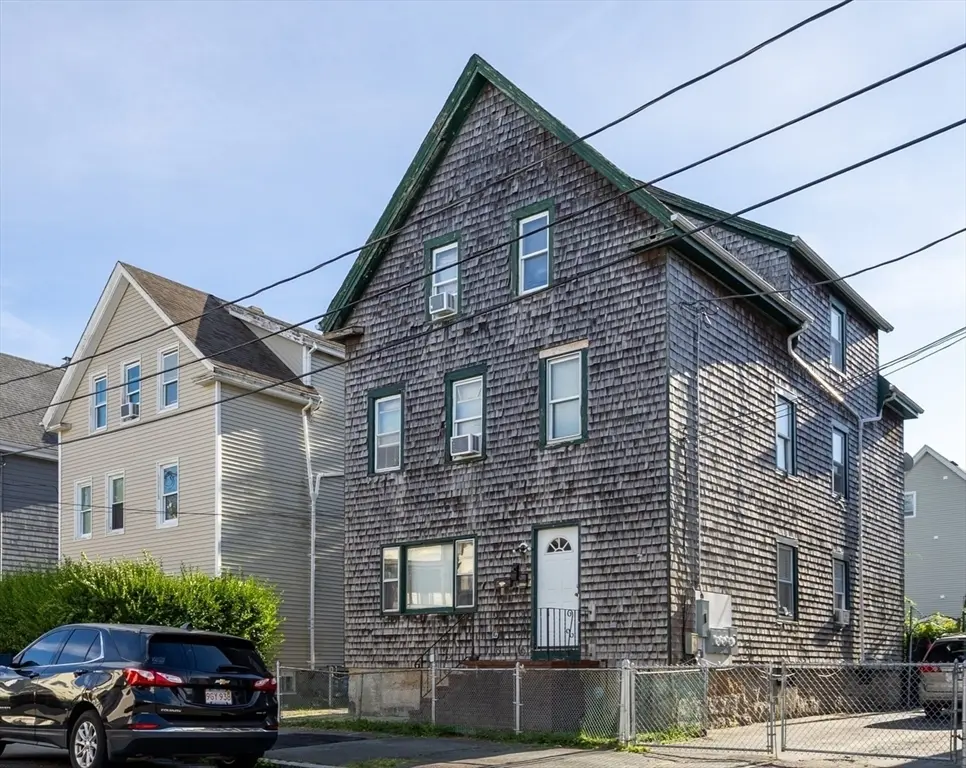
9 Abbott St · New Bedford, MA
Flood risk 5/10 · Moderate
- FEMA flood zone
- X
- Chance of flooding over 30 yrs
- 0.13%
- Est. flood insurance / yr
- $473 – $860
Fire risk 1/10 · Minimal
- Est. fire insurance / yr
- $915 – $1,699
Heat risk 5/10 · Moderate
- Hot days now (above 94°F)
- 7 days/yr
- Hot days in 30 yrs
- 16 days/yr
Wind risk 8/10 · Major
- Chance of severe wind over 30 yrs
- 80.0%
Air-quality risk 2/10 · Minimal
- Unhealthy air days now
- 1 days/yr
- Unhealthy air days in 30 yrs
- 2 days/yr
Risk factors via First Street. Map © Google.
Why this score? — see what drove the C+ grade
The composite is a weighted blend of 9 inputs, each scored 0–100. Each bar is that input's sub-score; the figure is the points it added to the 100-point composite (weight × sub-score).
- Cash flow +22.4/30.0
- ARV discount +9.8/15.0
- Appreciation +8.3/10.0
- DSCR +7.2/10.0
- 1% rule +5.1/10.0
- Livability +3.4/5.0
- Rent growth +2.5/5.0
- Condition / age +2.5/5.0
- Schools +1.9/10.0
$475,000
🖨 Deal sheet (PDF) 📄 Offer letter ✓ Due diligence
Multi-family units
County records classify this as Multi-Family (2-4 Unit). Listing-text estimate: 3 units. confirmed
Listing remarks MLS
Attention investors! This rare 3-unit multifamily offers significant upside potential in a desirable location near the Cove. Each unit features 2 bedrooms and 1 bathroom with separate gas and electric meters, giving tenants independence while simplifying ownership. Currently occupied by long-term tenants-at-will.The property is generating stable income with undermarket rents, allowing for immediate value-add through strategic rent adjustments.The building has deferred maintenance, which creates the perfect chance to Renovate, Rebrand, and Reposition for maximum returns. Situated on a quiet street with easy access to the Covewalk and hurricane barriers, this property also benefits from proximity to public transportation, restaurants, banks, and everyday conveniences—a highly attractive location for current and future renters.
Key facts
- Proximity to banks
- 3 unit multifamily
- 3,202 sq ft lot
Tags
Neighborhood map
What this means for you Summary
Snapshot
- This is a 3 × 2-bed/1.0-bath units multifamily listed at $475k.
Deal economics
- At list price, monthly cash flow is $790 ($9k/yr) — positive. Per door: $263/mo.
- The deal already cash-flows at list — no discount required.
- Meets the 1% rule at list price ($5k rent vs $475k).
- Recommended offer: $418k (12.0% below list) — sets the bar for market timing.
Location & tenants
- Location reads 67/100 on livability (#155 in MA) — a middle-class / working-renter tenant base. Strengths: health & safety A+, housing B+; Watch: cost of living C-, employment D, amenities F.
- New Bedford (suburban): math 17% / reading 28% proficiency, ranked #287 of 302 in MA (top 95%) — low school quality limits family demand, transient renter base, plan for 1-2y turnover; 65% free/reduced lunch — lower-income household profile, screen leases tightly.
- Zoned schools: Irwin M. Jacobs Elementary School (math 8% / reading 22%, grade F, #854 of 938 statewide, top 93%, 403 students, 0% FRL); Roosevelt Middle School (math 11% / reading 20%, grade F, #273 of 305 statewide, top 89%, 778 students, 0% FRL); New Bedford High (math 13% / reading 25%, grade F, #313 of 343 statewide, top 92%, 2,898 students, 0% FRL) — zoned schools average 0% FRL vs 65% district-wide (65 pts lower); this property's tenant base skews higher-income than the district average.
- Market conditions: 24 active listings in the ZIP; 760 units permitted in Bristol County in 2024 (142 in 5+ unit buildings).
Forward outlook
- In year one you build about $35k of equity ($3k loan paydown + $32k appreciation (6.7% local appreciation)).
- Bristol County population projected to shrink 3% by 2050 — rents likely to lag national; underwrite the cash flow, not the appreciation.
- At projected returns (6.7% appreciation + 3.0% rent growth), your $133k cash investment doubles in ~3 years — after that, you're playing with house money.
- By year 2, paydown + projected appreciation supports a ~$56k cash-out refi (75% LTV) — recoverable capital for the next deal without selling this one.
Negotiation context
- It's been on market 284 days — a 12% lower offer ($418k) is reasonable based on typical stale-listing flexibility.
- 3 sale attempts since 7y ago with the ask held roughly flat each time — persistent listings suggest the price (not the market) is what's stuck; bring a comps-based counter.
- Current owner paid $123k; list at $475k implies a 286% gain — meaningful room to come down on a strong offer.
Risks & watch-outs
- Watch-outs: built in 1896 — expect roof / HVAC / electrical / plumbing capex.
- Climate carrying-cost: moderate flood risk; severe wind risk, 80% chance of damaging wind over 30y; extreme-heat days projected 7→16/yr by 2055 (HVAC capex compounding) — expect insurance premiums to compound above CPI over the hold.
Questions for the listing agent
- It's been on market 284 days. Have you received any prior offers? Is the seller open to a 12% concession, seller financing, or rate buy-down credit?
- Can we see the unit-by-unit rent roll, current vacancy, and any below-market leases? What's the average tenancy length?
- What capital expenditures (roof, boiler, parking lot, exteriors) have been made in the last 5 years, and what's planned in the next 2?
- Built in 1896 — when were the roof, HVAC, electrical panel, plumbing, and water heater last replaced?
- Why hasn't it sold? Are there any deal-killer items the seller is aware of (foundation, flood, title, zoning, code violations)?
- Is there a deadline driving the sale (1031 exchange, divorce, estate, relocation)? That informs how much negotiation room exists.
- Schools are D-rated, which usually means shorter tenancies and higher turnover. Who's the typical renter profile here, and what's been the actual vacancy rate?
- What's the average days-on-market for RENTAL listings here right now (not sales)? A rising rental-DOM trend means longer vacancies and softer asking-rent achievability than the comps imply.
- What's the recent tenant-quality profile in this submarket — average credit score on applications, eviction rate, late-payment / NSF rate, and stable-employment percentage? A property-management company in the area should have these aggregated.
- How much new apartment / multifamily construction is in the pipeline within 1–3 miles? Heavy new supply (>2% of stock underway) typically softens rents 12–24 months out; light construction supports rent growth.
Investment metrics
- 1% rule
- 1.01% ✓
- Cap rate
- 8.29%
- Cash-on-cash
- 7.13%
- DSCR
- 1.32
- GRM
- 8.2
CMA / ARV
- ARV (median comp)
- $500,013
- List price
- $475,000
- Delta
- -5.00%
- Verdict
- FAIR
- Comps
- 20 within 1.0 mi
Show comp detail 12 sales within ~0.75 mi
| Address | Dist | Beds/Ba | Sqft | Sold | Price | $/sf | Match |
|---|---|---|---|---|---|---|---|
| 1743 E Rodney French Blvd | 0.10mi | 6/3.0 | 2,618 (+1%) | 20mo | $510,000 | $195 | 78 |
| 8 Mcgurk St | 0.22mi | 6/3.0 | 2,628 (+1%) | 16mo | $540,000 | $205 | 74 |
| 84 Frederick St | 0.47mi | 6/2.5 | 2,660 (+2%) | 10mo | $630,000 | $237 | 64 |
| 141 Butler St | 0.58mi | 6/2.0 | 2,582 (-1%) | 7mo | $595,000 | $230 | 62 |
| 11 Harmony St | 0.29mi | 6/3.0 | 2,404 (-8%) | 23mo | $550,000 | $229 | 55 |
| 119 Division St | 0.55mi | 6/3.0 | 2,828 (+9%) | 11mo | $565,000 | $200 | 51 |
| 150-152 Butler St | 0.60mi | 6/2.0 | 2,586 (-1%) | 22mo | $496,000 | $192 | 49 |
| 81 Willard St | 0.52mi | 6/2.0 | 2,356 (-10%) | 12mo | $562,000 | $239 | 46 |
| 36 Clara St | 0.57mi | 5/4.0 (-1) | 2,592 (-0%) | 22mo | $635,000 | $245 | 46 |
| 22 Jouvette St | 0.52mi | 6/3.0 | 2,941 (+13%) | 21mo | $450,000 | $153 | 37 |
| 76 Acushnet Ave | 0.66mi | 6/3.0 | 2,322 (-11%) | 23mo | $460,000 | $198 | 32 |
| 158 Crapo St | 0.69mi | 6/4.0 | 2,314 (-11%) | 24mo | $540,000 | $233 | 26 |
Match score weights: distance 35% · size 25% · config 20% · recency 20%. Top-matched comps best support the ARV.
Projected returns pro-forma
6.66% appreciation · 3.0% rent growth · sell at horizon
- IRR
- 22.6%
- Equity multiple
- 2.55×
- Total profit
- $206,105
- Equity at exit
- $318,540
- IRR
- 21.2%
- Equity multiple
- 5.23×
- Total profit
- $562,456
- Equity at exit
- $595,699
Cash invested: $133,000 (down + closing). Projections, not guarantees.
Landlord ↔ Tenant lean methodology
- Overall (STATE)
- 20 Strongly Tenant-Friendly
- State Massachusetts
- 20 Strongly Tenant-Friendly · D+15
- County
- — inherits STATE
- City
- — inherits STATE
ZIP-level market 02744
- Home prices YoY
- 1.6%
- Active inventory
- 24
- Price-to-rent
- 24.7×
Monthly cashflow live
- Estimated rent
- $4,803 high interval (Pro) →
- Mortgage (P&I)
- −$2,491
- Tax from tax record
- −$315 /mo · $3,785/yr
- Insurance
- −$198
- HOA
- −$0
- Vacancy / Maint / Mgmt
- −$1,009
- Net cashflow
- $790
Break-even live
Sensitivity live
| Price | -10% $1,059 | -5% $925 | +0% $790 | +5% $656 | +10% $521 |
|---|---|---|---|---|---|
| Rent | -10% $411 | -5% $600 | +0% $790 | +5% $980 | +10% $1,170 |
| Rate | -1.0pp $1,029 | -0.5pp $911 | base $790 | +0.5pp $667 | +1.0pp $542 |
3-unit breakdown (identical units grouped — click to expand)
| Units | Beds | Baths | Est. rent |
|---|---|---|---|
| 3× units | 2 | 1 | $4,803 |
| #1 | 2 | 1 | $1,601 |
| #2 | 2 | 1 | $1,601 |
| #3 | 2 | 1 | $1,601 |
| Total (3 units) | $4,803 | ||
UW: 25.0% down · 7.5% · 30yr · 1.5% tax · 5.0% vac · 8.0% maint · 8.0% mgmt
Financing live
Cash to close
- Down payment
- $118,750
- Closing costs
- $14,250
- Reserves months
- —
- Total cash needed
- —
Loan-product check · same deal, 3 products live
Conventional
25% down · 7.5% · 30yr
- Down + closing
- —
- Monthly P&I
- —
- Monthly cashflow
- —
- DSCR
- —
- Eligible?
- —
Personal DTI + credit; lowest rate.
DSCR
20% down · 8.5% · 30yr
- Down + closing
- —
- Monthly P&I
- —
- Monthly cashflow
- —
- DSCR
- —
- Eligible?
- —
No personal income docs; deal must DSCR.
Hard money
10% down · 12.0% · 12mo
- Down + closing
- —
- Monthly P&I
- —
- Monthly cashflow
- —
- DSCR
- —
- Eligible?
- —
Short-term bridge; refi at stabilization.
Listing history 9 events
-
2026-05-31days on market $475,000 Active 284 DOM
-
2025-10-20price $475,000 842-char remark
Show marketing remark (842 chars)
Attention investors! This rare 3-unit multifamily offers significant upside potential in a desirable location near the Cove. Each unit features 2 bedrooms and 1 bathroom with separate gas and electric meters, giving tenants independence while simplifying ownership. Currently occupied by long-term tenants-at-will.The property is generating stable income with undermarket rents, allowing for immediate value-add through strategic rent adjustments.The building has deferred maintenance, which creates the perfect chance to Renovate, Rebrand, and Reposition for maximum returns. Situated on a quiet street with easy access to the Covewalk and hurricane barriers, this property also benefits from proximity to public transportation, restaurants, banks, and everyday conveniences—a highly attractive location for current and future renters.
-
2025-08-20$499,000 New 842-char remark
Show marketing remark (842 chars)
Attention investors! This rare 3-unit multifamily offers significant upside potential in a desirable location near the Cove. Each unit features 2 bedrooms and 1 bathroom with separate gas and electric meters, giving tenants independence while simplifying ownership. Currently occupied by long-term tenants-at-will.The property is generating stable income with undermarket rents, allowing for immediate value-add through strategic rent adjustments.The building has deferred maintenance, which creates the perfect chance to Renovate, Rebrand, and Reposition for maximum returns. Situated on a quiet street with easy access to the Covewalk and hurricane barriers, this property also benefits from proximity to public transportation, restaurants, banks, and everyday conveniences—a highly attractive location for current and future renters.
-
2019-03-29soldstatus $123,000 Sold 242-char remark
Show marketing remark (242 chars)
Excellent far South location, near beach, boat ramp and bike path. Water view from 3rd floor. Off street parking, nice fenced in yard. Updated electric. excellent for handy man who wants to build sweat equity , for owner occupied or investor.
-
2019-03-05status Under Agreement 242-char remark
Show marketing remark (242 chars)
Excellent far South location, near beach, boat ramp and bike path. Water view from 3rd floor. Off street parking, nice fenced in yard. Updated electric. excellent for handy man who wants to build sweat equity , for owner occupied or investor.
-
2019-03-05status Reactivated 242-char remark
Show marketing remark (242 chars)
Excellent far South location, near beach, boat ramp and bike path. Water view from 3rd floor. Off street parking, nice fenced in yard. Updated electric. excellent for handy man who wants to build sweat equity , for owner occupied or investor.
-
2019-02-25historical 242-char remark
Show marketing remark (242 chars)
Excellent far South location, near beach, boat ramp and bike path. Water view from 3rd floor. Off street parking, nice fenced in yard. Updated electric. excellent for handy man who wants to build sweat equity , for owner occupied or investor.
-
2019-01-25$149,900 New 242-char remark
Show marketing remark (242 chars)
Excellent far South location, near beach, boat ramp and bike path. Water view from 3rd floor. Off street parking, nice fenced in yard. Updated electric. excellent for handy man who wants to build sweat equity , for owner occupied or investor.
-
1987-08-07soldstatus $95,000
ⓘ Source: listings_history table (triggers on properties + properties_extension) + one-shot
backfill from property_details.listing_events for pre-trigger history.
Tax reassessment forecast MA · Partial reset (capped growth)
- Current annual tax
- $3,785 · $315/mo
- Projected year-2 tax
- $4,814 · $401/mo
- Expected delta
- +$1,029/yr (+$86/mo · 27.2%)
ⓘ Screening estimate from a state-policy table — verify with the county assessor before closing.
Climate risk First Street
- Flood 5/10 Major FEMA zone X · 13% chance over 30 yrs
- Wildfire 1/10 Low
- Heat 5/10 Major 7 d/yr ≥94°F today · 16 d/yr by 30 yrs out
- Wind 8/10 Severe 80% chance of damaging wind over 30 yrs
- Air quality 2/10 Low 1 unhealthy d/yr today · 2 by 30 yrs out
Nearby sold comps map
Loading sold comps map…
Walkable amenities ~0.75 mi
Loading nearby amenities…
Taxation est. · year 1
- Rental income
- $57,636
- − Mortgage interest
- −$26,607
- − Property taxes
- −$3,785
- − Insurance
- −$2,375
- − Repairs & maintenance
- −$4,611
- − Management
- −$4,611
- − Depreciation
- −$13,818
- Taxable income
- $1,829
- Est. tax owed @ 24.0%
- −$439
- After-tax cash flow
- $9,042/yr
For passive investors: Depreciation is non-cash, so a rental often shows a tax loss while cash-flowing — sheltering income. Rental losses are passive: they offset passive income freely, and up to $25,000/yr can offset ordinary (W-2) income if you actively participate and your MAGI is under $100k (phasing out to $0 by $150k); unused losses carry forward. On sale, claimed depreciation is recaptured at up to 25%, and gains may owe capital-gains tax (a 1031 exchange can defer both). Figures are a year-1 estimate at your 24.0% rate — not tax advice; consult a CPA.
Schools (NCES district)
- District
- New Bedford
- NCES district ID
- 2508430
- Math proficiency
- 17% ▼ -14.00%
- Reading proficiency
- 28% ▼ -6.00%
- Median HH income
- $37,901
- Composite
- 18.79/100
- National rank
- #8869
- State rank
- #287 of 302 in MA
Livability — New Bedford
- Score
- 67/100
- State rank
- #155
- US rank
- #10150
Category grades
Schools grade is shown separately in the Schools card above.
Census & demographics
- Census place
- New Bedford, MA
- County
- Bristol County · 342,083 people
- City population
- 76,528
- Metro
- Providence-Warwick, RI-MA
- Population (ZIP)
- 12,716
- Household income
- $58,675
- Rent vs Own
- Severe rent burden
- 811.0
Population outlook (Bristol County) Hauer SSP2
- Today (2025)
- 570,212 people
- By 2030
- 571,181 · +0.2%
- By 2040
- 565,389 · -0.8%
- By 2050
- 552,141 · -3.2%
- By 2075
- 520,923 · -8.6%
- By 2100
- 474,363 · -16.8%
Race, ethnicity, and origin ACS 2023
- Neighborhood character
- Diverse neighborhood (Simpson 0.61)
- Race & ethnicity
- White 57% Hispanic / Latino 27% Two or more races 20% Black 4%
- Hispanic origin (detail)
- Puerto Rican 17% Dominican 2%
- Common ancestry
- Russian 34% Lithuanian 5% Romanian 3%
- Foreign-born
- 24% · Canada
- Languages at home
- 57% English-only · Other Indo-European 22% Spanish 17% French/Haitian/Cajun 3%
Political lean MEDSL · Bristol
- 2024 margin
- Toss-up / Even · D 49.8% · R 48.5% · Other 1.8%
- 2008→2024 swing
- -21.9pp toward R · 2008: 23.2pp · 2024: 1.3pp
- All cycles
- 2024: D+1.3 2020: D+12.0 2016: D+9.3 2012: D+20.5 2008: D+23.2
Not yet ingested
- Civics
- —
Market trends
- HPI YoY
- ▲ 6.66%
- Current HPI
- 417.5735
- Rent YoY
- —
- Metro
- Providence-Warwick, RI-MA
- State GDP YoY
- ▲ 2.28%
- F500 in state
- 38
Industry mix (Fortune 500 HQ in MA)
| Industry | F500 HQs | Revenue |
|---|---|---|
| Technology | 3 | $17B |
|
||
| Insurance | 2 | $84B |
|
||
| Retail | 2 | $76B |
|
||
| Life Sciences | 1 | $43B |
|
||
| Energy Technology | 1 | $31B |
|
||
| Aerospace / Defense | 1 | $18B |
|
||
Price history
+400.0% since first listed8 events — show timeline
- 2025-10-20 Price Changed $475,000 MLS PIN
- 2025-08-20 Listed $499,000 MLS PIN
- 2019-03-29 Sold (MLS) $123,000 MLS PIN
- 2019-03-05 Pending — MLS PIN
- 2019-03-05 Relisted — MLS PIN
- 2019-02-25 Listing Removed — MLS PIN
- 2019-01-25 Listed $149,900 MLS PIN
- 1987-08-07 Sold (Public Records) $95,000 Public Records
Property tax history
+3.0%/yrLatest (2023): $3,785 · +12.4% YoY. Source: county tax records.
Cash-flow waterfall
monthlySold comps — $/sqft
last 12 mo · ≤1 miLoading sold comps…