 Duplex
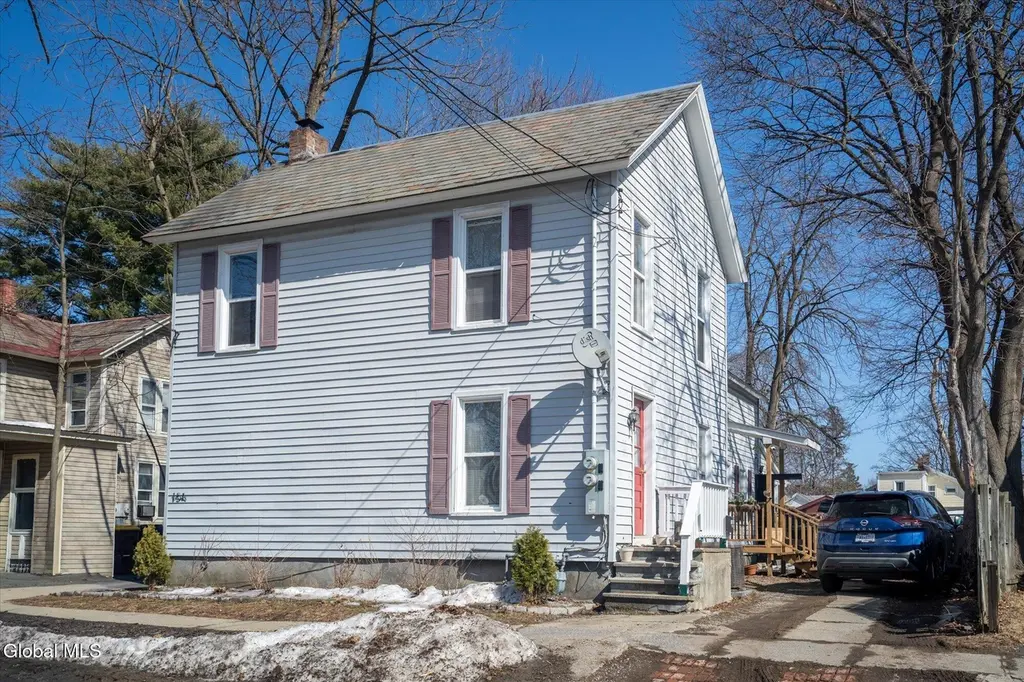
15 Ogden St · Glens Falls, NY
Flood risk 1/10 · Minimal
- FEMA flood zone
- X
- Chance of flooding over 30 yrs
- 0.0%
- Est. flood insurance / yr
- $473 – $860
Fire risk 2/10 · Minimal
- Est. fire insurance / yr
- $691 – $1,283
Heat risk 3/10 · Minor
- Hot days now (above 95°F)
- 7 days/yr
- Hot days in 30 yrs
- 16 days/yr
Wind risk 2/10 · Minimal
- Chance of severe wind over 30 yrs
- 3.0%
Air-quality risk 1/10 · Minimal
- Unhealthy air days now
- 0 days/yr
- Unhealthy air days in 30 yrs
- 0 days/yr
Risk factors via First Street. Map © Google.
Why this score? — see what drove the C grade
The composite is a weighted blend of 9 inputs, each scored 0–100. Each bar is that input's sub-score; the figure is the points it added to the 100-point composite (weight × sub-score).
- Cash flow +24.0/30.0
- DSCR +7.8/10.0
- ARV discount +7.2/15.0
- 1% rule +6.8/10.0
- Livability +4.2/5.0
- Schools +4.1/10.0
- Rent growth +2.5/5.0
- Condition / age +2.5/5.0
- Appreciation +0.0/10.0
$269,000
🖨 Deal sheet (PDF) 📄 Offer letter ✓ Due diligence
Multi-family units
County records classify this as Multi-Family (2-4 Unit). Listing-text estimate: 2 units. confirmed
Listing remarks MLS
This is the ''best of the best'' it comes to an investment and/or owner/occupied building. Fashioned as the most desireable Side by Side units, the house is set up similar to 2 townhouses. Front or 1st Side Apt is a 2 BR (both large size BR's) with newer kitchens and appliances in both units. 2nd or back unit is a 3 BR (all large BR's), with ample living space and oversized bathLarge Backyard with shed allows for ample room for family activities. Full Basements in both units allows for tenant storage and easy access to heating, plumbing and electrical.
Key facts
- 6,534 sq ft lot
- 4 parking spots
- Built 1920
Property features AI
Finance
- Financial info: Property is a 2-unit multifamily; Tenants are responsible for sewer, hot water, heat, electricity, and gas; Owner is responsible for trash collection and central air
Exterior
- Parking: 4 parking spaces total; Stone driveway
- Utilities: Public water; Public sewer; Cable available
- Home design: Duplex; Stone foundation; Vinyl siding; Slate roof; Level lot; 50 ft main road frontage
- Construction: Vinyl siding construction; Stone foundation; Slate roof
- Exterior features: Front porch; Side porch; Garden; Shed(s); Full wood and wire fencing
Interior
- Kitchen: Unit 1: 1 kitchen on 1st floor; Unit 2: kitchen included
- Bedrooms: Unit 1: 2 bedrooms (both on 2nd floor); Unit 2: 3 bedrooms
- Flooring: Vinyl; Tile; Carpet; Ceramic tile
- Bathrooms: 2 full bathrooms (both on 1st floor)
- Heating & cooling: Electric and natural gas heating with forced air; Central air conditioning
- Interior features: Paddle fans; High-speed internet; ENERGY STAR qualified doors
- Laundry & utility: Owner pays central air (cooling); Tenants pay heat and hot water
Neighborhood map
What this means for you Summary
Snapshot
- This is a 1×2bd/1.0ba + 1×3bd/1.0ba units multifamily listed at $269k.
Deal economics
- At list price, monthly cash flow is $529 ($6k/yr) — positive. Per door: $265/mo.
- The deal already cash-flows at list — no discount required.
- Meets the 1% rule at list price ($3k rent vs $269k).
- Recommended offer: $261k (3.0% below list) — sets the bar for market timing.
- Cap rate 8.7% vs local median 4.8% in Glens Falls — top-decile yield for the area; either an underpriced asset or a hidden risk that comps aren't pricing in. Stress-test before assuming the spread holds.
Location & tenants
- Location reads 83/100 on livability (#60 in NY, #894 nationally) — a professional / high-income tenant draw. Strengths: crime A+, amenities A+, housing A+.
- Glens Falls City School District (urban): math 44% / reading 53% proficiency, ranked #416 of 590 in NY (top 70%) — families likely to look elsewhere, expect single-tenant / working-renter base with shorter leases.
- Zoned schools: Glens Falls Senior High School (math 98% / reading 64%, grade A, #485 of 1,100 statewide, top 45%, 601 students, 41% FRL).
- Zoned-school proficiency averages 81% at this address vs 48% district-wide (+32 pts) — the actual schools serving this property are materially stronger than the Glens Falls City School District average implies; a family-tenant draw the district grade alone would hide.
- Market conditions: 56 active listings in the ZIP; 180 units permitted in Warren County in 2024 (40 in 5+ unit buildings).
- At $3,186/mo this rent would consume 57% of the median local household income ($68k/yr) (locally 866% of renters already pay >50% of income on rent) — very limited rent-growth headroom before tenants either downsize or default.
Forward outlook
- Local home prices are declining (-3.0%/yr); year-one equity from $2k of loan paydown is wiped out by about $8k of value loss. Plan a longer hold.
- Warren County population projected at -19% by 2050 — secular population decline; favor cash flow + early exit over multi-decade hold.
Negotiation context
- It's been on market 39 days — a 3% lower offer ($261k) is reasonable based on typical stale-listing flexibility.
- 5 sale attempts since 28y ago with the ask held roughly flat each time — persistent listings suggest the price (not the market) is what's stuck; bring a comps-based counter.
- Current owner paid $205k; 31% above their basis — modest negotiation headroom, anchor on the comps not their cost.
Risks & watch-outs
- Watch-outs: built in 1920 — expect roof / HVAC / electrical / plumbing capex.
Questions for the listing agent
- It's been on market 39 days. Have you received any prior offers? Is the seller open to a 3% concession, seller financing, or rate buy-down credit?
- Can we see the unit-by-unit rent roll, current vacancy, and any below-market leases? What's the average tenancy length?
- What capital expenditures (roof, boiler, parking lot, exteriors) have been made in the last 5 years, and what's planned in the next 2?
- Built in 1920 — when were the roof, HVAC, electrical panel, plumbing, and water heater last replaced?
- Is there a deadline driving the sale (1031 exchange, divorce, estate, relocation)? That informs how much negotiation room exists.
- What's the average days-on-market for RENTAL listings here right now (not sales)? A rising rental-DOM trend means longer vacancies and softer asking-rent achievability than the comps imply.
- What's the recent tenant-quality profile in this submarket — average credit score on applications, eviction rate, late-payment / NSF rate, and stable-employment percentage? A property-management company in the area should have these aggregated.
- How much new apartment / multifamily construction is in the pipeline within 1–3 miles? Heavy new supply (>2% of stock underway) typically softens rents 12–24 months out; light construction supports rent growth.
Investment metrics
- 1% rule
- 1.18% ✓
- Cap rate
- 8.65%
- Cash-on-cash
- 8.43%
- DSCR
- 1.38
- GRM
- 7.0
CMA / ARV
- ARV (on-the-fly)
- $267,376
- Comps found
- 12
Show comp detail 12 sales within ~0.75 mi
| Address | Dist | Beds/Ba | Sqft | Sold | Price | $/sf | Match |
|---|---|---|---|---|---|---|---|
| 21 William St | 0.27mi | 5/2.0 | 1,947 (-1%) | 8mo | $171,000 | $88 | 79 |
| 11 William St | 0.23mi | 5/2.0 | 1,940 (-1%) | 16mo | $250,000 | $129 | 74 |
| 14 John St | 0.20mi | 5/3.0 | 1,764 (-10%) | 3mo | $250,000 | $142 | 67 |
| 26 Grand St | 0.33mi | 4/2.0 (-1) | 1,780 (-10%) | 1mo | $245,000 | $138 | 62 |
| 173 Bay St | 0.17mi | 5/2.0 | 2,256 (+15%) | 7mo | $225,000 | $100 | 62 |
| 20-22 Baldwin Ave | 0.30mi | 4/2.0 (-1) | 1,874 (-5%) | 15mo | $210,000 | $112 | 60 |
| 36 N Pearl St | 0.62mi | 6/3.0 (+1) | 1,968 (+0%) | 4mo | $315,000 | $160 | 58 |
| 8 William St | 0.21mi | 4/2.0 (-1) | 1,680 (-14%) | 12mo | $245,000 | $146 | 51 |
| 95 Bay St | 0.33mi | 5/3.0 | 2,242 (+14%) | 13mo | $255,000 | $114 | 46 |
| 10 Auburn Pl | 0.51mi | 5/2.0 | 1,770 (-10%) | 18mo | $240,000 | $136 | 45 |
| 7 Traver St | 0.60mi | 4/2.5 (-1) | 1,741 (-11%) | 5mo | $200,000 | $115 | 42 |
| 20 Elizabeth St | 0.68mi | 4/2.5 (-1) | 1,867 (-5%) | 17mo | $330,000 | $177 | 39 |
Match score weights: distance 35% · size 25% · config 20% · recency 20%. Top-matched comps best support the ARV.
Projected returns pro-forma
-3.0% appreciation · 3.0% rent growth · sell at horizon
- IRR
- -3.5%
- Equity multiple
- 0.87×
- Total profit
- $-9,758
- Equity at exit
- $40,109
- IRR
- 6.3%
- Equity multiple
- 1.47×
- Total profit
- $35,419
- Equity at exit
- $23,258
Cash invested: $75,320 (down + closing). Projections, not guarantees.
Landlord ↔ Tenant lean methodology
- Overall (STATE)
- 15 Strongly Tenant-Friendly
- State New York
- 15 Strongly Tenant-Friendly · D+10
- County
- — inherits STATE
- City
- — inherits STATE
ZIP-level market 12801
- Home prices YoY
- -13.7%
- Active inventory
- 56
- Price-to-rent
- 15.0×
Monthly cashflow live
- Estimated rent
- $3,186 medium interval (Pro) →
- Mortgage (P&I)
- −$1,411
- Tax from tax record
- −$465 /mo · $5,580/yr
- Insurance
- −$112
- HOA
- −$0
- Vacancy / Maint / Mgmt
- −$669
- Net cashflow
- $529
Break-even live
Sensitivity live
| Price | -10% $681 | -5% $605 | +0% $529 | +5% $453 | +10% $377 |
|---|---|---|---|---|---|
| Rent | -10% $277 | -5% $403 | +0% $529 | +5% $655 | +10% $781 |
| Rate | -1.0pp $665 | -0.5pp $598 | base $529 | +0.5pp $459 | +1.0pp $389 |
2-unit breakdown (identical units grouped — click to expand)
| Units | Beds | Baths | Est. rent |
|---|---|---|---|
| 1× unit | 2 | 1 | $1,493 |
| 1× unit | 3 | 1 | $1,693 |
| Total (2 units) | $3,186 | ||
UW: 25.0% down · 7.5% · 30yr · 1.5% tax · 5.0% vac · 8.0% maint · 8.0% mgmt
Financing live
Cash to close
- Down payment
- $67,250
- Closing costs
- $8,070
- Reserves months
- —
- Total cash needed
- —
Loan-product check · same deal, 3 products live
Conventional
25% down · 7.5% · 30yr
- Down + closing
- —
- Monthly P&I
- —
- Monthly cashflow
- —
- DSCR
- —
- Eligible?
- —
Personal DTI + credit; lowest rate.
DSCR
20% down · 8.5% · 30yr
- Down + closing
- —
- Monthly P&I
- —
- Monthly cashflow
- —
- DSCR
- —
- Eligible?
- —
No personal income docs; deal must DSCR.
Hard money
10% down · 12.0% · 12mo
- Down + closing
- —
- Monthly P&I
- —
- Monthly cashflow
- —
- DSCR
- —
- Eligible?
- —
Short-term bridge; refi at stabilization.
Listing history 16 events
-
2026-04-28historical Contingent
-
2026-04-23status Active
-
2026-03-25status Pending
-
2026-03-24historical
-
2026-03-18$269,000 Active
-
2023-05-01soldstatus $205,000
-
2023-04-04soldstatus $205,000 Closed 563-char remark
Show marketing remark (563 chars)
This is the ''best of the best'' it comes to an investment and/or owner/occupied building. Fashioned as the most desireable Side by Side units, the house is set up similar to 2 townhouses. Front or 1st Side Apt is a 2 BR (both large size BR's) with newer kitchens and appliances in both units. 2nd or back unit is a 3 BR (all large BR's), with ample living space and oversized bathLarge Backyard with shed allows for ample room for family activities. Full Basements in both units allows for tenant storage and easy access to heating, plumbing and electrical.
-
2023-02-16historical Contingent 563-char remark
Show marketing remark (563 chars)
This is the ''best of the best'' it comes to an investment and/or owner/occupied building. Fashioned as the most desireable Side by Side units, the house is set up similar to 2 townhouses. Front or 1st Side Apt is a 2 BR (both large size BR's) with newer kitchens and appliances in both units. 2nd or back unit is a 3 BR (all large BR's), with ample living space and oversized bathLarge Backyard with shed allows for ample room for family activities. Full Basements in both units allows for tenant storage and easy access to heating, plumbing and electrical.
-
2022-11-25price $201,000 563-char remark
Show marketing remark (563 chars)
This is the ''best of the best'' it comes to an investment and/or owner/occupied building. Fashioned as the most desireable Side by Side units, the house is set up similar to 2 townhouses. Front or 1st Side Apt is a 2 BR (both large size BR's) with newer kitchens and appliances in both units. 2nd or back unit is a 3 BR (all large BR's), with ample living space and oversized bathLarge Backyard with shed allows for ample room for family activities. Full Basements in both units allows for tenant storage and easy access to heating, plumbing and electrical.
-
2022-10-04$224,900 Active 563-char remark
Show marketing remark (563 chars)
This is the ''best of the best'' it comes to an investment and/or owner/occupied building. Fashioned as the most desireable Side by Side units, the house is set up similar to 2 townhouses. Front or 1st Side Apt is a 2 BR (both large size BR's) with newer kitchens and appliances in both units. 2nd or back unit is a 3 BR (all large BR's), with ample living space and oversized bathLarge Backyard with shed allows for ample room for family activities. Full Basements in both units allows for tenant storage and easy access to heating, plumbing and electrical.
-
2004-09-03soldstatus $132,000
-
2004-09-02soldstatus $132,000 135-char remark
Show marketing remark (135 chars)
A two-family like you've never seen! Two BR is renovated, rented, really nice..Three BR is BRAND NEW and AWESOME...a definite MUST SEE!
-
2004-06-10$134,000 135-char remark
Show marketing remark (135 chars)
A two-family like you've never seen! Two BR is renovated, rented, really nice..Three BR is BRAND NEW and AWESOME...a definite MUST SEE!
-
1999-07-26soldstatus $43,000
-
1999-05-01historical
-
1998-05-01$53,900
ⓘ Source: listings_history table (triggers on properties + properties_extension) + one-shot
backfill from property_details.listing_events for pre-trigger history.
Tax reassessment forecast NY · Partial reset (capped growth)
- Current annual tax
- $5,580 · $465/mo
- Projected year-2 tax
- $5,580 · $465/mo
- Expected delta
- $0/yr ($0/mo · 0.0%)
ⓘ Screening estimate from a state-policy table — verify with the county assessor before closing.
Climate risk First Street
- Flood 1/10 Low FEMA zone X · 0% chance over 30 yrs
- Wildfire 2/10 Low
- Heat 3/10 Moderate 7 d/yr ≥95°F today · 16 d/yr by 30 yrs out
- Wind 2/10 Low 3% chance of damaging wind over 30 yrs
- Air quality 1/10 Low 0 unhealthy d/yr today · 0 by 30 yrs out
Nearby sold comps map
Loading sold comps map…
Walkable amenities ~0.75 mi
Loading nearby amenities…
Taxation est. · year 1
- Rental income
- $38,232
- − Mortgage interest
- −$15,068
- − Property taxes
- −$5,580
- − Insurance
- −$1,345
- − Repairs & maintenance
- −$3,059
- − Management
- −$3,059
- − Depreciation
- −$7,825
- Taxable income
- $2,296
- Est. tax owed @ 24.0%
- −$551
- After-tax cash flow
- $5,799/yr
For passive investors: Depreciation is non-cash, so a rental often shows a tax loss while cash-flowing — sheltering income. Rental losses are passive: they offset passive income freely, and up to $25,000/yr can offset ordinary (W-2) income if you actively participate and your MAGI is under $100k (phasing out to $0 by $150k); unused losses carry forward. On sale, claimed depreciation is recaptured at up to 25%, and gains may owe capital-gains tax (a 1031 exchange can defer both). Figures are a year-1 estimate at your 24.0% rate — not tax advice; consult a CPA.
Schools (NCES district)
- District
- Glens Falls City School District
- NCES district ID
- 3612240
- Math proficiency
- 44% ▼ -8.00%
- Reading proficiency
- 53% ▲ 6.00%
- Median HH income
- $48,216
- Composite
- 41.34/100
- National rank
- #3499
- State rank
- #416 of 590 in NY
Livability — Glens Falls
- Score
- 83/100
- State rank
- #60
- US rank
- #894
Category grades
Schools grade is shown separately in the Schools card above.
Census & demographics
- Census place
- Glens Falls, NY
- County
- Warren County · 14,628 people
- City population
- 14,628
- Metro
- Glens Falls, NY
- Population (ZIP)
- 14,628
- Household income
- $67,577
- Rent vs Own
- Severe rent burden
- 866.0
Population outlook (Warren County) Hauer SSP2
- Today (2025)
- 62,372 people
- By 2030
- 60,491 · -3.0%
- By 2040
- 55,616 · -10.8%
- By 2050
- 50,437 · -19.1%
- By 2075
- 40,843 · -34.5%
- By 2100
- 31,159 · -50.0%
Race, ethnicity, and origin ACS 2023
- Neighborhood character
- Predominantly White (90%)
- Race & ethnicity
- White 90% Two or more races 6% Hispanic / Latino 3% Black 2%
- Common ancestry
- Lithuanian 9% Romanian 5% Slovak 5%
- Foreign-born
- 3% · Canada, Dominican Republic
- Languages at home
- 97% English-only · Spanish 1% German/W. Germanic 1%
Political lean MEDSL · Warren
- 2024 margin
- Toss-up / Even · D 47.9% · R 52.1%
- 2008→2024 swing
- -6.9pp toward R · 2008: 2.6pp · 2024: -4.2pp
- All cycles
- 2024: R+4.2 2020: R+0.2 2016: R+10.6 2012: D+2.1 2008: D+2.6
Not yet ingested
- Civics
- —
Market trends
- HPI YoY
- ▼ -52.28%
- Current HPI
- 330.581
- Rent YoY
- —
- Metro
- Glens Falls, NY
- State GDP YoY
- ▲ 2.60%
- F500 in state
- 92
Industry mix (Fortune 500 HQ in NY)
| Industry | F500 HQs | Revenue |
|---|---|---|
| Financial Services | 10 | $950B |
|
||
| Consumer Goods | 9 | $162B |
|
||
| Insurance | 4 | $225B |
|
||
| Telecommunications | 2 | $144B |
|
||
| Pharmaceuticals | 2 | $112B |
|
||
| Media / Entertainment | 2 | $69B |
|
||
Price history
+399.1% since first listed16 events — show timeline
- 2026-04-28 Contingent — Global MLS
- 2026-04-23 Relisted — Global MLS
- 2026-03-25 Pending — Global MLS
- 2026-03-24 Listing Removed — Global MLS
- 2026-03-18 Listed $269,000 Global MLS
- 2023-05-01 Sold (Public Records) $205,000 Public Records
- 2023-04-04 Sold (MLS) $205,000 Global MLS
- 2023-02-16 Contingent — Global MLS
- 2022-11-25 Price Changed $201,000 Global MLS
- 2022-10-04 Listed $224,900 Global MLS
- 2004-09-03 Sold (Public Records) $132,000 Public Records
- 2004-09-02 Sold (MLS) $132,000 Global MLS
- 2004-06-10 Listed $134,000 Global MLS
- 1999-07-26 Sold (Public Records) $43,000 Public Records
- 1999-05-01 Listing Removed — Global MLS
- 1998-05-01 Listed $53,900 Global MLS
Property tax history
+5.9%/yrLatest (2025): $5,580 · +1.0% YoY. Source: county tax records.
Cash-flow waterfall
monthlySold comps — $/sqft
last 12 mo · ≤1 miLoading sold comps…