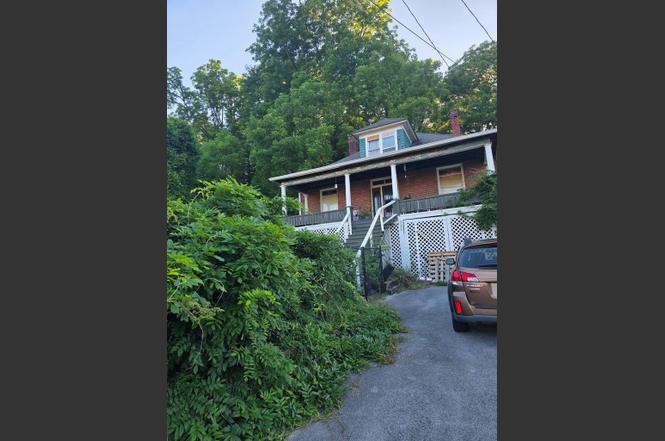
711 Virginia Ave · Bluefield, VA
Flood risk 10/10 · Severe
- FEMA flood zone
- X (unshaded)
- Chance of flooding over 30 yrs
- 0.99%
- Est. flood insurance / yr
- $507 – $1,088
Fire risk 4/10 · Minor
- Est. fire insurance / yr
- $666 – $1,236
Heat risk 3/10 · Minor
- Hot days now (above 90°F)
- 9 days/yr
- Hot days in 30 yrs
- 26 days/yr
Wind risk 2/10 · Minimal
- Chance of severe wind over 30 yrs
- 0.0%
Air-quality risk 1/10 · Minimal
- Unhealthy air days now
- 0 days/yr
- Unhealthy air days in 30 yrs
- 0 days/yr
Risk factors via First Street. Map © Google.
Why this score? — see what drove the B+ grade
The composite is a weighted blend of 9 inputs, each scored 0–100. Each bar is that input's sub-score; the figure is the points it added to the 100-point composite (weight × sub-score).
- Cash flow +30.0/30.0
- ARV discount +15.0/15.0
- DSCR +10.0/10.0
- 1% rule +8.0/10.0
- Schools +6.0/10.0
- Livability +3.1/5.0
- Rent growth +2.5/5.0
- Condition / age +2.5/5.0
- Appreciation +0.0/10.0
$85,000
🖨 Deal sheet (PDF) 📄 Offer letter ✓ Due diligence
Listing remarks MLS
Two houses for the price of one! Also includes 711 Virginia Ave house is next door on the right. Built with charm and character with large rooms, high ceilings and wood floors. Opportunity to restore both houses to their former grandeur! Both houses need work. Heating and plumbing are not in working condition. Electric is turned off in both houses but is working per seller. The two houses must be sold together. 713 has been vacant for about 10 yrs and 711 vacant for about 30 yrs. SOLD AS IS WHERE IS WITH NO WARRANTIES.
Key facts
- New plumbing
- Gas boiler
- Fenced in front yard
Tags
Property features AI
Exterior
- Utilities: Public water; Public sewer; Natural gas available
- Home design: Single family residence; Two levels; Brick construction
- Construction: Shingle roof
- Exterior features: Balcony; Creek on the property
Interior
- Kitchen: Refrigerator
- Flooring: Wood flooring
- Bathrooms: 1 full bathroom; 1 half bathroom
- Heating & cooling: Natural gas heating; Ceiling fan(s) for cooling
- Interior features: Gas log fireplace; Unfinished basement
Neighborhood map
What this means for you Summary
Snapshot
- This is a 3-bed/1.5-bath single-family listed at $85k.
Deal economics
- At list price, monthly cash flow is $286 ($3k/yr) — positive.
- The deal already cash-flows at list — no discount required.
- Meets the 1% rule at list price ($1k rent vs $85k).
- Cap rate 11.3% vs local median 4.1% in Bluefield — top-decile yield for the area; either an underpriced asset or a hidden risk that comps aren't pricing in. Stress-test before assuming the spread holds.
Location & tenants
- Location reads 62/100 on livability (#408 in VA) — a middle-class / working-renter tenant base. Strengths: cost of living A+, housing A+, crime B; Watch: employment C-, amenities F, commute F.
- Tazewell County Public School District (town): math 67% / reading 78% proficiency, ranked #21 of 131 in VA (top 16%) — strong family-tenant draw, lease renewals of 3-5y typical.
- Zoned schools: Dudley Primary (357 students, 82% FRL); Graham Middle (math 65% / reading 78%, grade A, #72 of 342 statewide, top 22%, 372 students, 82% FRL); Graham High (math 92% / reading 98%, grade A+, #1 of 319 statewide, top 0%, 529 students, 83% FRL) — zoned schools average 83% FRL vs 47% district-wide (36 pts higher); higher-poverty schools than district average — tighter screening recommended.
- Market conditions: 46 active listings in the ZIP; 4 units permitted in Tazewell County in 2024 (0 in 5+ unit buildings).
Forward outlook
- Local home prices are declining (-3.0%/yr); year-one equity from $588 of loan paydown is wiped out by about $3k of value loss. Plan a longer hold.
- Tazewell County population projected at -30% by 2050 — secular population decline; favor cash flow + early exit over multi-decade hold.
- At projected returns (-3.0% appreciation + 3.0% rent growth), your $24k cash investment doubles in ~9 years — after that, you're playing with house money.
Negotiation context
- Only 8 days on market — expect competitive offers; lowballing is unlikely to land.
- 3 sale attempts since 5y ago with the ask held roughly flat each time — persistent listings suggest the price (not the market) is what's stuck; bring a comps-based counter.
- Current owner paid $40k; list at $85k implies a 112% gain — meaningful room to come down on a strong offer.
Risks & watch-outs
- Watch-outs: flood insurance adds $66/mo; built in 1900 — expect roof / HVAC / electrical / plumbing capex.
- Climate carrying-cost: severe flood risk — expect insurance premiums to compound above CPI over the hold.
Questions for the listing agent
- Built in 1900 — when were the roof, HVAC, electrical panel, plumbing, and water heater last replaced?
- What's the actual annual flood-insurance premium (NFIP or private), and is the property in a SFHA with mandatory coverage?
- Is there a deadline driving the sale (1031 exchange, divorce, estate, relocation)? That informs how much negotiation room exists.
- Schools are A-rated — typically a magnet for longer-tenancy family renters. What's the average tenant stay here, and is there a school-zone premium baked into asking?
- What's the average days-on-market for RENTAL listings here right now (not sales)? A rising rental-DOM trend means longer vacancies and softer asking-rent achievability than the comps imply.
- What's the recent tenant-quality profile in this submarket — average credit score on applications, eviction rate, late-payment / NSF rate, and stable-employment percentage? A property-management company in the area should have these aggregated.
- How much new for-sale + rental construction is in the pipeline within 1–3 miles? Heavy new supply typically softens prices + rents 12–24 months out; constrained supply supports both.
Investment metrics
- 1% rule
- 1.30% ✓
- Cap rate
- 11.27%
- Cash-on-cash
- 17.78%
- DSCR
- 1.79
- GRM
- 6.4
CMA / ARV
- ARV (on-the-fly)
- $115,758
- Comps found
- 3
Show comp detail 3 sales within ~0.75 mi
| Address | Dist | Beds/Ba | Sqft | Sold | Price | $/sf | Match |
|---|---|---|---|---|---|---|---|
| 109 Blake St | 0.32mi | 3/1.5 | 1,829 (-7%) | 14mo | $107,000 | $59 | 62 |
| 1006 Virginia Ave | 0.58mi | 4/1.5 (+1) | 1,922 (-2%) | 7mo | $134,000 | $70 | 59 |
| 734 Tazewell Ave | 0.72mi | 4/1.5 (+1) | 1,962 (0%) | 12mo | $50,000 | $25 | 51 |
Match score weights: distance 35% · size 25% · config 20% · recency 20%. Top-matched comps best support the ARV.
Projected returns pro-forma
-3.0% appreciation · 3.0% rent growth · sell at horizon
- IRR
- 4.8%
- Equity multiple
- 1.19×
- Total profit
- $4,471
- Equity at exit
- $12,674
- IRR
- 14.3%
- Equity multiple
- 2.15×
- Total profit
- $27,432
- Equity at exit
- $7,349
Cash invested: $23,800 (down + closing). Projections, not guarantees.
Landlord ↔ Tenant lean methodology
- Overall (STATE)
- 55 Moderately Landlord-Leaning
- State Virginia
- 55 Moderately Landlord-Leaning · D+2
- County
- — inherits STATE
- City
- — inherits STATE
ZIP-level market 24605
- Home prices YoY
- -27.8%
- Active inventory
- 46
- Price-to-rent
- 6.4×
Monthly cashflow live
- Estimated rent
- $1,105 medium interval (Pro) →
- Mortgage (P&I)
- −$446
- Tax from tax record
- −$39 /mo · $467/yr
- Insurance
- −$35
- Flood insurance flood zone
- −$66 /mo · $798/yr
- HOA
- −$0
- Vacancy / Maint / Mgmt
- −$232
- Net cashflow
- $286
Break-even live
Sensitivity live
| Price | -10% $334 | -5% $310 | +0% $286 | +5% $262 | +10% $238 |
|---|---|---|---|---|---|
| Rent | -10% $199 | -5% $243 | +0% $286 | +5% $330 | +10% $373 |
| Rate | -1.0pp $329 | -0.5pp $308 | base $286 | +0.5pp $264 | +1.0pp $242 |
UW: 25.0% down · 7.5% · 30yr · 1.5% tax · 5.0% vac · 8.0% maint · 8.0% mgmt
Financing live
Cash to close
- Down payment
- $21,250
- Closing costs
- $2,550
- Reserves months
- —
- Total cash needed
- —
Loan-product check · same deal, 3 products live
Conventional
25% down · 7.5% · 30yr
- Down + closing
- —
- Monthly P&I
- —
- Monthly cashflow
- —
- DSCR
- —
- Eligible?
- —
Personal DTI + credit; lowest rate.
DSCR
20% down · 8.5% · 30yr
- Down + closing
- —
- Monthly P&I
- —
- Monthly cashflow
- —
- DSCR
- —
- Eligible?
- —
No personal income docs; deal must DSCR.
Hard money
10% down · 12.0% · 12mo
- Down + closing
- —
- Monthly P&I
- —
- Monthly cashflow
- —
- DSCR
- —
- Eligible?
- —
Short-term bridge; refi at stabilization.
Listing history 8 events
-
2026-06-22days on market $85,000 Active 8 DOM
-
2026-06-21days on market $85,000 Active 7 DOM
-
2026-06-19days on market $85,000 Active 5 DOM
-
2026-06-18days on market $85,000 Active 4 DOM
-
2026-06-17days on market $85,000 Active 3 DOM
-
2026-06-16days on market $85,000 Active 2 DOM
-
2026-06-15remarks 321-char remark
-
2026-06-15$85,000 Active 1 DOM
ⓘ Source: listings_history table (triggers on properties + properties_extension) + one-shot
backfill from property_details.listing_events for pre-trigger history.
Tax reassessment forecast VA · Resets to sale price
- Current annual tax
- $467 · $39/mo
- Projected year-2 tax
- $697 · $58/mo
- Expected delta
- +$230/yr (+$19/mo · 49.1%)
ⓘ Screening estimate from a state-policy table — verify with the county assessor before closing.
Climate risk First Street
- Flood 10/10 Extreme FEMA zone X (unshaded) · 99% chance over 30 yrs
- Wildfire 4/10 Moderate
- Heat 3/10 Moderate 9 d/yr ≥90°F today · 26 d/yr by 30 yrs out
- Wind 2/10 Low 0% chance of damaging wind over 30 yrs
- Air quality 1/10 Low 0 unhealthy d/yr today · 0 by 30 yrs out
Nearby sold comps map
Loading sold comps map…
Walkable amenities ~0.75 mi
Loading nearby amenities…
Taxation est. · year 1
- Rental income
- $13,258
- − Mortgage interest
- −$4,761
- − Property taxes
- −$467
- − Insurance
- −$1,222
- − Repairs & maintenance
- −$1,061
- − Management
- −$1,061
- − Depreciation
- −$2,473
- Taxable income
- $2,212
- Est. tax owed @ 24.0%
- −$531
- After-tax cash flow
- $2,904/yr
For passive investors: Depreciation is non-cash, so a rental often shows a tax loss while cash-flowing — sheltering income. Rental losses are passive: they offset passive income freely, and up to $25,000/yr can offset ordinary (W-2) income if you actively participate and your MAGI is under $100k (phasing out to $0 by $150k); unused losses carry forward. On sale, claimed depreciation is recaptured at up to 25%, and gains may owe capital-gains tax (a 1031 exchange can defer both). Figures are a year-1 estimate at your 24.0% rate — not tax advice; consult a CPA.
Schools (NCES district)
- District
- Tazewell County Public School District
- NCES district ID
- 5103810
- Math proficiency
- 67% ▼ -23.00%
- Reading proficiency
- 78% ▼ -6.00%
- Median HH income
- $37,003
- Composite
- 60.16/100
- National rank
- #865
- State rank
- #21 of 131 in VA
Livability — Bluefield
- Score
- 62/100
- State rank
- #408
- US rank
- #17014
Category grades
Schools grade is shown separately in the Schools card above.
Census & demographics
- Census place
- Bluefield, VA
- Population (ZIP)
- 8,839
Population outlook (Tazewell County) Hauer SSP2
- Today (2025)
- 38,275 people
- By 2030
- 35,719 · -6.7%
- By 2040
- 30,875 · -19.3%
- By 2050
- 26,798 · -30.0%
- By 2075
- 19,286 · -49.6%
- By 2100
- 13,631 · -64.4%
Race, ethnicity, and origin ACS 2023
- Neighborhood character
- Predominantly White (87%)
- Race & ethnicity
- White 87% Black 7% Hispanic / Latino 3% Two or more races 2%
- Common ancestry
- Hispanic 3% Iranian 2% Slovak 1%
- Foreign-born
- 3% · Canada
- Languages at home
- 97% English-only · Spanish 1% Other Indo-European 1%
Political lean MEDSL · Tazewell
- 2024 margin
- Solid R (+68.9) · D 15.3% · R 84.2%
- 2008→2024 swing
- -36.0pp toward R · 2008: -32.9pp · 2024: -68.9pp
- All cycles
- 2024: R+68.9 2020: R+67.2 2016: R+66.3 2012: R+57.5 2008: R+32.9
Not yet ingested
- Civics
- —
Market trends
- HPI YoY
- ▼ -53.91%
- Current HPI
- 140.337
- Rent YoY
- —
- Metro
- —
- State GDP YoY
- ▲ 2.40%
- F500 in state
- 50
Industry mix (Fortune 500 HQ in VA)
| Industry | F500 HQs | Revenue |
|---|---|---|
| Aerospace / Defense | 4 | $236B |
|
||
| Technology / Defense | 3 | $32B |
|
||
| Financial Services | 2 | $176B |
|
||
| Utilities | 2 | $27B |
|
||
| Insurance | 2 | $25B |
|
||
| Technology | 2 | $15B |
|
||
Price history
+88.9% since first listed6 events — show timeline
- 2026-06-14 Listed $85,000 SWVAR
- 2021-10-18 Sold (Public Records) $40,000 Public Records
- 2021-10-18 Sold (MLS) $40,000 MTCBOR
- 2021-10-18 Sold (MLS) $40,000 SWVAR
- 2021-08-15 Listed $45,000 MTCBOR
- 2021-08-15 Listed $45,000 SWVAR
Property tax history
+8.9%/yrLatest (2025): $467 · +0.0% YoY. Source: county tax records.
Cash-flow waterfall
monthlySold comps — $/sqft
last 12 mo · ≤1 miLoading sold comps…