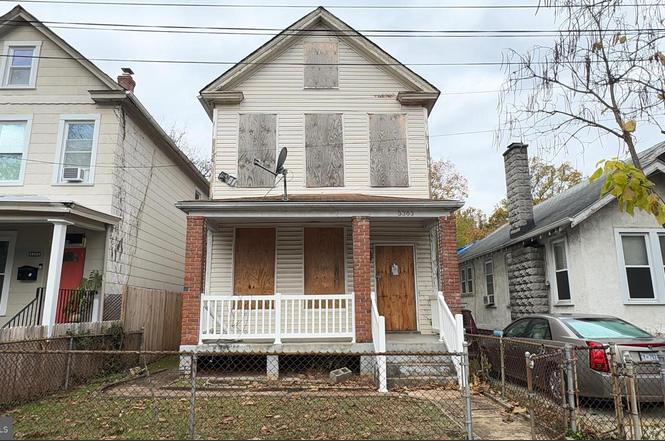
3363 Brothers Pl SE · Washington, DC
Flood risk 1/10 · Minimal
- FEMA flood zone
- X (unshaded)
- Chance of flooding over 30 yrs
- 0.0%
- Est. flood insurance / yr
- $507 – $1,088
Fire risk 1/10 · Minimal
- Est. fire insurance / yr
- $631 – $1,173
Heat risk 7/10 · Major
- Hot days now (above 104°F)
- 7 days/yr
- Hot days in 30 yrs
- 15 days/yr
Wind risk 4/10 · Minor
- Chance of severe wind over 30 yrs
- 17.0%
Air-quality risk 3/10 · Minor
- Unhealthy air days now
- 2 days/yr
- Unhealthy air days in 30 yrs
- 3 days/yr
Risk factors via First Street. Map © Google.
Why this score? — see what drove the C+ grade
The composite is a weighted blend of 9 inputs, each scored 0–100. Each bar is that input's sub-score; the figure is the points it added to the 100-point composite (weight × sub-score).
- Cash flow +21.9/30.0
- ARV discount +15.0/15.0
- DSCR +7.0/10.0
- 1% rule +5.7/10.0
- Livability +3.7/5.0
- Schools +3.6/10.0
- Rent growth +3.5/5.0
- Condition / age +2.5/5.0
- Appreciation +0.0/10.0
$244,900
🖨 Deal sheet 📄 Offer letter ✓ Due diligence
Listing remarks
Embrace this golden opportunity in the Congress Heights neighborhood! Positioned strategically, you are just a heartbeat away from Congress Heights Metro, a vibrant array of new residential housing, tantalizing restaurants, and bustling shopping areas. Connectivity is your friend here, with seamless access to major highways, placing Ronald Reagan Airport, MGM Casino, and National Harbor well within your reach.
Key facts
- 2,750 sq ft lot
- Built 1910
- Listed 217 days
Property features AI
Exterior
- Parking: On-street parking
- Utilities: Public water; Public sewer; Natural gas for heating and hot water; Electric for cooling
- Home design: Detached single-family home; Frame construction
- Construction: Frame construction; Block foundation; Above-grade and below-grade structures
- Exterior features: Not in a federal flood zone; Property is in city limits
Interior
- Bedrooms: Three bedrooms on the main level
- Bathrooms: One full bathroom; One half bathroom
- Heating & cooling: Hot water heat (natural gas); Central air conditioning (electric)
- Interior features: Fireplace (1); Unfinished basement
Neighborhood map
What this means for you Summary
Snapshot
- This is a 3-bed/1.5-bath single-family listed at $245k.
Deal economics
- At list price, monthly cash flow is $384 ($5k/yr) — positive.
- The deal already cash-flows at list — no discount required.
- Meets the 1% rule at list price ($3k rent vs $245k).
- Recommended offer: $216k (12.0% below list) — sets the bar for market timing.
- Cap rate 8.2% vs local median 2.5% in Washington — top-decile yield for the area; either an underpriced asset or a hidden risk that comps aren't pricing in. Stress-test before assuming the spread holds.
Location & tenants
- Location reads 73/100 on livability (#1 in DC) — a middle-class / working-renter tenant base. Strengths: amenities A+, commute A+, employment A+; Watch: crime F, cost of living F.
- District Of Columbia Public Schools (urban): math 33% / reading 40% proficiency, ranked #8 of 32 in DC (top 25%) — families likely to look elsewhere, expect single-tenant / working-renter base with shorter leases; 65% free/reduced lunch — lower-income household profile, screen leases tightly.
- Market conditions: Rents rising (+4.0%/yr); 145 active listings in the ZIP; 35 comparable units currently listed for rent nearby; rentals at typical pace (median 24d on market — plan ~3-4 weeks tenant-placement turnaround); 1,737 units permitted in District of Columbia in 2024 (1,506 in 5+ unit buildings).
- At $2,629/mo this rent would consume 64% of the median local household income ($49k/yr) (locally 4530% of renters already pay >50% of income on rent) — very limited rent-growth headroom before tenants either downsize or default.
Forward outlook
- Local home prices are declining (-3.0%/yr); year-one equity from $2k of loan paydown is wiped out by about $7k of value loss. Plan a longer hold.
- District of Columbia County population projected at +50% by 2050 — long-run rental-demand tailwind backs the buy-and-hold thesis.
Negotiation context
- It's been on market 217 days — a 12% lower offer ($216k) is reasonable based on typical stale-listing flexibility.
- 5 sale attempts since 23y ago; this cycle's ask has dropped $125k (34%) from the opening price — seller is motivated, your offer sets the floor, not the list.
- Current owner paid $200k; 23% above their basis — modest negotiation headroom, anchor on the comps not their cost.
Risks & watch-outs
- Watch-outs: built in 1910 — expect roof / HVAC / electrical / plumbing capex.
- Climate carrying-cost: extreme-heat days projected 7→15/yr by 2055 (HVAC capex compounding) — expect insurance premiums to compound above CPI over the hold.
Questions for the listing agent
- It's been on market 217 days. Have you received any prior offers? Is the seller open to a 12% concession, seller financing, or rate buy-down credit?
- Built in 1910 — when were the roof, HVAC, electrical panel, plumbing, and water heater last replaced?
- Why hasn't it sold? Are there any deal-killer items the seller is aware of (foundation, flood, title, zoning, code violations)?
- Is there a deadline driving the sale (1031 exchange, divorce, estate, relocation)? That informs how much negotiation room exists.
- Crime grade is F in this area — have there been break-ins, vandalism, or insurance claims at this property in the last 3 years? What carrier currently insures it and at what premium?
- What's the average days-on-market for RENTAL listings here right now (not sales)? A rising rental-DOM trend means longer vacancies and softer asking-rent achievability than the comps imply.
- What's the recent tenant-quality profile in this submarket — average credit score on applications, eviction rate, late-payment / NSF rate, and stable-employment percentage? A property-management company in the area should have these aggregated.
- How much new for-sale + rental construction is in the pipeline within 1–3 miles? Heavy new supply typically softens prices + rents 12–24 months out; constrained supply supports both.
Investment metrics
- 1% rule
- 1.07% ✓
- Cap rate
- 8.18%
- Cash-on-cash
- 6.72%
- DSCR
- 1.30
- GRM
- 7.8
CMA / ARV
- ARV (on-the-fly)
- $412,424
- Comps found
- 12
Show comp detail 12 sales within ~0.75 mi
| Address | Dist | Beds/Ba | Sqft | Sold | Price | $/sf | Match |
|---|---|---|---|---|---|---|---|
| 3226 4th St SE | 0.22mi | 3/1.5 | 1,688 (+2%) | 9mo | $235,000 | $139 | 80 |
| 3337 5th St SE | 0.28mi | 3/2.5 | 1,736 (+4%) | 1mo | $524,000 | $302 | 75 |
| 3013 5th St SE | 0.31mi | 3/1.0 | 1,550 (-7%) | 4mo | $249,000 | $161 | 69 |
| 435 Newcomb St SE | 0.35mi | 3/2.5 | 1,670 (+0%) | 20mo | $444,000 | $266 | 62 |
| 414 Orange St SE | 0.29mi | 3/1.0 | 1,890 (+14%) | 1mo | $250,000 | $132 | 61 |
| 550 Malcolm X Ave SE | 0.32mi | 3/3.0 | 1,845 (+11%) | 3mo | $424,000 | $230 | 58 |
| 1009 Congress St SE | 0.71mi | 4/1.0 (+1) | 1,618 (-3%) | 3mo | $289,000 | $179 | 53 |
| 3020 7th St SE | 0.48mi | 4/3.0 (+1) | 1,598 (-4%) | 14mo | $570,000 | $357 | 48 |
| 3912 2nd St SW | 0.66mi | 2/2.0 (-1) | 1,749 (+5%) | 8mo | $495,000 | $283 | 47 |
| 3935 Martin Luther King Jr Ave SW | 0.71mi | 3/2.5 | 1,712 (+3%) | 20mo | $301,000 | $176 | 41 |
| 407 Xenia St SE | 0.70mi | 3/2.5 | 1,440 (-13%) | 10mo | $375,000 | $260 | 32 |
| 3918 1st St SW | 0.68mi | 3/2.5 | 1,894 (+14%) | 22mo | $470,000 | $248 | 23 |
Match score weights: distance 35% · size 25% · config 20% · recency 20%. Top-matched comps best support the ARV.
Projected returns pro-forma
-3.0% appreciation · 3.96% rent growth · sell at horizon
- IRR
- -4.9%
- Equity multiple
- 0.82×
- Total profit
- $-12,617
- Equity at exit
- $36,515
- IRR
- 5.9%
- Equity multiple
- 1.46×
- Total profit
- $31,403
- Equity at exit
- $21,174
Cash invested: $68,572 (down + closing). Projections, not guarantees.
Landlord ↔ Tenant lean methodology
- Overall (CITY)
- 0 Strongly Tenant-Friendly
- State District of Columbia
- 12 Strongly Tenant-Friendly · D+43
- County
- — inherits STATE
- City Washington
- 0 Strongly Tenant-Friendly · D+43
ZIP-level market 20032
- Home prices YoY
- -15.6%
- Rents YoY
- 4.0%
- Active inventory
- 145
- Price-to-rent
- 7.8×
Monthly cashflow live
- Estimated rent
- $2,629 high interval (Pro) →
- Mortgage (P&I)
- −$1,284
- Tax est. 1.5%
- −$306 /mo · $3,674/yr
- Insurance
- −$102
- HOA
- −$0
- Vacancy / Maint / Mgmt
- −$552
- Net cashflow
- $384
Break-even live
UW: 25.0% down · 7.5% · 30yr · 1.5% tax · 5.0% vac · 8.0% maint · 8.0% mgmt
Financing live
Cash to close
- Down payment
- $61,225
- Closing costs
- $7,347
- Reserves months
- —
- Total cash needed
- —
Loan-product check · same deal, 3 products live
Conventional
25% down · 7.5% · 30yr
- Down + closing
- —
- Monthly P&I
- —
- Monthly cashflow
- —
- DSCR
- —
- Eligible?
- —
Personal DTI + credit; lowest rate.
DSCR
20% down · 8.5% · 30yr
- Down + closing
- —
- Monthly P&I
- —
- Monthly cashflow
- —
- DSCR
- —
- Eligible?
- —
No personal income docs; deal must DSCR.
Hard money
10% down · 12.0% · 12mo
- Down + closing
- —
- Monthly P&I
- —
- Monthly cashflow
- —
- DSCR
- —
- Eligible?
- —
Short-term bridge; refi at stabilization.
Rent comps 35 comps
| Address | Beds | Baths | Sqft | Rent | $/sqft | DOM | Units | Dist |
|---|---|---|---|---|---|---|---|---|
| 224 Malcolm X Ave SE Washington, DC | 4.0 | 3.5 | 2052 | $3,500 | $1.71 | 24d | 1 | 0.25mi |
| 150 Upsal St SE Washington, DC | 2.0 | 3.0 | 1695 | $3,200 | $1.89 | 24d | 1 | 0.27mi |
| 349 Parkland Pl SE Unit B Washington, DC | 4.0 | 2.0 | 1400 | $2,500 | $1.79 | 20d | 1 | 0.30mi |
| 349 Parkland Pl SE Unit A Washington, DC | 4.0 | 2.0 | 1400 | $2,500 | $1.79 | 24d | 1 | 0.30mi |
| 615 Malcolm X Ave SE Unit F Washington, DC | 3.0 | 1.0 | 1100 | $2,508 | $2.28 | 2d | 1 | 0.44mi |
| 407 Lebaum St SE Unit 4 Washington, DC | 2.0 | 1.0 | 1192 | $2,100 | $1.76 | 24d | 1 | 0.48mi |
| 742 Congress St SE Washington, DC | 3.0 | 2.5 | 1744 | $3,000 | $1.72 | 16d | 1 | 0.49mi |
| 3210 8th St SE #1 Washington, DC | 2.0 | 2.0 | 1106 | $2,395 | $2.17 | 24d | 1 | 0.49mi |
| 2913 8th St SE #3101 Washington, DC | 2.0 | 2.0 | 1100 | $2,400 | $2.18 | 13d | 1 | 0.54mi |
| 147 Mississippi Ave SE Washington, DC | 4.0 | 2.0 | 1459 | $2,795 | $1.92 | 21d | 1 | 0.56mi |
| 802 Malcolm X Ave SE Washington, DC | 4.0 | 1.0 | 1140 | $3,150 | $2.76 | 24d | 1 | 0.56mi |
| 1201 Oak Dr SE Washington, DC | 3.0 | 1.0–2.0 | 853 | $2,220 | $2.60 | 1d | 19 | 0.73mi |
| 4001 S Capitol St SW Washington, DC | 3.0 | 1.0–2.0 | 782 | $2,557 | $3.27 | 13d | 1 | 0.78mi |
| 4005 Blakney Ln SE Washington, DC | 3.0 | 2.5 | 2024 | $3,000 | $1.48 | 17d | 1 | 0.88mi |
| 1121 Varney St SE Washington, DC | 3.0 | 3.5 | 1400 | $3,000 | $2.14 | 24d | 1 | 0.94mi |
| 4281 S Capitol St SW Washington, DC | 3.0 | 3.5 | 1412 | $2,900 | $2.05 | 24d | 1 | 0.98mi |
| 4285 S Capitol St SW Washington, DC | 3.0 | 3.5 | 1152 | $3,500 | $3.04 | 14d | 1 | 0.99mi |
| 4287 S Capitol St SW Washington, DC | 2.0 | 3.5 | 1412 | $2,575 | $1.82 | 24d | 1 | 0.99mi |
| 4306 Halley Ter SE Unit 1 Washington, DC | 4.0 | 2.0 | 1270 | $3,000 | $2.36 | 10d | 1 | 1.01mi |
| 864 Bellevue St SE Unit 1 Washington, DC | 2.0 | 1.0 | 1628 | $1,700 | $1.04 | 24d | 1 | 1.02mi |
| 911 Bellevue St SE Washington, DC | 4.0 | 2.0 | 1820 | $3,400 | $1.87 | 24d | 1 | 1.06mi |
| 4334 Martin Luther King Jr Ave SW Washington, DC | 3.0 | 2.0 | 1323 | $3,200 | $2.42 | 24d | 1 | 1.15mi |
| 44 Forrester St SW Unit 3 Washington, DC | 3.0 | 2.0 | 1200 | $2,450 | $2.04 | 24d | 1 | 1.20mi |
| 4805 Springmaid Ln Oxon Hill, MD | 3.0 | 2.5 | 1296 | $2,600 | $2.01 | 18d | 1 | 1.20mi |
| 3243 15th Pl SE Washington, DC | 2.0 | 2.0 | 1248 | $2,500 | $2.00 | 24d | 1 | 1.22mi |
| 1439 Southern Ave SE Oxon Hill, MD | 2.0–3.0 | 1.0–2.0 | 1080 | $2,342 | $2.17 | 43d | 1 | 1.26mi |
| 2460 James Bank Rd SE Washington, DC | 3.0 | 3.5 | 1687 | $3,190 | $1.89 | 14d | 1 | 1.31mi |
| 2390 Elvans Rd SE Washington, DC | 3.0 | 2.5 | 2176 | $3,190 | $1.47 | 7d | 1 | 1.35mi |
| 118 Galveston St SW Washington, DC | 1.0–3.0 | 1.0–2.0 | 951 | $2,130 | $2.24 | 2d | 10 | 1.35mi |
| 4660 Martin Luther King Jr Ave SW Washington, DC | 1.0–2.0 | 1.0–2.0 | 827 | $1,699 | $2.05 | 2d | 11 | 1.39mi |
| 2501 Sayles Pl SE #9 Washington, DC | 2.0 | 2.0 | 1157 | $2,500 | $2.16 | 24d | 1 | 1.41mi |
| 2501 Sayles Pl SE #9 Washington, DC | 2.0 | 2.0 | 1157 | $2,500 | $2.16 | 10d | 1 | 1.41mi |
| 2648 Bowen Rd SE Washington, DC | 3.0 | 1.5 | 1220 | $2,500 | $2.05 | 24d | 1 | 1.42mi |
| 716 Audrey Ln Oxon Hill, MD | 3.0 | 2.0 | 1344 | $2,500 | $1.86 | 18d | 1 | 1.48mi |
| 1851 Tubman Rd SE Washington, DC | 3.0 | 2.0 | 1689 | $3,200 | $1.89 | 24d | 1 | 1.48mi |
Listing history 27 events
-
2026-06-10status $244,900 Pending 217 DOM
-
2026-06-09days on market $244,900 Active 217 DOM
-
2026-06-08days on market $244,900 Active 216 DOM
-
2026-06-07days on market $244,900 Active 215 DOM
-
2026-06-04days on market $244,900 Active 212 DOM
-
2026-06-03days on market $244,900 Active 211 DOM
-
2026-06-02days on market $244,900 Active 210 DOM
-
2026-06-01days on market $244,900 Active 209 DOM
-
2026-05-31days on market $244,900 Active 208 DOM
-
2026-04-30price $259,900
-
2026-03-24price $269,900
-
2026-02-25price $279,900
-
2026-01-12price $299,900
-
2025-12-01price $349,900
-
2025-11-04$369,900 Active
-
2025-07-20historical
-
2024-12-19$410,000 Active
-
2020-07-16historical
-
2020-07-13$250,000 Active
-
2004-04-30soldstatus $199,900
-
2004-04-16soldstatus $199,900
-
2004-04-02historical
-
2004-03-05$199,900
-
2003-08-18historical
-
2003-07-03
-
2003-02-11soldstatus $75,247
-
1979-04-23soldstatus $51,500
ⓘ Source: listings_history table (triggers on properties + properties_extension) + one-shot
backfill from property_details.listing_events for pre-trigger history.
Climate risk First Street
- Flood 1/10 Low FEMA zone X (unshaded) · 0% chance over 30 yrs
- Wildfire 1/10 Low
- Heat 7/10 Severe 7 d/yr ≥104°F today · 15 d/yr by 30 yrs out
- Wind 4/10 Moderate 17% chance of damaging wind over 30 yrs
- Air quality 3/10 Moderate 2 unhealthy d/yr today · 3 by 30 yrs out
Nearby sold comps map
Loading sold comps map…
Walkable amenities ~0.75 mi
Loading nearby amenities…
Taxation est. · year 1
- Rental income
- $31,543
- − Mortgage interest
- −$13,718
- − Property taxes
- −$3,674
- − Insurance
- −$1,224
- − Repairs & maintenance
- −$2,523
- − Management
- −$2,523
- − Depreciation
- −$7,124
- Taxable income
- $755
- Est. tax owed @ 24.0%
- −$181
- After-tax cash flow
- $4,428/yr
For passive investors: Depreciation is non-cash, so a rental often shows a tax loss while cash-flowing — sheltering income. Rental losses are passive: they offset passive income freely, and up to $25,000/yr can offset ordinary (W-2) income if you actively participate and your MAGI is under $100k (phasing out to $0 by $150k); unused losses carry forward. On sale, claimed depreciation is recaptured at up to 25%, and gains may owe capital-gains tax (a 1031 exchange can defer both). Figures are a year-1 estimate at your 24.0% rate — not tax advice; consult a CPA.
Schools (NCES district)
- District
- District Of Columbia Public Schools
- NCES district ID
- 1100030
- Math proficiency
- 33% ▲ 3.00%
- Reading proficiency
- 40% ▲ 5.00%
- Median HH income
- $67,671
- Composite
- 35.84/100
- National rank
- #9606
- State rank
- #8 of 32 in DC
Livability — Washington
- Score
- 73/100
- State rank
- #1
- US rank
- #5327
Category grades
Schools grade is shown separately in the Schools card above.
Census & demographics
- Census place
- Washington, DC
- County
- District of Columbia · 671,873 people
- City population
- 671,873
- Metro
- Washington-Arlington-Alexandria, DC-VA-MD-WV
- Population (ZIP)
- 40,920
- Household income
- $49,139
- Rent vs Own
- Severe rent burden
- 4530.0
Population outlook (District of Columbia County) Hauer SSP2
- Today (2025)
- 821,926 people
- By 2030
- 899,517 · +9.4%
- By 2040
- 1,061,162 · +29.1%
- By 2050
- 1,231,493 · +49.8%
- By 2075
- 1,603,312 · +95.1%
- By 2100
- 1,847,141 · +124.7%
Race, ethnicity, and origin ACS 2023
- Neighborhood character
- Predominantly Black (80%)
- Race & ethnicity
- Black 80% White 8% Two or more races 7% Hispanic / Latino 5%
- Foreign-born
- 4% · Canada
- Languages at home
- 95% English-only · Spanish 3%
Political lean MEDSL · District of Columbia
- 2024 margin
- Solid D (+86.1) · D 91.2% · R 5.1% · Other 3.8%
- 2008→2024 swing
- +0.1pp no change · 2008: 85.9pp · 2024: 86.1pp
- All cycles
- 2024: D+86.1 2020: D+86.8 2016: D+88.7 2012: D+84.2 2008: D+85.9
Not yet ingested
- Civics
- —
Market trends
- HPI YoY
- ▼ -60.34%
- Current HPI
- 326.4077
- Rent YoY
- ▲ 3.96%
- Metro
- Washington-Arlington-Alexandria, DC-VA-MD-WV
- State GDP YoY
- ▲ 1.33%
- F500 in state
- 6
Industry mix (Fortune 500 HQ in DC)
| Industry | F500 HQs | Revenue |
|---|---|---|
| Financial Services | 1 | $153B |
|
||
| Life Sciences / Industrials | 1 | $25B |
|
||
| Industrial Machinery | 1 | $8B |
|
||
Price history
+404.7% since first listed18 events — show timeline
- 2026-04-30 Price Changed $259,900 BRIGHT MLS
- 2026-03-24 Price Changed $269,900 BRIGHT MLS
- 2026-02-25 Price Changed $279,900 BRIGHT MLS
- 2026-01-12 Price Changed $299,900 BRIGHT MLS
- 2025-12-01 Price Changed $349,900 BRIGHT MLS
- 2025-11-04 Listed $369,900 BRIGHT MLS
- 2025-07-20 Listing Removed — BRIGHT MLS
- 2024-12-19 Listed $410,000 BRIGHT MLS
- 2020-07-16 Listing Removed — BRIGHT MLS
- 2020-07-13 Listed $250,000 BRIGHT MLS
- 2004-04-30 Sold (Public Records) $199,900 Public Records
- 2004-04-16 Sold (MLS) $199,900 MRIS
- 2004-04-02 Delisted — MRIS
- 2004-03-05 Listed $199,900 MRIS
- 2003-08-18 Delisted — MRIS
- 2003-07-03 Listed — MRIS
- 2003-02-11 Sold (Public Records) $75,247 Public Records
- 1979-04-23 Sold (Public Records) $51,500 Public Records
Property tax history
+24.5%/yrLatest (2025): $19,606 · -1.4% YoY. Source: county tax records.
Cash-flow waterfall
monthlySold comps — $/sqft
last 12 mo · ≤1 miLoading sold comps…