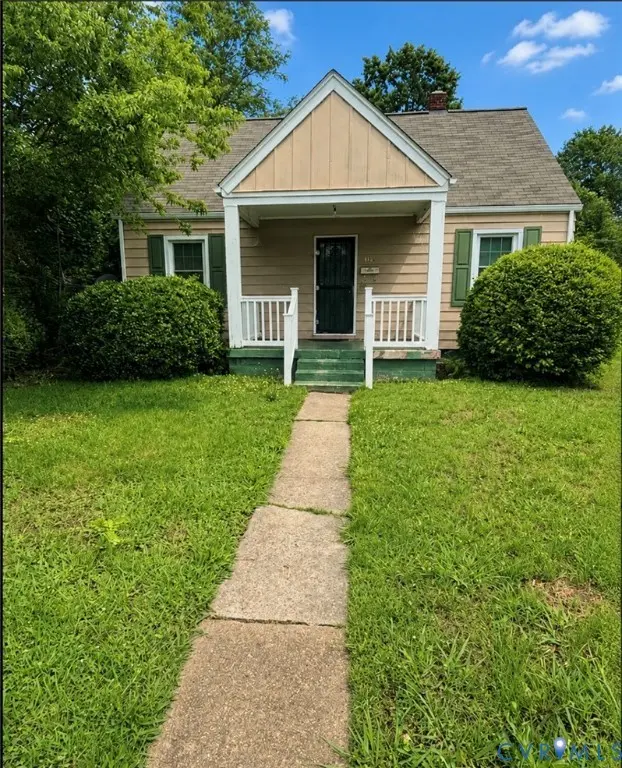
1114 E 16th St · Richmond, VA
Flood risk 5/10 · Moderate
- FEMA flood zone
- X (unshaded)
- Chance of flooding over 30 yrs
- 0.48%
- Est. flood insurance / yr
- $473 – $860
Fire risk 3/10 · Minor
- Est. fire insurance / yr
- $666 – $1,236
Heat risk 8/10 · Major
- Hot days now (above 105°F)
- 7 days/yr
- Hot days in 30 yrs
- 16 days/yr
Wind risk 6/10 · Moderate
- Chance of severe wind over 30 yrs
- 27.0%
Air-quality risk 2/10 · Minimal
- Unhealthy air days now
- 1 days/yr
- Unhealthy air days in 30 yrs
- 2 days/yr
Risk factors via First Street. Map © Google.
Why this score? — see what drove the B- grade
The composite is a weighted blend of 9 inputs, each scored 0–100. Each bar is that input's sub-score; the figure is the points it added to the 100-point composite (weight × sub-score).
- Cash flow +25.2/30.0
- ARV discount +15.0/15.0
- DSCR +8.2/10.0
- 1% rule +5.9/10.0
- Livability +4.2/5.0
- Rent growth +3.6/5.0
- Schools +3.3/10.0
- Condition / age +2.5/5.0
- Appreciation +0.0/10.0
$165,000
🖨 Deal sheet (PDF) 📄 Offer letter ✓ Due diligence
Listing remarks
Calling all Buyers and or Investors!! Opportunity knocks at 1114 East 16th Street — 4-bedroom, 1-bath home that offers a basement in Richmond’s Oak Grove community, priced to sell. This property has a a brand-new roof, new HVAC system, energy-efficient replacement windows, and an updated bathroom are already in place. Professional mold remediation and licensed asbestos abatement have been completed and fully documented. Safety rails are installed at both the front and rear entrances. Set on a 5,000-square-foot lot with 1,165 square feet of living space.
Key facts
- Brand-new roof
- Updated bathroom
- New hvac system
Tags
Property features AI
Exterior
- Utilities: Public water; Public sewer
- Home design: Single-story property; R-5 zoning
- Construction: Built with block and wood siding; Composition roof; Approximate year built
- Exterior features: Public sewer; Public water
Interior
- Bedrooms: Bedroom on second level
- Bathrooms: 1 full bathroom (shower in full bath)
- Heating & cooling: Central air conditioning; Heating via electric, heat pump, and natural gas
- Interior features: Partial basement; 7 total rooms
Neighborhood map
What this means for you Summary
Snapshot
- This is a 3-bed/1.0-bath single-family listed at $165k.
Deal economics
- At list price, monthly cash flow is $367 ($4k/yr) — positive.
- The deal already cash-flows at list — no discount required.
- Meets the 1% rule at list price ($2k rent vs $165k).
- Cap rate 9.0% vs local median 3.2% in Richmond — top-decile yield for the area; either an underpriced asset or a hidden risk that comps aren't pricing in. Stress-test before assuming the spread holds.
Location & tenants
- Location reads 84/100 on livability (#33 in VA, #793 nationally) — a professional / high-income tenant draw. Strengths: amenities A+, commute A+, health & safety A+; Watch: crime D-.
- Richmond City Public School District (urban): math 32% / reading 47% proficiency, ranked #123 of 131 in VA (top 94%) — families likely to look elsewhere, expect single-tenant / working-renter base with shorter leases; 74% free/reduced lunch — lower-income household profile, screen leases tightly.
- Zoned schools: Broad Rock Elementary (math 5% / reading 24%, grade F, #1,098 of 1,108 statewide, top 100%, 634 students, 99% FRL); Thomas C. Boushall Middle (math 12% / reading 27%, grade F, #340 of 342 statewide, top 99%, 611 students, 98% FRL); George Wythe High (math 12% / reading 37%, grade F, #319 of 319 statewide, top 100%, 1,309 students, 91% FRL) — zoned schools average 96% FRL vs 74% district-wide (22 pts higher); higher-poverty schools than district average — tighter screening recommended.
- Zoned-school proficiency averages 20% at this address vs 40% district-wide (-20 pts) — the specific schools serving this property underperform the Richmond City Public School District average; the district grade overstates school quality for this exact location.
- Market conditions: Rents rising fast (+4.5%/yr); 177 active listings in the ZIP; 40 comparable units currently listed for rent nearby; rentals leasing fast (median 7d on market — plan ~1-2 weeks tenant-placement turnaround); 2,540 units permitted in Richmond city in 2024 (2,077 in 5+ unit buildings).
- This rent runs 43% of the median local income ($50k/yr) — at the standard rent-burdened threshold; future hikes will face affordability resistance.
Forward outlook
- Local home prices are declining (-3.0%/yr); year-one equity from $1k of loan paydown is wiped out by about $5k of value loss. Plan a longer hold.
- Richmond County population projected at +40% by 2050 — long-run rental-demand tailwind backs the buy-and-hold thesis.
- At projected returns (-3.0% appreciation + 4.5% rent growth), your $46k cash investment doubles in ~10 years — after that, you're playing with house money.
Negotiation context
- Only 4 days on market — expect competitive offers; lowballing is unlikely to land.
- Current owner paid $46k; list at $165k implies a 259% gain — meaningful room to come down on a strong offer.
Risks & watch-outs
- Watch-outs: built in 1947 — expect roof / HVAC / electrical / plumbing capex.
- Climate carrying-cost: moderate flood risk; major wind risk, 27% chance of damaging wind over 30y; extreme-heat days projected 7→16/yr by 2055 (HVAC capex compounding) — expect insurance premiums to compound above CPI over the hold.
Questions for the listing agent
- Built in 1947 — when were the roof, HVAC, electrical panel, plumbing, and water heater last replaced?
- Is there a deadline driving the sale (1031 exchange, divorce, estate, relocation)? That informs how much negotiation room exists.
- Schools are A-rated — typically a magnet for longer-tenancy family renters. What's the average tenant stay here, and is there a school-zone premium baked into asking?
- Crime grade is D in this area — have there been break-ins, vandalism, or insurance claims at this property in the last 3 years? What carrier currently insures it and at what premium?
- What's the average days-on-market for RENTAL listings here right now (not sales)? A rising rental-DOM trend means longer vacancies and softer asking-rent achievability than the comps imply.
- What's the recent tenant-quality profile in this submarket — average credit score on applications, eviction rate, late-payment / NSF rate, and stable-employment percentage? A property-management company in the area should have these aggregated.
- How much new for-sale + rental construction is in the pipeline within 1–3 miles? Heavy new supply typically softens prices + rents 12–24 months out; constrained supply supports both.
Investment metrics
- 1% rule
- 1.09% ✓
- Cap rate
- 8.96%
- Cash-on-cash
- 9.54%
- DSCR
- 1.42
- GRM
- 7.6
CMA / ARV
- ARV (on-the-fly)
- $242,320
- Comps found
- 12
Show comp detail 12 sales within ~0.75 mi
| Address | Dist | Beds/Ba | Sqft | Sold | Price | $/sf | Match |
|---|---|---|---|---|---|---|---|
| 1100 E 16th St | 0.06mi | 3/1.0 | 1,136 (-2%) | 3mo | $237,000 | $209 | 91 |
| 2010 Gordon Ave | 0.27mi | 3/2.0 | 1,164 (-0%) | 1mo | $260,200 | $224 | 83 |
| 1200 E 17th St | 0.05mi | 2/1.0 (-1) | 1,080 (-7%) | 1mo | $175,000 | $162 | 79 |
| 2004 Edwards Ave | 0.31mi | 3/2.0 | 1,136 (-2%) | 1mo | $225,000 | $198 | 77 |
| 2008 Ingram Ave | 0.26mi | 3/1.5 | 1,232 (+6%) | 3mo | $285,000 | $231 | 74 |
| 2115 Dinwiddie Ave | 0.44mi | 3/2.0 | 1,106 (-5%) | 2mo | $230,000 | $208 | 65 |
| 1809 Gordon Ave | 0.20mi | 4/2.0 (+1) | 1,260 (+8%) | 5mo | $220,000 | $175 | 64 |
| 1912 Chicago Ave | 0.38mi | 3/1.0 | 1,280 (+10%) | 2mo | $150,000 | $117 | 64 |
| 2004 Gordon Ave | 0.25mi | 3/1.5 | 1,291 (+11%) | 6mo | $360,000 | $279 | 63 |
| 1405 Silver Ave | 0.69mi | 3/1.0 | 1,181 (+1%) | 7mo | $180,000 | $152 | 60 |
| 1817 Keswick Ave | 0.28mi | 3/1.5 | 1,335 (+15%) | 4mo | $287,000 | $215 | 58 |
| 2303 Fairfax Ave | 0.48mi | 3/1.0 | 1,319 (+13%) | 6mo | $250,000 | $190 | 51 |
Match score weights: distance 35% · size 25% · config 20% · recency 20%. Top-matched comps best support the ARV.
Projected returns pro-forma
-3.0% appreciation · 4.55% rent growth · sell at horizon
- IRR
- -0.3%
- Equity multiple
- 0.99×
- Total profit
- $-536
- Equity at exit
- $24,602
- IRR
- 10.8%
- Equity multiple
- 1.90×
- Total profit
- $41,589
- Equity at exit
- $14,266
Cash invested: $46,200 (down + closing). Projections, not guarantees.
Landlord ↔ Tenant lean methodology
- Overall (STATE)
- 55 Moderately Landlord-Leaning
- State Virginia
- 55 Moderately Landlord-Leaning · D+2
- County
- — inherits STATE
- City
- — inherits STATE
ZIP-level market 23224
- Rents YoY
- 4.5%
- Active inventory
- 177
- Price-to-rent
- 7.6×
Monthly cashflow live
- Estimated rent
- $1,798 high interval (Pro) →
- Mortgage (P&I)
- −$865
- Tax from tax record
- −$119 /mo · $1,428/yr
- Insurance
- −$69
- HOA
- −$0
- Lot rent
- −$0
- Vacancy / Maint / Mgmt
- −$378
- Net cashflow
- $367
Break-even live
Sensitivity live
| Price | -10% $461 | -5% $414 | +0% $367 | +5% $320 | +10% $274 |
|---|---|---|---|---|---|
| Rent | -10% $225 | -5% $296 | +0% $367 | +5% $438 | +10% $509 |
| Rate | -1.0pp $450 | -0.5pp $409 | base $367 | +0.5pp $324 | +1.0pp $281 |
UW: 25.0% down · 7.5% · 30yr · 1.5% tax · 5.0% vac · 8.0% maint · 8.0% mgmt
Financing live
Cash to close
- Down payment
- $41,250
- Closing costs
- $4,950
- Reserves months
- —
- Total cash needed
- —
Loan-product check · same deal, 3 products live
Conventional
25% down · 7.5% · 30yr
- Down + closing
- —
- Monthly P&I
- —
- Monthly cashflow
- —
- DSCR
- —
- Eligible?
- —
Personal DTI + credit; lowest rate.
DSCR
20% down · 8.5% · 30yr
- Down + closing
- —
- Monthly P&I
- —
- Monthly cashflow
- —
- DSCR
- —
- Eligible?
- —
No personal income docs; deal must DSCR.
Hard money
10% down · 12.0% · 12mo
- Down + closing
- —
- Monthly P&I
- —
- Monthly cashflow
- —
- DSCR
- —
- Eligible?
- —
Short-term bridge; refi at stabilization.
Rent comps 40 comps
| Address | Beds | Baths | Sqft | Rent | $/sqft | DOM | Units | Dist |
|---|---|---|---|---|---|---|---|---|
| 1112 E 16th St Richmond, VA | 4.0 | 1.0 | 1206 | $1,595 | $1.32 | 46d | 1 | 0.02mi |
| 1808 Edwards Ave Richmond, VA | 3.0 | 2.0 | 1040 | $1,750 | $1.68 | 26d | 1 | 0.28mi |
| 1125 Commerce Rd Richmond, VA | 1.0–2.0 | 1.0–1.5 | 685 | $1,409 | $2.06 | 6d | 5 | 0.31mi |
| 1913 Dinwiddie Ave Unit 1546196P Richmond, VA | 2.0 | 1.0 | 1044 | $2,519 | $2.41 | 17d | 1 | 0.37mi |
| 1707 Chicago Ave Richmond, VA | 2.0 | 1.0 | 750 | $995 | $1.33 | 46d | 1 | 0.37mi |
| 622 E 18th St Richmond, VA | 2.0 | 1.0 | 850 | $995 | $1.17 | 46d | 1 | 0.37mi |
| 1801 Chicago Ave Richmond, VA | 2.0 | 1.0 | 850 | $995 | $1.17 | 26d | 1 | 0.38mi |
| 2200 Ingram Ave Richmond, VA | 2.0 | 1.0–2.0 | 711 | $1,668 | $2.35 | 7d | 1 | 0.40mi |
| 2208 Keswick Ave Richmond, VA | 3.0 | 1.0 | 916 | $1,775 | $1.94 | 23d | 1 | 0.45mi |
| 1305 Chambers St Richmond, VA | 2.0 | 1.0 | 966 | $1,100 | $1.14 | 26d | 1 | 0.50mi |
| 800 Richmond Hwy Richmond, VA | 1.0–2.0 | 1.0–2.0 | 778 | $2,044 | $2.63 | 46d | 1 | 0.55mi |
| 2010 Maury St Richmond, VA | 2.0 | 1.0 | 883 | $1,675 | $1.90 | 7d | 1 | 0.56mi |
| 1709 Everett St Richmond, VA | 4.0 | 1.5 | 1460 | $1,995 | $1.37 | 46d | 1 | 0.60mi |
| 1021 E 4th St Richmond, VA | 1.0–2.0 | 1.0–2.0 | 759 | $1,449 | $1.91 | 4d | 87 | 0.62mi |
| 1100 Richmond Hwy Richmond, VA | 1.0–3.0 | 1.0–2.0 | 1062 | $2,345 | $2.21 | 0d | 16 | 0.66mi |
| 116 E 15th St Richmond, VA | 4.0 | 2.0 | 1452 | $2,250 | $1.55 | 26d | 1 | 0.67mi |
| 700 Everett St Richmond, VA | 1.0–2.0 | 1.0–2.0 | 809 | $1,849 | $2.28 | 7d | 14 | 0.70mi |
| 1410 Enfield Ave Unit 1410 Richmond, VA | 3.0 | 1.0 | 912 | $1,500 | $1.64 | 46d | 1 | 0.71mi |
| 700 Stockton St Richmond, VA | 1.0–2.0 | 1.0 | 1035 | $1,805 | $1.74 | 4d | 31 | 0.77mi |
| 500 Maury St Richmond, VA | 2.0 | 1.0–2.0 | 665 | $2,295 | $3.45 | 6d | 17 | 0.77mi |
| 500 Stockton St Richmond, VA | 1.0–2.0 | 1.0–2.0 | 748 | $1,346 | $1.80 | 6d | 16 | 0.85mi |
| 1422 Bainbridge St Richmond, VA | 2.0 | 2.0 | 1121 | $2,399 | $2.14 | 0d | 1 | 0.85mi |
| 1514 Bainbridge St Unit A Richmond, VA | 2.0 | 1.0 | 800 | $1,299 | $1.62 | 14d | 1 | 0.86mi |
| 1203 Bainbridge St Apt A Richmond, VA | 2.0 | 2.0 | 927 | $1,495 | $1.61 | 46d | 1 | 0.91mi |
| 1207 Bainbridge St Richmond, VA | 2.0 | 2.0 | 937 | $2,250 | $2.40 | 14d | 1 | 0.91mi |
| 403 Stockton St Richmond, VA | 1.0–3.0 | 1.0–2.0 | 882 | $2,140 | $2.42 | 6d | 22 | 0.94mi |
| 616 Hull St Richmond, VA | 1.0–2.0 | 1.0–2.0 | 756 | $1,495 | $1.98 | 7d | 5 | 0.94mi |
| 501 Decatur St Richmond, VA | 1.0–2.0 | 1.0–2.0 | 668 | $1,849 | $2.77 | 4d | 7 | 0.95mi |
| 1212 Porter St Apt A Richmond, VA | 2.0 | 2.0 | 980 | $1,995 | $2.04 | 7d | 1 | 0.96mi |
| 907 Bainbridge St Unit A Richmond, VA | 2.0 | 2.0 | 927 | $1,995 | $2.15 | 46d | 1 | 0.96mi |
| 201 Cowardin Ave Unit B Richmond, VA | 2.0 | 2.5 | 1436 | $2,200 | $1.53 | 46d | 1 | 0.97mi |
| 1912 Porter St Richmond, VA | 3.0 | 1.5 | 1415 | $1,950 | $1.38 | 26d | 1 | 0.97mi |
| 307 Stockton St Richmond, VA | 1.0–2.0 | 1.0–2.0 | 853 | $1,722 | $2.02 | 4d | 27 | 0.97mi |
| 1411 Porter St Unit B Richmond, VA | 3.0 | 3.0 | 1500 | $2,145 | $1.43 | 7d | 1 | 0.97mi |
| 15 W 7th St Richmond, VA | 1.0–3.0 | 1.0–2.5 | 881 | $3,031 | $3.44 | 4d | 6 | 0.98mi |
| 21 E 4th St Richmond, VA | 2.0 | 1.0–2.0 | 700 | $2,028 | $2.90 | 4d | 12 | 1.02mi |
| 84 W 6th St Richmond, VA | 3.0 | 2.0 | 1493 | $2,715 | $1.82 | 6d | 1 | 1.02mi |
| 103 E 2nd St Richmond, VA | 2.0 | 1.0–2.0 | 820 | $2,340 | $2.85 | 4d | 18 | 1.03mi |
| 104 E 2nd St Richmond, VA | 1.0–2.0 | 1.0–2.0 | 750 | $1,575 | $2.10 | 5d | 3 | 1.04mi |
| 908 Perry St Richmond, VA | 1.0–2.0 | 1.0–2.0 | 696 | $1,695 | $2.44 | 7d | 6 | 1.07mi |
Listing history 5 events
-
2026-06-03statusdays on market $165,000 Pending 4 DOM
-
2026-06-02days on market $165,000 Active 3 DOM
-
2026-06-01days on market $165,000 Active 2 DOM
-
2026-05-31remarks 559-char remark
-
2026-05-31$165,000 Active 1 DOM
ⓘ Source: listings_history table (triggers on properties + properties_extension) + one-shot
backfill from property_details.listing_events for pre-trigger history.
Tax reassessment forecast VA · Resets to sale price
- Current annual tax
- $1,428 · $119/mo
- Projected year-2 tax
- $1,428 · $119/mo
- Expected delta
- $0/yr ($0/mo · 0.0%)
ⓘ Screening estimate from a state-policy table — verify with the county assessor before closing.
Climate risk First Street
- Flood 5/10 Major FEMA zone X (unshaded) · 48% chance over 30 yrs
- Wildfire 3/10 Moderate
- Heat 8/10 Severe 7 d/yr ≥105°F today · 16 d/yr by 30 yrs out
- Wind 6/10 Major 27% chance of damaging wind over 30 yrs
- Air quality 2/10 Low 1 unhealthy d/yr today · 2 by 30 yrs out
Nearby sold comps map
Loading sold comps map…
Walkable amenities ~0.75 mi
Loading nearby amenities…
Taxation est. · year 1
- Rental income
- $21,572
- − Mortgage interest
- −$9,243
- − Property taxes
- −$1,428
- − Insurance
- −$825
- − Repairs & maintenance
- −$1,726
- − Management
- −$1,726
- − Depreciation
- −$4,800
- Taxable income
- $1,825
- Est. tax owed @ 24.0%
- −$438
- After-tax cash flow
- $3,967/yr
For passive investors: Depreciation is non-cash, so a rental often shows a tax loss while cash-flowing — sheltering income. Rental losses are passive: they offset passive income freely, and up to $25,000/yr can offset ordinary (W-2) income if you actively participate and your MAGI is under $100k (phasing out to $0 by $150k); unused losses carry forward. On sale, claimed depreciation is recaptured at up to 25%, and gains may owe capital-gains tax (a 1031 exchange can defer both). Figures are a year-1 estimate at your 24.0% rate — not tax advice; consult a CPA.
Schools (NCES district)
- District
- Richmond City Public School District
- NCES district ID
- 5103240
- Math proficiency
- 32% ▼ -24.00%
- Reading proficiency
- 47% ▼ -9.00%
- Median HH income
- $40,276
- Composite
- 33.09/100
- National rank
- #5564
- State rank
- #123 of 131 in VA
Livability — Richmond
- Score
- 84/100
- State rank
- #33
- US rank
- #793
Category grades
Schools grade is shown separately in the Schools card above.
Census & demographics
- Census place
- Richmond, VA
- County
- Richmond City · 178,280 people
- City population
- 287,109
- Metro
- Richmond, VA
- Population (ZIP)
- 40,575
- Household income
- $50,475
- Rent vs Own
- Severe rent burden
- 3584.0
Population outlook (Richmond County) Hauer SSP2
- Today (2025)
- 262,263 people
- By 2030
- 284,503 · +8.5%
- By 2040
- 327,353 · +24.8%
- By 2050
- 367,946 · +40.3%
- By 2075
- 449,560 · +71.4%
- By 2100
- 500,301 · +90.8%
Race, ethnicity, and origin ACS 2023
- Neighborhood character
- Diverse neighborhood (Simpson 0.58)
- Race & ethnicity
- Black 59% Hispanic / Latino 22% White 15% Two or more races 6%
- Hispanic origin (detail)
- Mexican 5% Puerto Rican 2%
- Common ancestry
- Romanian 1% Lithuanian 1% Serbian 1%
- Foreign-born
- 17% · Canada
- Languages at home
- 78% English-only · Spanish 19% French/Haitian/Cajun 1%
Political lean MEDSL · Richmond
- 2024 margin
- Solid D (+66.3) · D 82.0% · R 15.8% · Other 2.2%
- 2008→2024 swing
- +7.2pp toward D · 2008: 59.1pp · 2024: 66.3pp
- All cycles
- 2024: D+66.3 2020: D+68.0 2016: D+63.8 2012: D+55.7 2008: D+59.1
Not yet ingested
- Civics
- —
Market trends
- HPI YoY
- ▼ -283.99%
- Current HPI
- 336.9345
- Rent YoY
- ▲ 4.55%
- Metro
- Richmond, VA
- State GDP YoY
- ▲ 2.40%
- F500 in state
- 50
Industry mix (Fortune 500 HQ in VA)
| Industry | F500 HQs | Revenue |
|---|---|---|
| Aerospace / Defense | 4 | $236B |
|
||
| Technology / Defense | 3 | $32B |
|
||
| Financial Services | 2 | $176B |
|
||
| Utilities | 2 | $27B |
|
||
| Insurance | 2 | $25B |
|
||
| Technology | 2 | $15B |
|
||
Price history
+453.7% since first listed3 events — show timeline
- 2026-05-30 Listed $165,000 CVRMLS
- 1992-10-01 Sold (Public Records) $46,000 Public Records
- 1978-06-13 Sold (Public Records) $29,800 Public Records
Property tax history
-3.6%/yrLatest (2022): $1,428 · +67.6% YoY. Source: county tax records.
Cash-flow waterfall
monthlySold comps — $/sqft
last 12 mo · ≤1 miLoading sold comps…