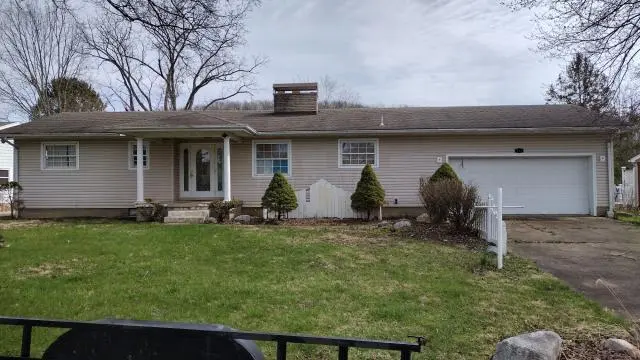
272 Whittier Dr N · Lancaster, OH
Flood risk 1/10 · Minimal
- FEMA flood zone
- X (unshaded)
- Chance of flooding over 30 yrs
- 0.0%
- Est. flood insurance / yr
- $473 – $860
Fire risk 1/10 · Minimal
- Est. fire insurance / yr
- $713 – $1,323
Heat risk 3/10 · Minor
- Hot days now (above 100°F)
- 7 days/yr
- Hot days in 30 yrs
- 18 days/yr
Wind risk 2/10 · Minimal
- Chance of severe wind over 30 yrs
- 0.0%
Air-quality risk 2/10 · Minimal
- Unhealthy air days now
- 1 days/yr
- Unhealthy air days in 30 yrs
- 2 days/yr
Risk factors via First Street. Map © Google.
Why this score? — see what drove the D+ grade
The composite is a weighted blend of 9 inputs, each scored 0–100. Each bar is that input's sub-score; the figure is the points it added to the 100-point composite (weight × sub-score).
- Cash flow +15.0/30.0
- ARV discount +7.5/15.0
- 1% rule +5.0/10.0
- DSCR +5.0/10.0
- Livability +4.3/5.0
- Rent growth +3.8/5.0
- Schools +3.7/10.0
- Condition / age +2.5/5.0
- Appreciation +0.0/10.0
$37,877
🖨 Deal sheet 📄 Offer letter ✓ Due diligence
Listing remarks MLS
NICE IN LANCASTER CLOSE TO RT 33 & MALL. HUGE FAM W/ WET BAR, 3BR, 2BA, 2 FP`SCOVERED PATIO- CLOSE ELEM. SCHOOL. DINETTE OFF END OF LIV. RM.
Key facts
- 0.31 acre lot
- 2 garage spots
- Built 1964
Neighborhood map
What this means for you Summary
Snapshot
- This is a 3-bed/2.0-bath single-family listed at $38k.
Deal economics
- At list price, monthly cash flow is $1k ($13k/yr) — positive.
- The deal already cash-flows at list — no discount required.
- Meets the 1% rule at list price ($2k rent vs $38k).
- Cap rate 41.0% vs local median 4.0% in Lancaster — top-decile yield for the area; either an underpriced asset or a hidden risk that comps aren't pricing in. Stress-test before assuming the spread holds.
Location & tenants
- Location reads 86/100 on livability (#41 in OH, #423 nationally) — a professional / high-income tenant draw. Strengths: amenities A+, cost of living A+, housing A+; Watch: crime D, employment D.
- Lancaster City (town): math 38% / reading 51% proficiency, ranked #504 of 656 in OH (top 77%) — families likely to look elsewhere, expect single-tenant / working-renter base with shorter leases.
- Market conditions: Rents rising fast (+5.2%/yr); 204 active listings in the ZIP; 2 comparable units currently listed for rent nearby; 475 units permitted in Fairfield County in 2024 (0 in 5+ unit buildings).
Forward outlook
- Local home prices are declining (-3.0%/yr); year-one equity from $262 of loan paydown is wiped out by about $1k of value loss. Plan a longer hold.
- Fairfield County population projected at +8% by 2050 — modest demand growth; plan on rents tracking national, not racing it.
- At projected returns (-3.0% appreciation + 5.2% rent growth), your $11k cash investment doubles in ~1 year — after that, you're playing with house money.
Negotiation context
- Only 1 days on market — expect competitive offers; lowballing is unlikely to land.
- 2 sale attempts since 25y ago with the ask held roughly flat each time — persistent listings suggest the price (not the market) is what's stuck; bring a comps-based counter.
Questions for the listing agent
- Built in 1964 — when were the roof, HVAC, electrical panel, plumbing, and water heater last replaced?
- Is there a deadline driving the sale (1031 exchange, divorce, estate, relocation)? That informs how much negotiation room exists.
- Crime grade is D in this area — have there been break-ins, vandalism, or insurance claims at this property in the last 3 years? What carrier currently insures it and at what premium?
- The area grade is low — what's the realistic commute time and amenity access for the typical tenant pool here? Any planned neighborhood developments (good or bad) we should know about?
- What's the average days-on-market for RENTAL listings here right now (not sales)? A rising rental-DOM trend means longer vacancies and softer asking-rent achievability than the comps imply.
- What's the recent tenant-quality profile in this submarket — average credit score on applications, eviction rate, late-payment / NSF rate, and stable-employment percentage? A property-management company in the area should have these aggregated.
- How much new for-sale + rental construction is in the pipeline within 1–3 miles? Heavy new supply typically softens prices + rents 12–24 months out; constrained supply supports both.
Investment metrics
- 1% rule
- 4.53% ✓
- Cap rate
- 40.97%
- Cash-on-cash
- 123.85%
- DSCR
- 6.51
- GRM
- 1.8
CMA / ARV
- ARV (on-the-fly)
- $272,064
- Comps found
- 12
Show comp detail 12 sales within ~0.75 mi
| Address | Dist | Beds/Ba | Sqft | Sold | Price | $/sf | Match |
|---|---|---|---|---|---|---|---|
| 218 Marvel Dr | 0.06mi | 3/1.5 | 1,293 (-1%) | 8mo | $283,000 | $219 | 87 |
| 2018 Coldspring Dr | 0.10mi | 3/1.5 | 1,412 (+8%) | 6mo | $288,000 | $204 | 75 |
| 1822 Wacker Dr | 0.38mi | 3/2.0 | 1,274 (-3%) | 9mo | $265,000 | $208 | 70 |
| 1866 N Columbus St | 0.33mi | 3/1.5 | 1,288 (-2%) | 18mo | $220,000 | $171 | 65 |
| 1845 N Columbus St | 0.38mi | 3/2.0 | 1,221 (-7%) | 11mo | $279,000 | $229 | 62 |
| 1771 Wacker Dr | 0.48mi | 3/1.5 | 1,305 (-0%) | 16mo | $299,900 | $230 | 62 |
| 1789 Wacker Dr | 0.45mi | 3/1.5 | 1,142 (-13%) | 3mo | $285,000 | $250 | 54 |
| 1835 Marrose Dr | 0.39mi | 3/2.0 | 1,502 (+15%) | 8mo | $237,000 | $158 | 50 |
| 1783 Glenmar Dr | 0.47mi | 3/1.5 | 1,174 (-10%) | 11mo | $292,500 | $249 | 50 |
| 1700 N Columbus St | 0.59mi | 3/2.0 | 1,445 (+10%) | 7mo | $270,000 | $187 | 49 |
| 120 Clarenden St | 0.70mi | 3/2.0 | 1,221 (-7%) | 14mo | $227,000 | $186 | 44 |
| 1539 N Columbus St | 0.69mi | 2/1.5 (-1) | 1,342 (+3%) | 16mo | $213,000 | $159 | 43 |
Match score weights: distance 35% · size 25% · config 20% · recency 20%. Top-matched comps best support the ARV.
Projected returns pro-forma
-3.0% appreciation · 5.22% rent growth · sell at horizon
- IRR
- —
- Equity multiple
- 7.37×
- Total profit
- $67,525
- Equity at exit
- $5,648
- IRR
- —
- Equity multiple
- 16.61×
- Total profit
- $165,509
- Equity at exit
- $3,275
Cash invested: $10,606 (down + closing). Projections, not guarantees.
Landlord ↔ Tenant lean methodology
- Overall (STATE)
- 73 Landlord-Friendly
- State Ohio
- 73 Landlord-Friendly · R+6
- County
- — inherits STATE
- City
- — inherits STATE
ZIP-level market 43130
- Rents YoY
- 5.2%
- Active inventory
- 204
- Price-to-rent
- 1.8×
Monthly cashflow live
- Estimated rent
- $1,717 medium interval (Pro) →
- Mortgage (P&I)
- −$199
- Tax est. 1.5%
- −$47 /mo · $568/yr
- Insurance
- −$16
- HOA
- −$0
- Vacancy / Maint / Mgmt
- −$361
- Net cashflow
- $1,095
Break-even live
UW: 25.0% down · 7.5% · 30yr · 1.5% tax · 5.0% vac · 8.0% maint · 8.0% mgmt
Financing live
Cash to close
- Down payment
- $9,469
- Closing costs
- $1,136
- Reserves months
- —
- Total cash needed
- —
Loan-product check · same deal, 3 products live
Conventional
25% down · 7.5% · 30yr
- Down + closing
- —
- Monthly P&I
- —
- Monthly cashflow
- —
- DSCR
- —
- Eligible?
- —
Personal DTI + credit; lowest rate.
DSCR
20% down · 8.5% · 30yr
- Down + closing
- —
- Monthly P&I
- —
- Monthly cashflow
- —
- DSCR
- —
- Eligible?
- —
No personal income docs; deal must DSCR.
Hard money
10% down · 12.0% · 12mo
- Down + closing
- —
- Monthly P&I
- —
- Monthly cashflow
- —
- DSCR
- —
- Eligible?
- —
Short-term bridge; refi at stabilization.
Rent comps 2 comps
| Address | Beds | Baths | Sqft | Rent | $/sqft | DOM | Units | Dist |
|---|---|---|---|---|---|---|---|---|
| 1733 Bellmeadow Dr Lancaster, OH | 1.0–3.0 | 1.0–2.5 | 993 | $1,855 | $1.87 | 1d | 10 | 0.59mi |
| 421 Washington Ave Lancaster, OH | 4.0 | 1.0 | 1296 | $1,650 | $1.27 | 12d | 1 | 1.50mi |
Listing history 8 events
-
2026-04-21status Pending
-
2026-04-13$37,877 Active
-
2026-04-13historical
-
2001-10-01soldstatus $157,000
-
2001-09-28soldstatus $157,000 145-char remark
Show marketing remark (145 chars)
NICE IN LANCASTER CLOSE TO RT 33 & MALL. HUGE FAM W/ WET BAR, 3BR, 2BA, 2 FP`SCOVERED PATIO- CLOSE ELEM. SCHOOL. DINETTE OFF END OF LIV. RM.
-
2001-08-14historical 145-char remark
Show marketing remark (145 chars)
NICE IN LANCASTER CLOSE TO RT 33 & MALL. HUGE FAM W/ WET BAR, 3BR, 2BA, 2 FP`SCOVERED PATIO- CLOSE ELEM. SCHOOL. DINETTE OFF END OF LIV. RM.
-
2001-07-27$159,500 145-char remark
Show marketing remark (145 chars)
NICE IN LANCASTER CLOSE TO RT 33 & MALL. HUGE FAM W/ WET BAR, 3BR, 2BA, 2 FP`SCOVERED PATIO- CLOSE ELEM. SCHOOL. DINETTE OFF END OF LIV. RM.
-
1991-08-02soldstatus $90,000
ⓘ Source: listings_history table (triggers on properties + properties_extension) + one-shot
backfill from property_details.listing_events for pre-trigger history.
Climate risk First Street
- Flood 1/10 Low FEMA zone X (unshaded) · 0% chance over 30 yrs
- Wildfire 1/10 Low
- Heat 3/10 Moderate 7 d/yr ≥100°F today · 18 d/yr by 30 yrs out
- Wind 2/10 Low 0% chance of damaging wind over 30 yrs
- Air quality 2/10 Low 1 unhealthy d/yr today · 2 by 30 yrs out
Nearby sold comps map
Loading sold comps map…
Walkable amenities ~0.75 mi
Loading nearby amenities…
Taxation est. · year 1
- Rental income
- $20,603
- − Mortgage interest
- −$2,122
- − Property taxes
- −$568
- − Insurance
- −$189
- − Repairs & maintenance
- −$1,648
- − Management
- −$1,648
- − Depreciation
- −$1,102
- Taxable income
- $13,326
- Est. tax owed @ 24.0%
- −$3,198
- After-tax cash flow
- $9,937/yr
For passive investors: Depreciation is non-cash, so a rental often shows a tax loss while cash-flowing — sheltering income. Rental losses are passive: they offset passive income freely, and up to $25,000/yr can offset ordinary (W-2) income if you actively participate and your MAGI is under $100k (phasing out to $0 by $150k); unused losses carry forward. On sale, claimed depreciation is recaptured at up to 25%, and gains may owe capital-gains tax (a 1031 exchange can defer both). Figures are a year-1 estimate at your 24.0% rate — not tax advice; consult a CPA.
Schools (NCES district)
- District
- Lancaster City
- NCES district ID
- 3904420
- Math proficiency
- 38% ▼ -21.00%
- Reading proficiency
- 51% ▼ -11.00%
- Median HH income
- $41,696
- Composite
- 37.39/100
- National rank
- #4427
- State rank
- #504 of 656 in OH
Livability — Lancaster
- Score
- 86/100
- State rank
- #41
- US rank
- #423
Category grades
Schools grade is shown separately in the Schools card above.
Census & demographics
- Census place
- Lancaster, OH
- County
- Fairfield County · 109,896 people
- City population
- 62,933
- Metro
- Columbus, OH
- Population (ZIP)
- 62,933
- Household income
- $72,153
- Rent vs Own
- Severe rent burden
- 1400.0
Population outlook (Fairfield County) Hauer SSP2
- Today (2025)
- 162,442 people
- By 2030
- 166,796 · +2.7%
- By 2040
- 172,835 · +6.4%
- By 2050
- 174,822 · +7.6%
- By 2075
- 174,938 · +7.7%
- By 2100
- 160,988 · -0.9%
Race, ethnicity, and origin ACS 2023
- Neighborhood character
- Predominantly White (91%)
- Race & ethnicity
- White 91% Two or more races 4% Hispanic / Latino 2% Black 2%
- Common ancestry
- Slovak 2% Italian 1% Iranian 1%
- Foreign-born
- 1% · Canada
- Languages at home
- 98% English-only · Spanish 1%
Political lean MEDSL · Fairfield
- 2024 margin
- Strong R (+24.1) · D 37.5% · R 61.6%
- 2008→2024 swing
- -6.9pp toward R · 2008: -17.1pp · 2024: -24.1pp
- All cycles
- 2024: R+24.1 2020: R+23.5 2016: R+27.0 2012: R+16.1 2008: R+17.1
Not yet ingested
- Civics
- —
Market trends
- HPI YoY
- ▼ -298.81%
- Current HPI
- 239.6352
- Rent YoY
- ▲ 5.22%
- Metro
- Columbus, OH
- State GDP YoY
- ▲ 1.98%
- F500 in state
- 48
Industry mix (Fortune 500 HQ in OH)
| Industry | F500 HQs | Revenue |
|---|---|---|
| Insurance | 3 | $145B |
|
||
| Industrial Machinery | 3 | $49B |
|
||
| Financial Services | 3 | $24B |
|
||
| Consumer Goods | 2 | $93B |
|
||
| Aerospace / Defense | 2 | $47B |
|
||
| Utilities | 2 | $33B |
|
||
Price history
-57.9% since first listed8 events — show timeline
- 2026-04-21 Pending — CBRMLS
- 2026-04-13 Listing Removed — CBRMLS
- 2026-04-13 Listed $37,877 CBRMLS
- 2001-10-01 Sold (Public Records) $157,000 Public Records
- 2001-09-28 Sold (MLS) $157,000 CBRMLS
- 2001-08-14 Listing Removed — CBRMLS
- 2001-07-27 Listed $159,500 CBRMLS
- 1991-08-02 Sold (Public Records) $90,000 Public Records
Property tax history
+8.7%/yrLatest (2025): $3,579 · -26.4% YoY. Source: county tax records.
Cash-flow waterfall
monthlySold comps — $/sqft
last 12 mo · ≤1 miLoading sold comps…