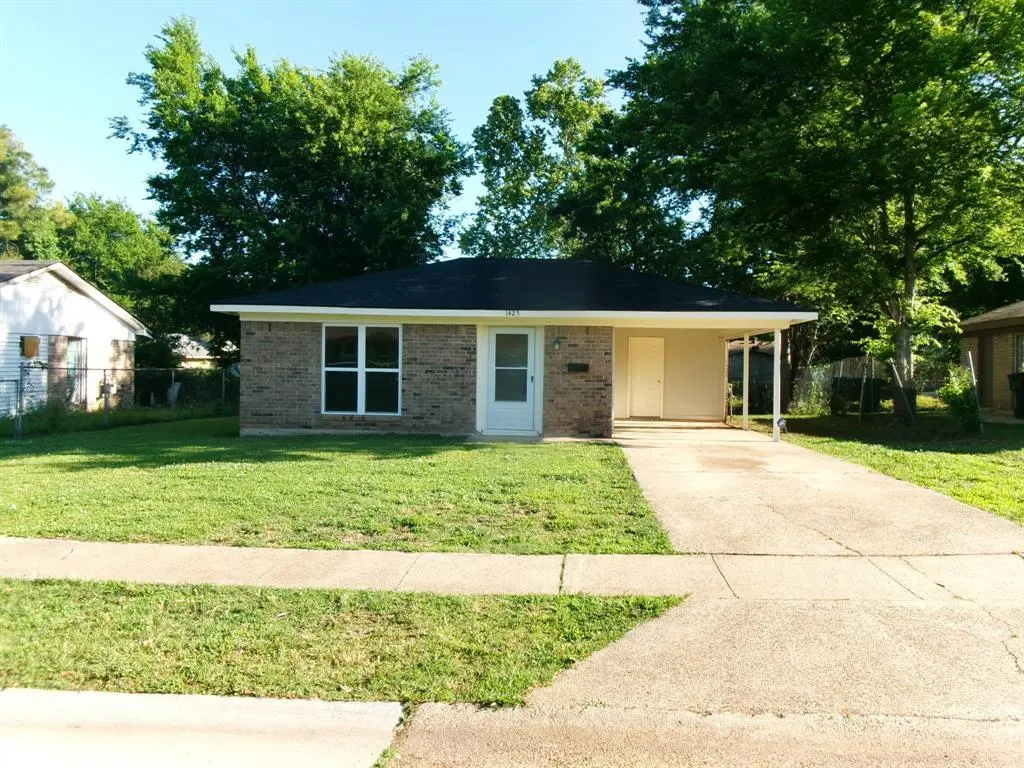
1425 Cynthia Ln · Bossier City, LA
Flood risk 6/10 · Moderate
- FEMA flood zone
- X (unshaded)
- Chance of flooding over 30 yrs
- 0.74%
- Est. flood insurance / yr
- $507 – $1,088
Fire risk 1/10 · Minimal
- Est. fire insurance / yr
- $1,269 – $2,357
Heat risk 7/10 · Major
- Hot days now (above 111°F)
- 7 days/yr
- Hot days in 30 yrs
- 22 days/yr
Wind risk 6/10 · Moderate
- Chance of severe wind over 30 yrs
- 68.0%
Air-quality risk 2/10 · Minimal
- Unhealthy air days now
- 1 days/yr
- Unhealthy air days in 30 yrs
- 2 days/yr
Risk factors via First Street. Map © Google.
Why this score? — see what drove the B- grade
The composite is a weighted blend of 9 inputs, each scored 0–100. Each bar is that input's sub-score; the figure is the points it added to the 100-point composite (weight × sub-score).
- Cash flow +29.5/30.0
- DSCR +10.0/10.0
- ARV discount +9.0/15.0
- 1% rule +7.4/10.0
- Schools +3.8/10.0
- Livability +3.6/5.0
- Rent growth +3.4/5.0
- Condition / age +2.5/5.0
- Appreciation +0.0/10.0
$113,000
🖨 Deal sheet 📄 Offer letter ✓ Due diligence
Listing remarks MLS
MOVE IN READY!! This is a HONEY STOP THE CAR property that has been remodeled throughout! Fresh paint, New Roof, New Carpet, New Flooring in Kitchen and Living Room! This property will make a great starter home, rental property, or an Airbnd. This house has great curb appeal and awaits new owners to make this property a home!
Key facts
- Efficient floor plan
- Gibson park
- Central bossier
Tags
Property features AI
Finance
- Other: Municipal utility district: No
- Financial info: Treat as clear loan type; No second mortgage; Property listed as real estate owned
- HOA & community: No association
Exterior
- Parking: Carport (1 covered/carport space)
- Utilities: City water; City sewer; Cable available
- Home design: Single family residence; One story; Residential property
- Construction: Brick construction; Asphalt roof; Slab foundation; Built in 1970
- Exterior features: Lot under 0.5 acre (approximately 0.135 acre); Subdivision: Gibson Park Sub
Interior
- Kitchen: Gas range
- Bedrooms: 3 bedrooms (primary bedroom on main level)
- Flooring: Carpet; Luxury vinyl plank
- Bathrooms: 1 full bathroom
- Heating & cooling: Central heating; Central air conditioning
- Interior features: Cable TV available; High-speed internet available; One living area; One dining area; 3 total rooms
- Laundry & utility: No specific laundry details provided
Neighborhood map
What this means for you Summary
Snapshot
- This is a 3-bed/1.0-bath single-family listed at $113k.
Deal economics
- At list price, monthly cash flow is $404 ($5k/yr) — positive.
- The deal already cash-flows at list — no discount required.
- Meets the 1% rule at list price ($1k rent vs $113k).
- Recommended offer: $111k (1.5% below list) — sets the bar for market timing.
- Cap rate 10.6% vs local median 4.7% in Bossier City — top-decile yield for the area; either an underpriced asset or a hidden risk that comps aren't pricing in. Stress-test before assuming the spread holds.
Location & tenants
- Location reads 71/100 on livability (#47 in LA) — a middle-class / working-renter tenant base. Strengths: commute A+, cost of living A+, housing A+; Watch: employment D+, crime F, amenities F.
- Bossier Parish (urban): math 40% / reading 47% proficiency, ranked #17 of 98 in LA (top 17%) — families likely to look elsewhere, expect single-tenant / working-renter base with shorter leases.
- Zoned schools: Bossier Elementary School (math 8% / reading 17%, grade F, #550 of 646 statewide, top 88%, 222 students, 93% FRL) — zoned schools average 93% FRL vs 41% district-wide (52 pts higher); higher-poverty schools than district average — tighter screening recommended.
- Zoned-school proficiency averages 12% at this address vs 44% district-wide (-31 pts) — the specific schools serving this property underperform the Bossier Parish average; the district grade overstates school quality for this exact location.
- Market conditions: Rents rising (+3.6%/yr); 145 active listings in the ZIP; 17 comparable units currently listed for rent nearby; rentals at typical pace (median 21d on market — plan ~3-4 weeks tenant-placement turnaround); 716 units permitted in Bossier Parish in 2024 (0 in 5+ unit buildings).
Forward outlook
- Local home prices are declining (-3.0%/yr); year-one equity from $781 of loan paydown is wiped out by about $3k of value loss. Plan a longer hold.
- Bossier County population projected at +28% by 2050 — long-run rental-demand tailwind backs the buy-and-hold thesis.
- At projected returns (-3.0% appreciation + 3.6% rent growth), your $32k cash investment doubles in ~8 years — after that, you're playing with house money.
Negotiation context
- It's been on market 15 days — a 2% lower offer ($111k) is reasonable based on typical stale-listing flexibility.
- 6 sale attempts since 3y ago with the ask held roughly flat each time — persistent listings suggest the price (not the market) is what's stuck; bring a comps-based counter.
- Current owner paid $88k; 29% above their basis — modest negotiation headroom, anchor on the comps not their cost.
Risks & watch-outs
- Climate carrying-cost: major flood risk; major wind risk, 68% chance of damaging wind over 30y; extreme-heat days projected 7→22/yr by 2055 (HVAC capex compounding) — expect insurance premiums to compound above CPI over the hold.
Questions for the listing agent
- Built in 1970 — when were the roof, HVAC, electrical panel, plumbing, and water heater last replaced?
- Is there a deadline driving the sale (1031 exchange, divorce, estate, relocation)? That informs how much negotiation room exists.
- Schools are B-rated — typically a magnet for longer-tenancy family renters. What's the average tenant stay here, and is there a school-zone premium baked into asking?
- Crime grade is F in this area — have there been break-ins, vandalism, or insurance claims at this property in the last 3 years? What carrier currently insures it and at what premium?
- What's the average days-on-market for RENTAL listings here right now (not sales)? A rising rental-DOM trend means longer vacancies and softer asking-rent achievability than the comps imply.
- What's the recent tenant-quality profile in this submarket — average credit score on applications, eviction rate, late-payment / NSF rate, and stable-employment percentage? A property-management company in the area should have these aggregated.
- How much new for-sale + rental construction is in the pipeline within 1–3 miles? Heavy new supply typically softens prices + rents 12–24 months out; constrained supply supports both.
Investment metrics
- 1% rule
- 1.24% ✓
- Cap rate
- 10.58%
- Cash-on-cash
- 15.32%
- DSCR
- 1.68
- GRM
- 6.7
CMA / ARV
- ARV (on-the-fly)
- $116,964
- Comps found
- 12
Show comp detail 12 sales within ~0.75 mi
| Address | Dist | Beds/Ba | Sqft | Sold | Price | $/sf | Match |
|---|---|---|---|---|---|---|---|
| 1333 Michael St | 0.42mi | 3/1.0 | 1,010 (-2%) | 6mo | $115,000 | $114 | 73 |
| 3204 Jana Pl | 0.24mi | 3/1.0 | 1,028 (+0%) | 19mo | $84,900 | $83 | 72 |
| 2545 Lamar St | 0.46mi | 2/1.0 (-1) | 1,051 (+2%) | 7mo | $99,900 | $95 | 64 |
| 3259 Sarah St | 0.19mi | 3/1.5 | 1,130 (+10%) | 11mo | $154,500 | $137 | 63 |
| 3314 Raleigh Pl | 0.38mi | 2/2.0 (-1) | 960 (-6%) | 2mo | $140,000 | $146 | 61 |
| 2639 Barbara St | 0.51mi | 3/1.0 | 1,119 (+9%) | 14mo | $89,520 | $80 | 50 |
| 1245 Dudley Ln | 0.70mi | 3/1.0 | 1,096 (+7%) | 8mo | $89,900 | $82 | 49 |
| 3001 Oliver St | 0.75mi | 3/1.0 | 1,094 (+7%) | 10mo | $125,000 | $114 | 46 |
| 3306 Raleigh Pl | 0.38mi | 3/2.0 | 1,159 (+13%) | 13mo | $167,000 | $144 | 46 |
| 3014 Norman Pl | 0.47mi | 3/1.0 | 1,124 (+10%) | 20mo | $139,900 | $124 | 45 |
| 1610 Donald Dr | 0.66mi | 3/1.0 | 1,176 (+15%) | 14mo | $59,000 | $50 | 33 |
| 2369 Julia St | 0.67mi | 2/1.0 (-1) | 1,160 (+13%) | 17mo | $65,000 | $56 | 27 |
Match score weights: distance 35% · size 25% · config 20% · recency 20%. Top-matched comps best support the ARV.
Projected returns pro-forma
-3.0% appreciation · 3.6% rent growth · sell at horizon
- IRR
- 6.6%
- Equity multiple
- 1.26×
- Total profit
- $8,243
- Equity at exit
- $16,849
- IRR
- 16.5%
- Equity multiple
- 2.38×
- Total profit
- $43,719
- Equity at exit
- $9,770
Cash invested: $31,640 (down + closing). Projections, not guarantees.
Landlord ↔ Tenant lean methodology
- Overall (STATE)
- 90 Strongly Landlord-Friendly
- State Louisiana
- 90 Strongly Landlord-Friendly · R+12
- County
- — inherits STATE
- City
- — inherits STATE
ZIP-level market 71112
- Rents YoY
- 3.6%
- Active inventory
- 145
- Price-to-rent
- 6.7×
Monthly cashflow live
- Estimated rent
- $1,396 high interval (Pro) →
- Mortgage (P&I)
- −$593
- Tax from tax record
- −$59 /mo · $713/yr
- Insurance
- −$47
- HOA
- −$0
- Vacancy / Maint / Mgmt
- −$293
- Net cashflow
- $404
Break-even live
UW: 25.0% down · 7.5% · 30yr · 1.5% tax · 5.0% vac · 8.0% maint · 8.0% mgmt
Financing live
Cash to close
- Down payment
- $28,250
- Closing costs
- $3,390
- Reserves months
- —
- Total cash needed
- —
Loan-product check · same deal, 3 products live
Conventional
25% down · 7.5% · 30yr
- Down + closing
- —
- Monthly P&I
- —
- Monthly cashflow
- —
- DSCR
- —
- Eligible?
- —
Personal DTI + credit; lowest rate.
DSCR
20% down · 8.5% · 30yr
- Down + closing
- —
- Monthly P&I
- —
- Monthly cashflow
- —
- DSCR
- —
- Eligible?
- —
No personal income docs; deal must DSCR.
Hard money
10% down · 12.0% · 12mo
- Down + closing
- —
- Monthly P&I
- —
- Monthly cashflow
- —
- DSCR
- —
- Eligible?
- —
Short-term bridge; refi at stabilization.
Rent comps 17 comps
| Address | Beds | Baths | Sqft | Rent | $/sqft | DOM | Units | Dist |
|---|---|---|---|---|---|---|---|---|
| 3204 McGregor St Bossier City, LA | 3.0 | 1.0 | 1093 | $1,350 | $1.24 | 44d | 1 | 0.18mi |
| 3202 Jana Pl Bossier City, LA | 3.0 | 1.0 | 1258 | $1,250 | $0.99 | 44d | 1 | 0.22mi |
| 1416 Williamsburg Dr Bossier City, LA | 2.0 | 2.0 | 960 | $1,200 | $1.25 | 13d | 1 | 0.44mi |
| 1301 Williamsburg Dr Bossier City, LA | 1.0–3.0 | 1.0–2.0 | 1025 | $1,655 | $1.61 | 13d | 28 | 0.50mi |
| 1302 Williamsburg Dr Bossier City, LA | 1.0–3.0 | 1.0–2.0 | 1050 | $1,720 | $1.64 | 21d | 14 | 0.51mi |
| 1140 Schex Dr Bossier City, LA | 3.0 | 1.0 | 1346 | $1,500 | $1.11 | 21d | 1 | 0.59mi |
| 1148 Dudley Ln Bossier City, LA | 3.0 | 1.0 | 1013 | $925 | $0.91 | 13d | 1 | 0.67mi |
| 3406 Black Lake Cir Bossier City, LA | 3.0 | 1.0 | 1400 | $1,200 | $0.86 | 21d | 1 | 0.75mi |
| 1231 Waller Ave Bossier City, LA | 3.0 | 1.0 | 1500 | $1,100 | $0.73 | 44d | 1 | 0.78mi |
| 3115 Oliver St Bossier City, LA | 3.0 | 1.5 | 1067 | $1,400 | $1.31 | 13d | 1 | 0.78mi |
| 1120 Margaret St Bossier City, LA | 2.0 | 1.0 | 950 | $1,200 | $1.26 | 21d | 1 | 0.83mi |
| 400 John Wesley Blvd Bossier City, LA | 2.0 | 1.5 | 935 | $842 | $0.90 | 13d | 2 | 1.05mi |
| 2248 Loreco St Bossier City, LA | 3.0 | 2.0 | 1073 | $1,400 | $1.30 | 44d | 1 | 1.06mi |
| 2201 Naples St Bossier City, LA | 2.0 | 1.0 | 759 | $775 | $1.02 | 44d | 1 | 1.16mi |
| 4056 Beech St Bossier City, LA | 4.0 | 1.0 | 1391 | $1,400 | $1.01 | 21d | 1 | 1.19mi |
| 305 Orleans St Bossier City, LA | 2.0 | 1.5 | 1021 | $1,000 | $0.98 | 21d | 1 | 1.20mi |
| 205 Royal St Bossier City, LA | 2.0 | 1.5 | 1100 | $1,100 | $1.00 | 44d | 1 | 1.22mi |
Listing history 11 events
-
2026-06-18days on market $113,000 Active 15 DOM
-
2026-06-17days on market $113,000 Active 14 DOM
-
2026-06-16days on market $113,000 Active 13 DOM
-
2026-06-15days on market $113,000 Active 12 DOM
-
2026-06-14days on market $113,000 Active 10 DOM
-
2026-06-13days on market $113,000 Active 9 DOM
-
2026-06-10days on market $113,000 Active 7 DOM
-
2026-06-09days on market $113,000 Active 6 DOM
-
2026-06-08days on market $113,000 Active 5 DOM
-
2026-06-07remarks 290-char remark
-
2026-06-07$113,000 Active 4 DOM
ⓘ Source: listings_history table (triggers on properties + properties_extension) + one-shot
backfill from property_details.listing_events for pre-trigger history.
Tax reassessment forecast LA · Resets to sale price
- Current annual tax
- $713 · $59/mo
- Projected year-2 tax
- $713 · $59/mo
- Expected delta
- $0/yr ($0/mo · 0.0%)
ⓘ Screening estimate from a state-policy table — verify with the county assessor before closing.
Climate risk First Street
- Flood 6/10 Major FEMA zone X (unshaded) · 74% chance over 30 yrs
- Wildfire 1/10 Low
- Heat 7/10 Severe 7 d/yr ≥111°F today · 22 d/yr by 30 yrs out
- Wind 6/10 Major 68% chance of damaging wind over 30 yrs
- Air quality 2/10 Low 1 unhealthy d/yr today · 2 by 30 yrs out
Nearby sold comps map
Loading sold comps map…
Walkable amenities ~0.75 mi
Loading nearby amenities…
Taxation est. · year 1
- Rental income
- $16,757
- − Mortgage interest
- −$6,330
- − Property taxes
- −$713
- − Insurance
- −$565
- − Repairs & maintenance
- −$1,341
- − Management
- −$1,341
- − Depreciation
- −$3,287
- Taxable income
- $3,181
- Est. tax owed @ 24.0%
- −$763
- After-tax cash flow
- $4,085/yr
For passive investors: Depreciation is non-cash, so a rental often shows a tax loss while cash-flowing — sheltering income. Rental losses are passive: they offset passive income freely, and up to $25,000/yr can offset ordinary (W-2) income if you actively participate and your MAGI is under $100k (phasing out to $0 by $150k); unused losses carry forward. On sale, claimed depreciation is recaptured at up to 25%, and gains may owe capital-gains tax (a 1031 exchange can defer both). Figures are a year-1 estimate at your 24.0% rate — not tax advice; consult a CPA.
Schools (NCES district)
- District
- Bossier Parish
- NCES district ID
- 2200270
- Math proficiency
- 40% ▼ -32.00%
- Reading proficiency
- 47% ▼ -28.00%
- Median HH income
- $51,326
- Composite
- 37.5/100
- National rank
- #4402
- State rank
- #17 of 98 in LA
Livability — Bossier City
- Score
- 71/100
- State rank
- #47
- US rank
- #7044
Category grades
Schools grade is shown separately in the Schools card above.
Census & demographics
- Census place
- Bossier City, LA
- County
- Bossier Parish · 98,704 people
- City population
- 91,925
- Metro
- Shreveport-Bossier City, LA
- Population (ZIP)
- 33,587
- Household income
- $61,760
- Rent vs Own
- Severe rent burden
- 1391.0
Population outlook (Bossier County) Hauer SSP2
- Today (2025)
- 143,247 people
- By 2030
- 151,802 · +6.0%
- By 2040
- 168,194 · +17.4%
- By 2050
- 183,533 · +28.1%
- By 2075
- 217,009 · +51.5%
- By 2100
- 230,091 · +60.6%
Race, ethnicity, and origin ACS 2023
- Neighborhood character
- Diverse neighborhood (Simpson 0.57)
- Race & ethnicity
- White 59% Black 24% Hispanic / Latino 12% Two or more races 8% Asian 2%
- Hispanic origin (detail)
- Mexican 9%
- Common ancestry
- Lithuanian 2% Slovak 1% Scottish 1%
- Foreign-born
- 5% · Canada, Vietnam
- Languages at home
- 89% English-only · Spanish 7% Other Indo-European 1% Tagalog/Filipino 1%
Political lean MEDSL · Bossier
- 2024 margin
- Solid R (+43.3) · D 27.7% · R 71.0% · Other 1.3%
- 2008→2024 swing
- +0.3pp no change · 2008: -43.7pp · 2024: -43.3pp
- All cycles
- 2024: R+43.3 2020: R+41.0 2016: R+45.8 2012: R+45.4 2008: R+43.7
Not yet ingested
- Civics
- —
Market trends
- HPI YoY
- ▼ -77.48%
- Current HPI
- 127.9821
- Rent YoY
- ▲ 3.60%
- Metro
- Shreveport-Bossier City, LA
- State GDP YoY
- ▲ 3.29%
- F500 in state
- 10
Industry mix (Fortune 500 HQ in LA)
| Industry | F500 HQs | Revenue |
|---|---|---|
| Telecommunications | 2 | $23B |
|
||
| Utilities | 1 | $12B |
|
||
| Wholesale / Distribution | 1 | $5B |
|
||
| Advertising | 1 | $2B |
|
||
Price history
-56.2% since first listed23 events — show timeline
- 2026-06-03 Listed $113,000 NTREIS
- 2025-05-15 Listing Removed — NTREIS
- 2025-04-14 Price Changed $112,000 NTREIS
- 2025-03-24 Price Changed $115,000 NTREIS
- 2025-03-17 Price Changed $118,000 NTREIS
- 2025-03-03 Listed $120,000 NTREIS
- 2024-01-18 Sold (Public Records) $87,500 Public Records
- 2024-01-18 Sold (MLS) — NTREIS
- 2023-12-18 Pending — NTREIS
- 2023-11-30 Listed $92,500 NTREIS
- 2023-09-15 Sold (MLS) — NTREIS
- 2023-09-03 Pending — NTREIS
- 2023-08-14 Relisted — NTREIS
- 2023-07-31 Pending — NTREIS
- 2023-07-27 Relisted — NTREIS
- 2023-07-24 Pending — NTREIS
- 2023-07-23 Listed $39,514 NTREIS
- 2018-08-17 Sold (Public Records) $88,300 Public Records
- 2009-06-09 Sold (Public Records) $35,000 Public Records
- 2009-05-21 Sold (Public Records) — Public Records
- 2009-05-14 Sold (Public Records) $28,000 Public Records
- 2007-08-24 Sold (Public Records) — Public Records
- 2004-11-24 Sold (Public Records) $258,000 Public Records
Property tax history
+4.3%/yrLatest (2025): $713 · +51.7% YoY. Source: county tax records.
Cash-flow waterfall
monthlySold comps — $/sqft
last 12 mo · ≤1 miLoading sold comps…