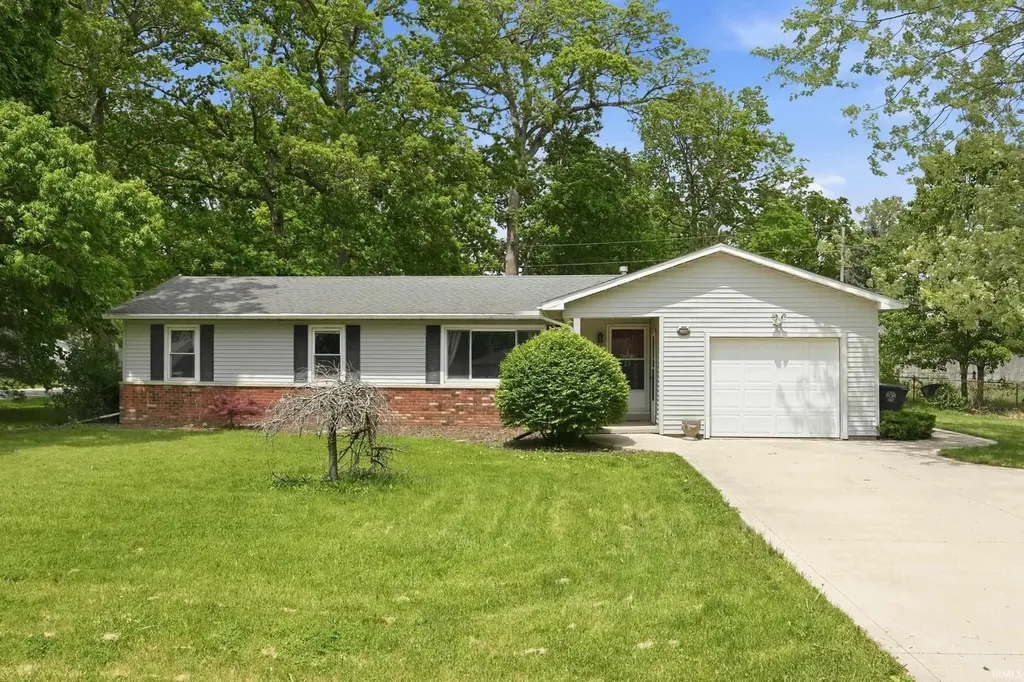
7105 Duane Dr · Fort Wayne, IN
Flood risk 1/10 · Minimal
- FEMA flood zone
- X (unshaded)
- Chance of flooding over 30 yrs
- 0.0%
- Est. flood insurance / yr
- $507 – $1,088
Fire risk 1/10 · Minimal
- Est. fire insurance / yr
- $717 – $1,331
Heat risk 3/10 · Minor
- Hot days now (above 100°F)
- 7 days/yr
- Hot days in 30 yrs
- 17 days/yr
Wind risk 2/10 · Minimal
- Chance of severe wind over 30 yrs
- —
Air-quality risk 3/10 · Minor
- Unhealthy air days now
- 2 days/yr
- Unhealthy air days in 30 yrs
- 3 days/yr
Risk factors via First Street. Map © Google.
Why this score? — see what drove the D+ grade
The composite is a weighted blend of 9 inputs, each scored 0–100. Each bar is that input's sub-score; the figure is the points it added to the 100-point composite (weight × sub-score).
- Cash flow +14.5/30.0
- ARV discount +11.6/15.0
- Rent growth +4.7/5.0
- DSCR +4.4/10.0
- Livability +4.2/5.0
- 1% rule +3.4/10.0
- Condition / age +2.5/5.0
- Schools +2.2/10.0
- Appreciation +0.0/10.0
$199,900
🖨 Deal sheet (PDF) 📄 Offer letter ✓ Due diligence
Listing remarks MLS
This ranch boasts tremendous curb appeal, maintenance-free vinyl siding and vinyl windows. Immediately, upon entering the home you are entering into a spacious Living Room with a Large Picture Window. The airy and bright eat-in kitchen has custom cabinets and ample countertop space. Off the kitchen is a nice size Beamed ceiling family room W/ sliding glass doors that lead to an oversized deck overlooking the large backyard perfect for any family having those family gatherings. The garage access is off the family room along with the 1/2 Bath. A long hallway extends to the 3 spacious bedrooms and a full bath with a laundry area in the bath. Both baths have been updated. All three bedrooms have hardwood floors under the carpet. Freshly poured concrete drive and sidewalk adorn the outside. Close to shopping, schools, churches, interstate, and hospitals.
Key facts
- Fresh paint
- New carpet
- Spacious lot
Tags
Property features AI
Exterior
- Parking: Attached garage (1 car); Off-street parking
- Utilities: Public water; Public sewer
- Home design: Single-family residence (site-built); One story
- Construction: Vinyl siding
- Exterior features: Corner, level lot; Yard shed(s)
Interior
- Bathrooms: 1 full bathroom; 1 half bathroom; 2 bathrooms on main level
- Heating & cooling: Forced air heating; Central air conditioning
- Interior features: Crawl space basement; 6 total rooms
- Laundry & utility: Main-level laundry with electric dryer hookup
Neighborhood map
What this means for you Summary
Snapshot
- This is a 3-bed/1.5-bath single-family listed at $200k.
Deal economics
- At list price, monthly cash flow is $45 ($541/yr) — positive.
- The deal already cash-flows at list — no discount required.
- To meet the 1% rule (rent ≥ 1% of price), the offer needs to be $167k (16.2% below list).
- Recommended offer: $167k (16.2% below list) — sets the bar for 1% rule.
- Cap rate 6.6% vs local median 4.7% in Fort Wayne — top-decile yield for the area; either an underpriced asset or a hidden risk that comps aren't pricing in. Stress-test before assuming the spread holds.
Location & tenants
- Location reads 84/100 on livability (#6 in IN, #676 nationally) — a professional / high-income tenant draw. Strengths: amenities A+, commute A+, cost of living A+; Watch: crime C-, employment D+.
- Fort Wayne Community Schools (urban): math 22% / reading 29% proficiency, ranked #263 of 301 in IN (top 87%) — low school quality limits family demand, transient renter base, plan for 1-2y turnover; 60% free/reduced lunch — lower-income household profile, screen leases tightly.
- Zoned schools: Saint Joseph Central School (math 37% / reading 29%, grade F, #639 of 994 statewide, top 65%, 397 students, 48% FRL); Jefferson Middle School (math 22% / reading 29%, grade F, #243 of 330 statewide, top 74%, 682 students, 58% FRL); Northrop High School (math 25% / reading 62%, grade F, #191 of 369 statewide, top 52%, 2,136 students, 54% FRL).
- Market conditions: Rents rising fast (+8.9%/yr); 187 active listings in the ZIP; 4 comparable units currently listed for rent nearby; rentals at typical pace (median 23d on market — plan ~3-4 weeks tenant-placement turnaround); solid renter incomes; 1,861 units permitted in Allen County in 2024 (576 in 5+ unit buildings).
Forward outlook
- Local home prices are declining (-3.0%/yr); year-one equity from $1k of loan paydown is wiped out by about $6k of value loss. Plan a longer hold.
- Allen County population projected at +10% by 2050 — modest demand growth; plan on rents tracking national, not racing it.
Negotiation context
- Only 3 days on market — expect competitive offers; lowballing is unlikely to land.
- 2 sale attempts since 6y ago with the ask held roughly flat each time — persistent listings suggest the price (not the market) is what's stuck; bring a comps-based counter.
- Current owner paid $122k; list at $200k implies a 63% gain — meaningful room to come down on a strong offer.
Questions for the listing agent
- Built in 1965 — when were the roof, HVAC, electrical panel, plumbing, and water heater last replaced?
- Is there a deadline driving the sale (1031 exchange, divorce, estate, relocation)? That informs how much negotiation room exists.
- Schools are D-rated, which usually means shorter tenancies and higher turnover. Who's the typical renter profile here, and what's been the actual vacancy rate?
- The area grade is low — what's the realistic commute time and amenity access for the typical tenant pool here? Any planned neighborhood developments (good or bad) we should know about?
- What's the average days-on-market for RENTAL listings here right now (not sales)? A rising rental-DOM trend means longer vacancies and softer asking-rent achievability than the comps imply.
- What's the recent tenant-quality profile in this submarket — average credit score on applications, eviction rate, late-payment / NSF rate, and stable-employment percentage? A property-management company in the area should have these aggregated.
- How much new for-sale + rental construction is in the pipeline within 1–3 miles? Heavy new supply typically softens prices + rents 12–24 months out; constrained supply supports both.
Investment metrics
- 1% rule
- 0.84% ✗
- Cap rate
- 6.56%
- Cash-on-cash
- 0.97%
- DSCR
- 1.04
- GRM
- 10.0
CMA / ARV
- ARV (on-the-fly)
- $220,008
- Comps found
- 12
Show comp detail 12 sales within ~0.75 mi
| Address | Dist | Beds/Ba | Sqft | Sold | Price | $/sf | Match |
|---|---|---|---|---|---|---|---|
| 4615 Beechcrest Dr | 0.32mi | 3/2.0 | 1,260 (+2%) | 3mo | $229,500 | $182 | 78 |
| 4630 Muirfield Dr | 0.26mi | 3/2.0 | 1,280 (+4%) | 7mo | $154,000 | $120 | 74 |
| 7416 Charlesbury Ct | 0.25mi | 3/2.0 | 1,277 (+3%) | 8mo | $232,400 | $182 | 74 |
| 4616 Larkspur Dr | 0.27mi | 3/2.0 | 1,320 (+7%) | 1mo | $219,900 | $167 | 73 |
| 5326 Dennison Dr | 0.32mi | 3/2.0 | 1,300 (+5%) | 9mo | $260,000 | $200 | 67 |
| 6717 Creekwood Ln | 0.59mi | 3/2.0 | 1,244 (+1%) | 6mo | $225,000 | $181 | 64 |
| 6705 Creekwood Ln | 0.60mi | 3/2.0 | 1,293 (+5%) | 3mo | $265,000 | $205 | 60 |
| 4724 Hartford Dr | 0.53mi | 3/2.0 | 1,287 (+4%) | 9mo | $225,000 | $175 | 59 |
| 6616 Arnel Ave | 0.34mi | 3/2.0 | 1,360 (+10%) | 8mo | $215,000 | $158 | 58 |
| 5918 Gate Tree Ln | 0.61mi | 3/2.0 | 1,277 (+3%) | 8mo | $227,000 | $178 | 57 |
| 4612 Maple Terrace Pkwy | 0.38mi | 3/1.5 | 1,385 (+12%) | 10mo | $162,500 | $117 | 54 |
| 7751 Stellhorn Rd | 0.61mi | 3/2.0 | 1,354 (+10%) | 9mo | $175,000 | $129 | 46 |
Match score weights: distance 35% · size 25% · config 20% · recency 20%. Top-matched comps best support the ARV.
Projected returns pro-forma
-3.0% appreciation · 8.0% rent growth · sell at horizon
- IRR
- -9.7%
- Equity multiple
- 0.63×
- Total profit
- $-20,711
- Equity at exit
- $29,806
- IRR
- 5.2%
- Equity multiple
- 1.46×
- Total profit
- $25,777
- Equity at exit
- $17,284
Cash invested: $55,972 (down + closing). Projections, not guarantees.
Landlord ↔ Tenant lean methodology
- Overall (STATE)
- 90 Strongly Landlord-Friendly
- State Indiana
- 90 Strongly Landlord-Friendly · R+11
- County
- — inherits STATE
- City
- — inherits STATE
ZIP-level market 46835
- Rents YoY
- 8.9%
- Active inventory
- 187
- Price-to-rent
- 10.0×
Monthly cashflow live
- Estimated rent
- $1,674 medium interval (Pro) →
- Mortgage (P&I)
- −$1,048
- Tax from tax record
- −$146 /mo · $1,751/yr
- Insurance
- −$83
- HOA
- −$0
- Vacancy / Maint / Mgmt
- −$352
- Net cashflow
- $45
Break-even live
Sensitivity live
| Price | -10% $158 | -5% $102 | +0% $45 | +5% $-11 | +10% $-68 |
|---|---|---|---|---|---|
| Rent | -10% $-87 | -5% $-21 | +0% $45 | +5% $111 | +10% $177 |
| Rate | -1.0pp $146 | -0.5pp $96 | base $45 | +0.5pp $-7 | +1.0pp $-59 |
UW: 25.0% down · 7.5% · 30yr · 1.5% tax · 5.0% vac · 8.0% maint · 8.0% mgmt
Financing live
Cash to close
- Down payment
- $49,975
- Closing costs
- $5,997
- Reserves months
- —
- Total cash needed
- —
Loan-product check · same deal, 3 products live
Conventional
25% down · 7.5% · 30yr
- Down + closing
- —
- Monthly P&I
- —
- Monthly cashflow
- —
- DSCR
- —
- Eligible?
- —
Personal DTI + credit; lowest rate.
DSCR
20% down · 8.5% · 30yr
- Down + closing
- —
- Monthly P&I
- —
- Monthly cashflow
- —
- DSCR
- —
- Eligible?
- —
No personal income docs; deal must DSCR.
Hard money
10% down · 12.0% · 12mo
- Down + closing
- —
- Monthly P&I
- —
- Monthly cashflow
- —
- DSCR
- —
- Eligible?
- —
Short-term bridge; refi at stabilization.
Rent comps 4 comps
| Address | Beds | Baths | Sqft | Rent | $/sqft | DOM | Units | Dist |
|---|---|---|---|---|---|---|---|---|
| 5450 Kinzie Ct Fort Wayne, IN | 2.0 | 2.0 | 1294 | $1,992 | $1.54 | 15d | 2 | 0.71mi |
| 6031 Evard Rd Fort Wayne, IN | 2.0 | 2.0 | 1200 | $1,600 | $1.33 | 23d | 1 | 1.35mi |
| 6031 Evard Rd Fort Wayne, IN | 2.0 | 2.0 | 1200 | $1,600 | $1.33 | 45d | 4 | 1.35mi |
| 6835 Solid Rock Dr Fort Wayne, IN | 2.0 | 2.0 | 1200 | $1,600 | $1.33 | 15d | 1 | 1.36mi |
Listing history 4 events
-
2026-05-20$199,900 Active
-
2020-06-10soldstatus $122,400 861-char remark
Show marketing remark (861 chars)
This ranch boasts tremendous curb appeal, maintenance-free vinyl siding and vinyl windows. Immediately, upon entering the home you are entering into a spacious Living Room with a Large Picture Window. The airy and bright eat-in kitchen has custom cabinets and ample countertop space. Off the kitchen is a nice size Beamed ceiling family room W/ sliding glass doors that lead to an oversized deck overlooking the large backyard perfect for any family having those family gatherings. The garage access is off the family room along with the 1/2 Bath. A long hallway extends to the 3 spacious bedrooms and a full bath with a laundry area in the bath. Both baths have been updated. All three bedrooms have hardwood floors under the carpet. Freshly poured concrete drive and sidewalk adorn the outside. Close to shopping, schools, churches, interstate, and hospitals.
-
2020-05-09$119,900 861-char remark
Show marketing remark (861 chars)
This ranch boasts tremendous curb appeal, maintenance-free vinyl siding and vinyl windows. Immediately, upon entering the home you are entering into a spacious Living Room with a Large Picture Window. The airy and bright eat-in kitchen has custom cabinets and ample countertop space. Off the kitchen is a nice size Beamed ceiling family room W/ sliding glass doors that lead to an oversized deck overlooking the large backyard perfect for any family having those family gatherings. The garage access is off the family room along with the 1/2 Bath. A long hallway extends to the 3 spacious bedrooms and a full bath with a laundry area in the bath. Both baths have been updated. All three bedrooms have hardwood floors under the carpet. Freshly poured concrete drive and sidewalk adorn the outside. Close to shopping, schools, churches, interstate, and hospitals.
-
2005-03-09soldstatus $3,210
ⓘ Source: listings_history table (triggers on properties + properties_extension) + one-shot
backfill from property_details.listing_events for pre-trigger history.
Tax reassessment forecast IN · Partial reset (capped growth)
- Current annual tax
- $1,751 · $146/mo
- Projected year-2 tax
- $1,751 · $146/mo
- Expected delta
- $0/yr ($0/mo · 0.0%)
ⓘ Screening estimate from a state-policy table — verify with the county assessor before closing.
Climate risk First Street
- Flood 1/10 Low FEMA zone X (unshaded) · 0% chance over 30 yrs
- Wildfire 1/10 Low
- Heat 3/10 Moderate 7 d/yr ≥100°F today · 17 d/yr by 30 yrs out
- Wind 2/10 Low
- Air quality 3/10 Moderate 2 unhealthy d/yr today · 3 by 30 yrs out
Nearby sold comps map
Loading sold comps map…
Walkable amenities ~0.75 mi
Loading nearby amenities…
Taxation est. · year 1
- Rental income
- $20,090
- − Mortgage interest
- −$11,198
- − Property taxes
- −$1,751
- − Insurance
- −$1,000
- − Repairs & maintenance
- −$1,607
- − Management
- −$1,607
- − Depreciation
- −$5,815
- Taxable loss
- −$2,887
- Est. tax savings @ 24.0%
- +$693
- After-tax cash flow
- $1,234/yr
For passive investors: Depreciation is non-cash, so a rental often shows a tax loss while cash-flowing — sheltering income. Rental losses are passive: they offset passive income freely, and up to $25,000/yr can offset ordinary (W-2) income if you actively participate and your MAGI is under $100k (phasing out to $0 by $150k); unused losses carry forward. On sale, claimed depreciation is recaptured at up to 25%, and gains may owe capital-gains tax (a 1031 exchange can defer both). Figures are a year-1 estimate at your 24.0% rate — not tax advice; consult a CPA.
Schools (NCES district)
- District
- Fort Wayne Community Schools
- NCES district ID
- 1803630
- Math proficiency
- 22% ▼ -11.00%
- Reading proficiency
- 29% ▼ -7.00%
- Median HH income
- $41,951
- Composite
- 21.68/100
- National rank
- #8275
- State rank
- #263 of 301 in IN
Livability — Fort Wayne
- Score
- 84/100
- State rank
- #6
- US rank
- #676
Category grades
Schools grade is shown separately in the Schools card above.
Census & demographics
- Census place
- Fort Wayne, IN
- County
- Allen County · 326,813 people
- City population
- 326,813
- Metro
- Fort Wayne, IN
- Population (ZIP)
- 38,166
- Household income
- $77,152
- Rent vs Own
- Severe rent burden
- 961.0
Population outlook (Allen County) Hauer SSP2
- Today (2025)
- 394,020 people
- By 2030
- 405,128 · +2.8%
- By 2040
- 423,476 · +7.5%
- By 2050
- 435,137 · +10.4%
- By 2075
- 450,293 · +14.3%
- By 2100
- 424,101 · +7.6%
Race, ethnicity, and origin ACS 2023
- Neighborhood character
- Predominantly White (77%)
- Race & ethnicity
- White 77% Two or more races 10% Hispanic / Latino 8% Black 6% Asian 3%
- Hispanic origin (detail)
- Mexican 6%
- Common ancestry
- Italian 3% Lithuanian 3% Romanian 2%
- Foreign-born
- 6% · Canada, Vietnam, Philippines
- Languages at home
- 91% English-only · Spanish 3% Other Asian/Pacific 2% Other Indo-European 1%
Political lean MEDSL · Allen
- 2024 margin
- R (+12.5) · D 42.9% · R 55.4% · Other 1.7%
- 2008→2024 swing
- -8.1pp toward R · 2008: -4.3pp · 2024: -12.5pp
- All cycles
- 2024: R+12.5 2020: R+11.2 2016: R+19.6 2012: R+16.8 2008: R+4.3
Not yet ingested
- Civics
- —
Market trends
- HPI YoY
- ▼ -236.62%
- Current HPI
- 236.3419
- Rent YoY
- ▲ 8.95%
- Metro
- Fort Wayne, IN
- State GDP YoY
- ▲ 2.90%
- F500 in state
- 18
Industry mix (Fortune 500 HQ in IN)
| Industry | F500 HQs | Revenue |
|---|---|---|
| Industrial Machinery | 2 | $37B |
|
||
| Healthcare | 1 | $177B |
|
||
| Pharmaceuticals | 1 | $45B |
|
||
| Metals / Steel | 1 | $18B |
|
||
| Agriculture | 1 | $17B |
|
||
| Packaging | 1 | $12B |
|
||
Price history
+6127.4% since first listed5 events — show timeline
- 2026-05-23 Pending — IRMLS
- 2026-05-20 Listed $199,900 IRMLS
- 2020-06-10 Sold (MLS) $122,400 IRMLS
- 2020-05-09 Listed $119,900 IRMLS
- 2005-03-09 Sold (Public Records) $3,210 Public Records
Property tax history
+9.6%/yrLatest (2024): $1,751 · +7.2% YoY. Source: county tax records.
Cash-flow waterfall
monthlySold comps — $/sqft
last 12 mo · ≤1 miLoading sold comps…