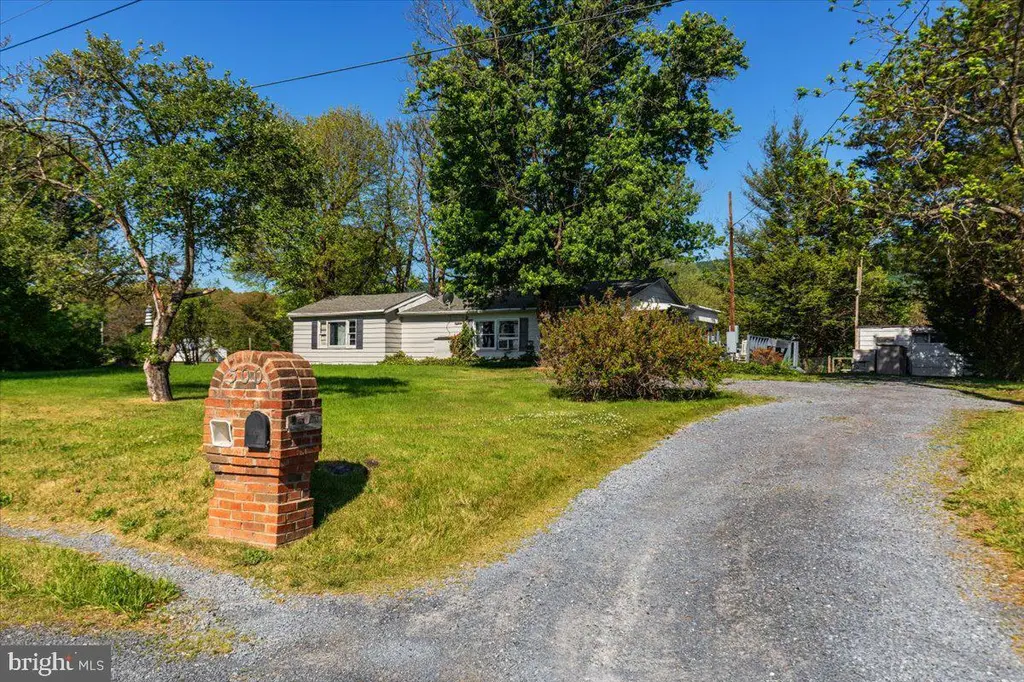
500 S Hayfield Rd · Shawneeland, VA
Flood risk 1/10 · Minimal
- FEMA flood zone
- X (unshaded)
- Chance of flooding over 30 yrs
- 0.0%
- Est. flood insurance / yr
- $507 – $1,088
Fire risk 4/10 · Minor
- Est. fire insurance / yr
- $666 – $1,236
Heat risk 5/10 · Moderate
- Hot days now (above 99°F)
- 7 days/yr
- Hot days in 30 yrs
- 17 days/yr
Wind risk 2/10 · Minimal
- Chance of severe wind over 30 yrs
- 1.0%
Air-quality risk 1/10 · Minimal
- Unhealthy air days now
- 0 days/yr
- Unhealthy air days in 30 yrs
- 0 days/yr
Risk factors via First Street. Map © Google.
Why this score? — see what drove the B- grade
The composite is a weighted blend of 9 inputs, each scored 0–100. Each bar is that input's sub-score; the figure is the points it added to the 100-point composite (weight × sub-score).
- Cash flow +30.0/30.0
- DSCR +10.0/10.0
- 1% rule +9.1/10.0
- ARV discount +7.5/15.0
- Schools +5.0/10.0
- Livability +3.2/5.0
- Condition / age +2.5/5.0
- Rent growth +1.9/5.0
- Appreciation +0.0/10.0
$169,000
🖨 Deal sheet (PDF) 📄 Offer letter ✓ Due diligence
Listing remarks
PRICE IMPROVEMENT ALERT!! Nestled in a peaceful country setting just minutes from Winchester, this property offers an incredible opportunity to enjoy scenic mountain views and beautiful surrounding pasture land on a picturesque half-acre lot. The setting is truly the star here, with open views in the front and mountains stretching across the backdrop. Conveniently located with easy access to shopping, dining, and commuter routes while still offering the charm of rural living. Home is being sold strictly AS-IS.
Key facts
- 0.5 acre lot
- Garage
- Built 1957
Tags
Property features AI
Exterior
- Parking: Detached front-entry garage (1 car); Driveway parking
- Utilities: Well water; Private septic tank; Cable internet available; Electric hot water
- Home design: Detached single-family property; Single-story living with main-level bedrooms; Located outside city limits; State-maintained road access
- Construction: Aluminum siding; Other type foundation; Structure type: Detached; Year built per assessor
- Exterior features: Deck(s); Outbuilding(s); Front yard and rear yard; Level, private lot; Road frontage; Rural setting
Interior
- Kitchen: Oven/Range - Electric; Refrigerator; Pantry
- Bedrooms: Three bedrooms on the main level; Rooms include: Living Room, Dining Room, Bedroom 1, Bedroom 2, Bedroom 3, Kitchen
- Flooring: Carpet
- Bathrooms: One full bathroom on the main level; One full bathroom total
- Heating & cooling: Forced air heating (oil-fired); Window air conditioning units (electric)
- Interior features: Tub/shower combination; Combination kitchen and dining area; Pantry; Water treatment system (owned); Water conditioner (owned); Window treatments; Entry-level bedroom
- Laundry & utility: Washer and Dryer; Main floor laundry; Electric hot water
Neighborhood map
What this means for you Summary
Snapshot
- This is a 4-bed/1.0-bath manufactured listed at $169k.
Deal economics
- At list price, monthly cash flow is $855 ($10k/yr) — positive.
- The deal already cash-flows at list — no discount required.
- Meets the 1% rule at list price ($2k rent vs $169k).
- Recommended offer: $166k (1.5% below list) — sets the bar for market timing.
- Cap rate 12.4% vs local median 4.3% in Shawneeland — top-decile yield for the area; either an underpriced asset or a hidden risk that comps aren't pricing in. Stress-test before assuming the spread holds.
Location & tenants
- Location reads 64/100 on livability (#359 in VA) — a middle-class / working-renter tenant base. Strengths: crime A+, employment A+, cost of living A+; Watch: schools F, amenities F, commute F.
- Frederick County Public School District (rural): math 49% / reading 64% proficiency, ranked #65 of 131 in VA (top 50%) — acceptable for families but not a draw, mixed tenant base, ~2y average lease.
- Market conditions: Rents soft (-2.5%/yr); 312 active listings in the ZIP; solid renter incomes; 872 units permitted in Frederick County in 2024 (0 in 5+ unit buildings).
Forward outlook
- Local home prices are declining (-3.0%/yr); year-one equity from $1k of loan paydown is wiped out by about $5k of value loss. Plan a longer hold.
- Frederick County population projected at +17% by 2050 — long-run rental-demand tailwind backs the buy-and-hold thesis.
- At projected returns (-3.0% appreciation + 0.0% rent growth), your $47k cash investment doubles in ~7 years — after that, you're playing with house money.
Negotiation context
- It's been on market 21 days — a 2% lower offer ($166k) is reasonable based on typical stale-listing flexibility.
Risks & watch-outs
- Watch-outs: built in 1957 — expect roof / HVAC / electrical / plumbing capex.
- Climate carrying-cost: extreme-heat days projected 7→17/yr by 2055 (HVAC capex compounding) — expect insurance premiums to compound above CPI over the hold.
Questions for the listing agent
- Built in 1957 — when were the roof, HVAC, electrical panel, plumbing, and water heater last replaced?
- Is there a deadline driving the sale (1031 exchange, divorce, estate, relocation)? That informs how much negotiation room exists.
- Schools are F-rated, which usually means shorter tenancies and higher turnover. Who's the typical renter profile here, and what's been the actual vacancy rate?
- What's the average days-on-market for RENTAL listings here right now (not sales)? A rising rental-DOM trend means longer vacancies and softer asking-rent achievability than the comps imply.
- What's the recent tenant-quality profile in this submarket — average credit score on applications, eviction rate, late-payment / NSF rate, and stable-employment percentage? A property-management company in the area should have these aggregated.
- How much new for-sale + rental construction is in the pipeline within 1–3 miles? Heavy new supply typically softens prices + rents 12–24 months out; constrained supply supports both.
Investment metrics
- 1% rule
- 1.41% ✓
- Cap rate
- 12.36%
- Cash-on-cash
- 21.68%
- DSCR
- 1.96
- GRM
- 5.9
CMA / ARV
No comps found within radius.
Projected returns pro-forma
-3.0% appreciation · 0.0% rent growth · sell at horizon
- IRR
- 11.1%
- Equity multiple
- 1.42×
- Total profit
- $20,035
- Equity at exit
- $25,198
- IRR
- 17.7%
- Equity multiple
- 2.28×
- Total profit
- $60,397
- Equity at exit
- $14,612
Cash invested: $47,320 (down + closing). Projections, not guarantees.
Landlord ↔ Tenant lean methodology
- Overall (STATE)
- 55 Moderately Landlord-Leaning
- State Virginia
- 55 Moderately Landlord-Leaning · D+2
- County
- — inherits STATE
- City
- — inherits STATE
ZIP-level market 22602
- Home prices YoY
- -20.0%
- Rents YoY
- -2.5%
- Active inventory
- 312
- Price-to-rent
- 5.9×
Monthly cashflow live
- Estimated rent
- $2,379 medium interval (Pro) →
- Mortgage (P&I)
- −$886
- Tax from tax record
- −$68 /mo · $815/yr
- Insurance
- −$70
- HOA
- −$0
- Vacancy / Maint / Mgmt
- −$500
- Net cashflow
- $855
Break-even live
Sensitivity live
| Price | -10% $950 | -5% $903 | +0% $855 | +5% $807 | +10% $759 |
|---|---|---|---|---|---|
| Rent | -10% $667 | -5% $761 | +0% $855 | +5% $949 | +10% $1,043 |
| Rate | -1.0pp $940 | -0.5pp $898 | base $855 | +0.5pp $811 | +1.0pp $766 |
UW: 25.0% down · 7.5% · 30yr · 1.5% tax · 5.0% vac · 8.0% maint · 8.0% mgmt
Financing live
Cash to close
- Down payment
- $42,250
- Closing costs
- $5,070
- Reserves months
- —
- Total cash needed
- —
Loan-product check · same deal, 3 products live
Conventional
25% down · 7.5% · 30yr
- Down + closing
- —
- Monthly P&I
- —
- Monthly cashflow
- —
- DSCR
- —
- Eligible?
- —
Personal DTI + credit; lowest rate.
DSCR
20% down · 8.5% · 30yr
- Down + closing
- —
- Monthly P&I
- —
- Monthly cashflow
- —
- DSCR
- —
- Eligible?
- —
No personal income docs; deal must DSCR.
Hard money
10% down · 12.0% · 12mo
- Down + closing
- —
- Monthly P&I
- —
- Monthly cashflow
- —
- DSCR
- —
- Eligible?
- —
Short-term bridge; refi at stabilization.
Listing history 14 events
-
2026-06-19days on market $169,000 Active 21 DOM
-
2026-06-18days on market $169,000 Active 20 DOM
-
2026-06-17days on market $169,000 Active 19 DOM
-
2026-06-16days on market $169,000 Active 18 DOM
-
2026-06-15days on market $169,000 Active 17 DOM
-
2026-06-14days on market $169,000 Active 15 DOM
-
2026-06-13pricedays on market $169,000 Active 14 DOM
-
2026-06-10days on market $199,000 Active 12 DOM
-
2026-06-09days on market $199,000 Active 11 DOM
-
2026-06-08days on market $199,000 Active 10 DOM
-
2026-06-07days on market $199,000 Active 9 DOM
-
2026-06-05remarks 517-char remark
-
2026-06-05pricestatusdays on market $199,000 Active 6 DOM
-
2026-05-22$210,000 Active
ⓘ Source: listings_history table (triggers on properties + properties_extension) + one-shot
backfill from property_details.listing_events for pre-trigger history.
Tax reassessment forecast VA · Resets to sale price
- Current annual tax
- $815 · $68/mo
- Projected year-2 tax
- $1,386 · $115/mo
- Expected delta
- +$571/yr (+$48/mo · 70.1%)
ⓘ Screening estimate from a state-policy table — verify with the county assessor before closing.
Climate risk First Street
- Flood 1/10 Low FEMA zone X (unshaded) · 0% chance over 30 yrs
- Wildfire 4/10 Moderate
- Heat 5/10 Major 7 d/yr ≥99°F today · 17 d/yr by 30 yrs out
- Wind 2/10 Low 100% chance of damaging wind over 30 yrs
- Air quality 1/10 Low 0 unhealthy d/yr today · 0 by 30 yrs out
Nearby sold comps map
Loading sold comps map…
Walkable amenities ~0.75 mi
Loading nearby amenities…
Taxation est. · year 1
- Rental income
- $28,548
- − Mortgage interest
- −$9,467
- − Property taxes
- −$815
- − Insurance
- −$845
- − Repairs & maintenance
- −$2,284
- − Management
- −$2,284
- − Depreciation
- −$4,916
- Taxable income
- $7,937
- Est. tax owed @ 24.0%
- −$1,905
- After-tax cash flow
- $8,353/yr
For passive investors: Depreciation is non-cash, so a rental often shows a tax loss while cash-flowing — sheltering income. Rental losses are passive: they offset passive income freely, and up to $25,000/yr can offset ordinary (W-2) income if you actively participate and your MAGI is under $100k (phasing out to $0 by $150k); unused losses carry forward. On sale, claimed depreciation is recaptured at up to 25%, and gains may owe capital-gains tax (a 1031 exchange can defer both). Figures are a year-1 estimate at your 24.0% rate — not tax advice; consult a CPA.
Schools (NCES district)
- District
- Frederick County Public School District
- NCES district ID
- 5101470
- Math proficiency
- 49% ▼ -30.00%
- Reading proficiency
- 64% ▼ -10.00%
- Median HH income
- $67,049
- Composite
- 49.75/100
- National rank
- #1964
- State rank
- #65 of 131 in VA
Livability — Shawneeland
- Score
- 64/100
- State rank
- #359
- US rank
- #14402
Category grades
Schools grade is shown separately in the Schools card above.
Census & demographics
- County
- Frederick County · 60,887 people
- Metro
- Winchester, VA-WV
- Population (ZIP)
- 32,840
- Household income
- $101,398
- Rent vs Own
- Severe rent burden
- 294.0
Population outlook (Frederick County) Hauer SSP2
- Today (2025)
- 92,976 people
- By 2030
- 97,195 · +4.5%
- By 2040
- 104,149 · +12.0%
- By 2050
- 108,407 · +16.6%
- By 2075
- 116,431 · +25.2%
- By 2100
- 114,323 · +23.0%
Race, ethnicity, and origin ACS 2023
- Neighborhood character
- Predominantly White (79%)
- Race & ethnicity
- White 79% Hispanic / Latino 12% Two or more races 5% Black 3% Asian 2%
- Hispanic origin (detail)
- Mexican 6% Puerto Rican 1%
- Common ancestry
- Lithuanian 3% Serbian 2% Romanian 2%
- Foreign-born
- 8% · Canada, China
- Languages at home
- 88% English-only · Spanish 10% Other Indo-European 1%
Political lean MEDSL · Frederick
- 2024 margin
- Strong R (+28.4) · D 35.2% · R 63.6% · Other 1.1%
- 2008→2024 swing
- -7.0pp toward R · 2008: -21.4pp · 2024: -28.4pp
- All cycles
- 2024: R+28.4 2020: R+27.4 2016: R+35.3 2012: R+28.0 2008: R+21.4
Not yet ingested
- Civics
- —
Market trends
- HPI YoY
- ▼ -52.39%
- Current HPI
- 209.8801
- Rent YoY
- ▼ -2.55%
- Metro
- Winchester, VA-WV
- State GDP YoY
- ▲ 2.40%
- F500 in state
- 50
Industry mix (Fortune 500 HQ in VA)
| Industry | F500 HQs | Revenue |
|---|---|---|
| Aerospace / Defense | 4 | $236B |
|
||
| Technology / Defense | 3 | $32B |
|
||
| Financial Services | 2 | $176B |
|
||
| Utilities | 2 | $27B |
|
||
| Insurance | 2 | $25B |
|
||
| Technology | 2 | $15B |
|
||
Price history
1 event — show timeline
- 2026-05-22 Listed $210,000 BRIGHT MLS
Property tax history
+5.8%/yrLatest (2025): $815 · +51.7% YoY. Source: county tax records.
Cash-flow waterfall
monthlySold comps — $/sqft
last 12 mo · ≤1 miLoading sold comps…