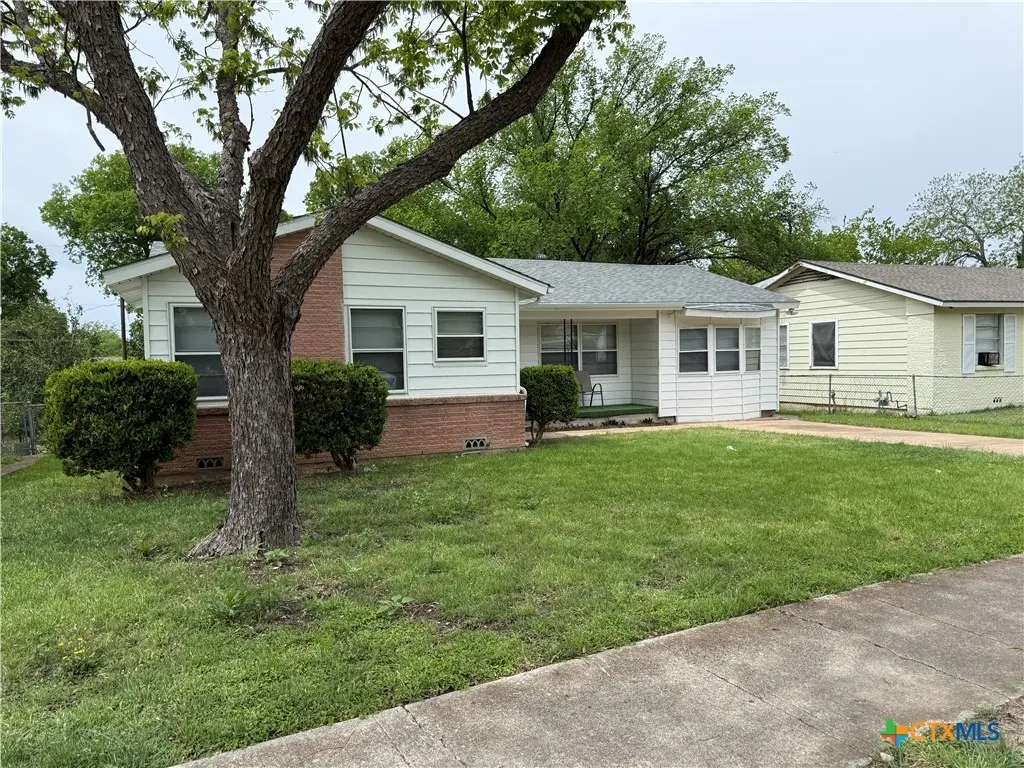
411 Cardinal Ave · Killeen, TX
Flood risk 1/10 · Minimal
- FEMA flood zone
- X (shaded)
- Chance of flooding over 30 yrs
- 0.0%
- Est. flood insurance / yr
- $507 – $1,088
Fire risk 1/10 · Minimal
- Est. fire insurance / yr
- $1,222 – $2,270
Heat risk 7/10 · Major
- Hot days now (above 107°F)
- 7 days/yr
- Hot days in 30 yrs
- 23 days/yr
Wind risk 6/10 · Moderate
- Chance of severe wind over 30 yrs
- 61.0%
Air-quality risk 1/10 · Minimal
- Unhealthy air days now
- 0 days/yr
- Unhealthy air days in 30 yrs
- 0 days/yr
Risk factors via First Street. Map © Google.
Why this score? — see what drove the D grade
The composite is a weighted blend of 9 inputs, each scored 0–100. Each bar is that input's sub-score; the figure is the points it added to the 100-point composite (weight × sub-score).
- Cash flow +9.9/30.0
- ARV discount +9.5/15.0
- Appreciation +6.1/10.0
- 1% rule +3.5/10.0
- Livability +3.2/5.0
- Schools +3.0/10.0
- DSCR +2.8/10.0
- Condition / age +2.5/5.0
- Rent growth +2.0/5.0
$133,700
🖨 Deal sheet (PDF) 📄 Offer letter ✓ Due diligence
Listing remarks MLS
Great investment opportunity! This well-maintained home is being sold as is and offers excellent potential. The roof was replaced in 2025, providing added peace of mind for the next owner. The second living area has been completely remodeled, offering flexible space for a family room, or entertainment area. The property features siding on all exterior surfaces and a large fenced backyard, perfect for outdoor enjoyment. Show anytime!
Key facts
- Roof replaced
- 9,295 sq ft lot
- Built 1961
Tags
Neighborhood map
What this means for you Summary
Snapshot
- This is a 3-bed/1.0-bath single-family listed at $134k.
Deal economics
- At list price, monthly cash flow is $-84 ($-1k/yr) — negative.
- To cash-flow at today's rent, offer at most $119k (11.1% below list).
- To meet the 1% rule (rent ≥ 1% of price), the offer needs to be $113k (15.5% below list).
- Recommended offer: $113k (15.5% below list) — sets the bar for 1% rule.
- Cap rate 5.5% vs local median 3.9% in Killeen — top-decile yield for the area; either an underpriced asset or a hidden risk that comps aren't pricing in. Stress-test before assuming the spread holds.
Location & tenants
- Location reads 63/100 on livability (#853 in TX) — a middle-class / working-renter tenant base. Strengths: cost of living A+, housing A+; Watch: amenities D, employment D, crime D-.
- Killeen ISD (urban): math 31% / reading 38% proficiency, ranked #524 of 826 in TX (top 63%) — families likely to look elsewhere, expect single-tenant / working-renter base with shorter leases.
- Zoned schools: Killeen H S (math 29% / reading 40%, grade F, #963 of 1,632 statewide, top 61%, 2,076 students, 69% FRL) — zoned schools average 69% FRL vs 47% district-wide (22 pts higher); higher-poverty schools than district average — tighter screening recommended.
- Market conditions: Rents soft (-2.0%/yr); 126 active listings in the ZIP; 40 comparable units currently listed for rent nearby; rentals lingering (median 46d on market — plan ~5-8 weeks vacancy on turnover, expect pricing pressure); 55% of comp listings sitting > 30 days — soft ceiling on asking rent; lower-income renter base — watch delinquency; 3,222 units permitted in Bell County in 2024 (246 in 5+ unit buildings).
- This rent runs 36% of the median local income ($37k/yr) — at the standard rent-burdened threshold; future hikes will face affordability resistance.
Forward outlook
- In year one you build about $4k of equity ($924 loan paydown + $3k appreciation (2.3% local appreciation)).
- Bell County population projected at +21% by 2050 — long-run rental-demand tailwind backs the buy-and-hold thesis.
- By year 9, paydown + projected appreciation supports a ~$34k cash-out refi (75% LTV) — recoverable capital for the next deal without selling this one.
Negotiation context
- It's been on market 103 days — a 9% lower offer ($122k) is reasonable based on typical stale-listing flexibility.
Risks & watch-outs
- Climate carrying-cost: major wind risk, 61% chance of damaging wind over 30y; extreme-heat days projected 7→23/yr by 2055 (HVAC capex compounding) — expect insurance premiums to compound above CPI over the hold.
Questions for the listing agent
- What do current leases actually rent for vs. the listed asking? Can we see a recent rent roll and the last 12 months of T-12 income?
- It's been on market 103 days. Have you received any prior offers? Is the seller open to a 15% concession, seller financing, or rate buy-down credit?
- Built in 1961 — when were the roof, HVAC, electrical panel, plumbing, and water heater last replaced?
- Why hasn't it sold? Are there any deal-killer items the seller is aware of (foundation, flood, title, zoning, code violations)?
- Is there a deadline driving the sale (1031 exchange, divorce, estate, relocation)? That informs how much negotiation room exists.
- Schools are D-rated, which usually means shorter tenancies and higher turnover. Who's the typical renter profile here, and what's been the actual vacancy rate?
- Crime grade is D in this area — have there been break-ins, vandalism, or insurance claims at this property in the last 3 years? What carrier currently insures it and at what premium?
- The area grade is low — what's the realistic commute time and amenity access for the typical tenant pool here? Any planned neighborhood developments (good or bad) we should know about?
- What's the average days-on-market for RENTAL listings here right now (not sales)? A rising rental-DOM trend means longer vacancies and softer asking-rent achievability than the comps imply.
- What's the recent tenant-quality profile in this submarket — average credit score on applications, eviction rate, late-payment / NSF rate, and stable-employment percentage? A property-management company in the area should have these aggregated.
- How much new for-sale + rental construction is in the pipeline within 1–3 miles? Heavy new supply typically softens prices + rents 12–24 months out; constrained supply supports both.
Investment metrics
- 1% rule
- 0.85% ✗
- Cap rate
- 5.54%
- Cash-on-cash
- -2.69%
- DSCR
- 0.88
- GRM
- 9.9
CMA / ARV
- ARV (median comp)
- $139,854
- List price
- $133,700
- Delta
- -4.40%
- Verdict
- FAIR
- Comps
- 20 within 1.0 mi
Show comp detail 6 sales within ~0.75 mi
| Address | Dist | Beds/Ba | Sqft | Sold | Price | $/sf | Match |
|---|---|---|---|---|---|---|---|
| 504 Alexander St | 0.08mi | 3/1.5 | 1,218 (-13%) | 3mo | $140,300 | $115 | 70 |
| 501 N 16th St | 0.36mi | 4/2.0 (+1) | 1,373 (-2%) | 3mo | $99,000 | $72 | 69 |
| 507 Harbour Ave | 0.46mi | 3/2.0 | 1,478 (+6%) | 6mo | $130,000 | $88 | 60 |
| 502 Cardinal Ave | 0.05mi | 3/1.5 | 1,202 (-14%) | 16mo | $145,000 | $121 | 59 |
| 1602 N 22nd St | 0.66mi | 3/2.0 | 1,276 (-9%) | 3mo | $196,000 | $154 | 48 |
| 508 Brook Dr | 0.60mi | 3/1.0 | 1,235 (-12%) | 24mo | $95,000 | $77 | 33 |
Match score weights: distance 35% · size 25% · config 20% · recency 20%. Top-matched comps best support the ARV.
Projected returns pro-forma
2.26% appreciation · 0.0% rent growth · sell at horizon
- IRR
- 1.2%
- Equity multiple
- 1.06×
- Total profit
- $2,347
- Equity at exit
- $54,636
- IRR
- 3.7%
- Equity multiple
- 1.50×
- Total profit
- $18,648
- Equity at exit
- $80,163
Cash invested: $37,436 (down + closing). Projections, not guarantees.
Landlord ↔ Tenant lean methodology
- Overall (STATE)
- 87 Strongly Landlord-Friendly
- State Texas
- 87 Strongly Landlord-Friendly · R+5
- County
- — inherits STATE
- City
- — inherits STATE
ZIP-level market 76541
- Home prices YoY
- 1.4%
- Rents YoY
- -2.0%
- Active inventory
- 126
- Price-to-rent
- 9.9×
Monthly cashflow live
- Estimated rent
- $1,130 high interval (Pro) →
- Mortgage (P&I)
- −$701
- Tax from tax record
- −$220 /mo · $2,637/yr
- Insurance
- −$56
- HOA
- −$0
- Vacancy / Maint / Mgmt
- −$237
- Net cashflow
- $-84
Break-even live
Sensitivity live
| Price | -10% $-8 | -5% $-46 | +0% $-84 | +5% $-122 | +10% $-160 |
|---|---|---|---|---|---|
| Rent | -10% $-173 | -5% $-129 | +0% $-84 | +5% $-39 | +10% $5 |
| Rate | -1.0pp $-17 | -0.5pp $-50 | base $-84 | +0.5pp $-119 | +1.0pp $-154 |
UW: 25.0% down · 7.5% · 30yr · 1.5% tax · 5.0% vac · 8.0% maint · 8.0% mgmt
Financing live
Cash to close
- Down payment
- $33,425
- Closing costs
- $4,011
- Reserves months
- —
- Total cash needed
- —
Loan-product check · same deal, 3 products live
Conventional
25% down · 7.5% · 30yr
- Down + closing
- —
- Monthly P&I
- —
- Monthly cashflow
- —
- DSCR
- —
- Eligible?
- —
Personal DTI + credit; lowest rate.
DSCR
20% down · 8.5% · 30yr
- Down + closing
- —
- Monthly P&I
- —
- Monthly cashflow
- —
- DSCR
- —
- Eligible?
- —
No personal income docs; deal must DSCR.
Hard money
10% down · 12.0% · 12mo
- Down + closing
- —
- Monthly P&I
- —
- Monthly cashflow
- —
- DSCR
- —
- Eligible?
- —
Short-term bridge; refi at stabilization.
Rent comps 40 comps
| Address | Beds | Baths | Sqft | Rent | $/sqft | DOM | Units | Dist |
|---|---|---|---|---|---|---|---|---|
| 1309 Greenwood Ave Killeen, TX | 3.0 | 1.0 | 925 | $900 | $0.97 | 23d | 1 | 0.01mi |
| 1201 Greenwood Ave Killeen, TX | 4.0 | 2.0 | 1276 | $1,350 | $1.06 | 45d | 1 | 0.10mi |
| 508 Patton Dr Killeen, TX | 3.0 | 1.5 | 924 | $1,150 | $1.24 | 25d | 1 | 0.21mi |
| 715 Cardinal Ave Killeen, TX | 3.0 | 1.0 | 1142 | $800 | $0.70 | 45d | 1 | 0.27mi |
| 501 N 18th St Unit B Killeen, TX | 3.0 | 1.5 | 1286 | $1,250 | $0.97 | 25d | 1 | 0.30mi |
| 905 Parmer Ave Unit A Killeen, TX | 3.0 | 1.0 | 1672 | $750 | $0.45 | 45d | 1 | 0.30mi |
| 705 Crockett Dr Killeen, TX | 3.0 | 1.0 | 1174 | $1,095 | $0.93 | 45d | 1 | 0.32mi |
| 1108 Stewart St Killeen, TX | 3.0 | 1.0 | 995 | $1,150 | $1.16 | 25d | 1 | 0.48mi |
| 506 Powell St Killeen, TX | 3.0 | 1.0 | 1546 | $1,400 | $0.91 | 45d | 1 | 0.50mi |
| 1208 Alexander St Killeen, TX | 4.0 | 3.0 | 1500 | $1,600 | $1.07 | 45d | 1 | 0.53mi |
| 1704 Smith Dr Killeen, TX | 2.0 | 1.0 | 925 | $1,000 | $1.08 | 45d | 1 | 0.55mi |
| 1309 Carol Way Killeen, TX | 4.0 | 2.5 | 1600 | $1,350 | $0.84 | 45d | 1 | 0.55mi |
| 1204 N 18th St Unit B Killeen, TX | 3.0 | 2.0 | 1200 | $1,200 | $1.00 | 45d | 1 | 0.57mi |
| 1703 Smith Dr Killeen, TX | 2.0 | 1.0 | 1176 | $900 | $0.77 | 25d | 1 | 0.57mi |
| 1312 Carol Way Killeen, TX | 3.0 | 1.0 | 1221 | $1,100 | $0.90 | 15d | 1 | 0.58mi |
| 1206 Middleton St Killeen, TX | 2.0 | 1.0 | 1750 | $800 | $0.46 | 45d | 1 | 0.59mi |
| 1701 Elkins Ave Killeen, TX | 3.0 | 1.0 | 918 | $1,000 | $1.09 | 15d | 1 | 0.62mi |
| 801 S W S Young Dr Killeen, TX | 3.0 | 1.0–2.0 | 1027 | $2,043 | $1.99 | 15d | 12 | 0.66mi |
| 1015 N 10th St Unit B Killeen, TX | 3.0 | 2.0 | 1118 | $1,100 | $0.98 | 45d | 1 | 0.67mi |
| 724 Carrie Ave Killeen, TX | 3.0 | 1.0 | 1100 | $1,000 | $0.91 | 45d | 1 | 0.69mi |
| 1901 Poage Ave Killeen, TX | 2.0 | 1.0 | 1596 | $875 | $0.55 | 45d | 1 | 0.81mi |
| 1915 Poage Ave Killeen, TX | 2.0 | 1.0 | 875 | $850 | $0.97 | 45d | 1 | 0.83mi |
| 907 Wells St Killeen, TX | 3.0 | 1.0 | 1050 | $950 | $0.90 | 25d | 1 | 0.83mi |
| 2303 Debra Cir Killeen, TX | 3.0 | 1.5 | 1617 | $1,600 | $0.99 | 25d | 1 | 0.85mi |
| 913 Estelle Ave Killeen, TX | 4.0 | 2.0 | 1292 | $1,445 | $1.12 | 15d | 1 | 0.85mi |
| 209 West Avenue A Unit A Killeen, TX | 3.0 | 2.0 | 876 | $935 | $1.07 | 15d | 1 | 0.87mi |
| 1507 N 8th St Unit 8 Killeen, TX | 3.0 | 2.0 | 1116 | $995 | $0.89 | 25d | 1 | 0.88mi |
| 2701 Stetson Ave #2703 Killeen, TX | 2.0 | 1.0 | 1536 | $800 | $0.52 | 45d | 1 | 0.90mi |
| 2218 Terrace Dr Killeen, TX | 3.0 | 2.0 | 1772 | $1,750 | $0.99 | 15d | 1 | 0.93mi |
| 2307 Terrace Dr Unit C Killeen, TX | 3.0 | 2.0 | 1203 | $850 | $0.71 | 15d | 1 | 0.93mi |
| 1901 N 10th St Unit 3 Killeen, TX | 2.0 | 1.0 | 920 | $745 | $0.81 | 45d | 1 | 0.94mi |
| 710 Stetson Ave Unit 712 Killeen, TX | 2.0 | 1.0 | 1725 | $800 | $0.46 | 45d | 1 | 0.94mi |
| 808 Stetson Ave Unit 806 Killeen, TX | 2.0 | 1.0 | 1650 | $825 | $0.50 | 45d | 1 | 0.97mi |
| 2701 Hillside Dr Killeen, TX | 3.0 | 1.0 | 924 | $995 | $1.08 | 23d | 1 | 0.97mi |
| 2318 Terrace Dr Killeen, TX | 3.0 | 2.0 | 1370 | $1,299 | $0.95 | 46d | 1 | 0.98mi |
| 1809 N W S Young Dr Unit 1B Killeen, TX | 2.0 | 2.0 | 1200 | $1,050 | $0.88 | 45d | 1 | 1.00mi |
| 1111 N College St Unit B Killeen, TX | 3.0 | 2.0 | 1235 | $995 | $0.81 | 15d | 1 | 1.02mi |
| 910 Stetson Ave Unit (SR PnB) 910-912 Stetson Killeen, TX | 3.0 | 1.0 | 1082 | $900 | $0.83 | 25d | 1 | 1.02mi |
| 3107 Atkinson Ave Killeen, TX | 1.0–2.0 | 1.0–2.0 | 756 | $700 | $0.93 | 45d | 1 | 1.05mi |
| 3109 Atkinson Ave Apt 219 Killeen, TX | 2.0 | 2.0 | 1008 | $575 | $0.57 | 45d | 1 | 1.06mi |
Listing history 19 events
-
2026-06-22days on market $133,700 Active 103 DOM
-
2026-06-18days on market $133,700 Active 100 DOM
-
2026-06-17days on market $133,700 Active 99 DOM
-
2026-06-16days on market $133,700 Active 98 DOM
-
2026-06-15days on market $133,700 Active 97 DOM
-
2026-06-14days on market $133,700 Active 95 DOM
-
2026-06-13days on market $133,700 Active 94 DOM
-
2026-06-10days on market $133,700 Active 92 DOM
-
2026-06-09days on market $133,700 Active 91 DOM
-
2026-06-08days on market $133,700 Active 90 DOM
-
2026-06-07days on market $133,700 Active 89 DOM
-
2026-06-03days on market $133,700 Active 85 DOM
-
2026-06-02days on market $133,700 Active 84 DOM
-
2026-06-01days on market $133,700 Active 83 DOM
-
2026-05-31days on market $133,700 Active 82 DOM
-
2026-05-30days on market $133,700 Active 81 DOM
-
2026-03-26price $133,700 436-char remark
Show marketing remark (436 chars)
Great investment opportunity! This well-maintained home is being sold as is and offers excellent potential. The roof was replaced in 2025, providing added peace of mind for the next owner. The second living area has been completely remodeled, offering flexible space for a family room, or entertainment area. The property features siding on all exterior surfaces and a large fenced backyard, perfect for outdoor enjoyment. Show anytime!
-
2026-03-10$140,000 Active 436-char remark
Show marketing remark (436 chars)
Great investment opportunity! This well-maintained home is being sold as is and offers excellent potential. The roof was replaced in 2025, providing added peace of mind for the next owner. The second living area has been completely remodeled, offering flexible space for a family room, or entertainment area. The property features siding on all exterior surfaces and a large fenced backyard, perfect for outdoor enjoyment. Show anytime!
-
1971-01-04soldstatus
ⓘ Source: listings_history table (triggers on properties + properties_extension) + one-shot
backfill from property_details.listing_events for pre-trigger history.
Tax reassessment forecast TX · Resets to sale price
- Current annual tax
- $2,637 · $220/mo
- Projected year-2 tax
- $2,637 · $220/mo
- Expected delta
- $0/yr ($0/mo · 0.0%)
ⓘ Screening estimate from a state-policy table — verify with the county assessor before closing.
Climate risk First Street
- Flood 1/10 Low FEMA zone X (shaded) · 0% chance over 30 yrs
- Wildfire 1/10 Low
- Heat 7/10 Severe 7 d/yr ≥107°F today · 23 d/yr by 30 yrs out
- Wind 6/10 Major 61% chance of damaging wind over 30 yrs
- Air quality 1/10 Low 0 unhealthy d/yr today · 0 by 30 yrs out
Nearby sold comps map
Loading sold comps map…
Walkable amenities ~0.75 mi
Loading nearby amenities…
Taxation est. · year 1
- Rental income
- $13,560
- − Mortgage interest
- −$7,489
- − Property taxes
- −$2,637
- − Insurance
- −$668
- − Repairs & maintenance
- −$1,085
- − Management
- −$1,085
- − Depreciation
- −$3,889
- Taxable loss
- −$3,294
- Est. tax savings @ 24.0%
- +$791
- After-tax cash flow
- $-216/yr
For passive investors: Depreciation is non-cash, so a rental often shows a tax loss while cash-flowing — sheltering income. Rental losses are passive: they offset passive income freely, and up to $25,000/yr can offset ordinary (W-2) income if you actively participate and your MAGI is under $100k (phasing out to $0 by $150k); unused losses carry forward. On sale, claimed depreciation is recaptured at up to 25%, and gains may owe capital-gains tax (a 1031 exchange can defer both). Figures are a year-1 estimate at your 24.0% rate — not tax advice; consult a CPA.
Schools (NCES district)
- District
- Killeen ISD
- NCES district ID
- 4825660
- Math proficiency
- 31% ▼ -16.00%
- Reading proficiency
- 38% ▼ -3.00%
- Median HH income
- $47,665
- Composite
- 29.69/100
- National rank
- #6458
- State rank
- #524 of 826 in TX
Livability — Killeen
- Score
- 63/100
- State rank
- #853
- US rank
- #15359
Category grades
Schools grade is shown separately in the Schools card above.
Census & demographics
- Census place
- Killeen, TX
- County
- Bell County · 345,090 people
- City population
- 163,398
- Metro
- Killeen-Temple, TX
- Population (ZIP)
- 19,011
- Household income
- $37,349
- Rent vs Own
- Severe rent burden
- 1668.0
Population outlook (Bell County) Hauer SSP2
- Today (2025)
- 371,114 people
- By 2030
- 389,104 · +4.8%
- By 2040
- 420,592 · +13.3%
- By 2050
- 447,779 · +20.7%
- By 2075
- 499,130 · +34.5%
- By 2100
- 505,680 · +36.3%
Race, ethnicity, and origin ACS 2023
- Neighborhood character
- Highly diverse neighborhood (Simpson 0.73)
- Race & ethnicity
- Hispanic / Latino 32% White 31% Black 27% Two or more races 10% Asian 3% Pacific Islander 1%
- Hispanic origin (detail)
- Mexican 21% Puerto Rican 6% Dominican 1%
- Common ancestry
- Italian 2% Slovak 1% Lithuanian 1%
- Foreign-born
- 14% · Canada, Vietnam, South Korea
- Languages at home
- 69% English-only · Spanish 25% German/W. Germanic 2% Korean 1%
Political lean MEDSL · Bell
- 2024 margin
- R (+16.2) · D 41.3% · R 57.6% · Other 1.1%
- 2008→2024 swing
- -6.5pp toward R · 2008: -9.8pp · 2024: -16.2pp
- All cycles
- 2024: R+16.2 2020: R+8.5 2016: R+15.1 2012: R+16.4 2008: R+9.8
Not yet ingested
- Civics
- —
Market trends
- HPI YoY
- ▲ 2.26%
- Current HPI
- 168.1206
- Rent YoY
- ▼ -2.00%
- Metro
- Killeen-Temple, TX
- State GDP YoY
- ▲ 3.95%
- F500 in state
- 110
Industry mix (Fortune 500 HQ in TX)
| Industry | F500 HQs | Revenue |
|---|---|---|
| Energy | 16 | $1,198B |
|
||
| Technology | 5 | $198B |
|
||
| Engineering / Construction | 4 | $72B |
|
||
| Energy Services | 3 | $60B |
|
||
| Utilities | 3 | $41B |
|
||
| Healthcare | 2 | $330B |
|
||
Price history
-4.5% since first listed3 events — show timeline
- 2026-03-26 Price Changed $133,700 CTXMLS
- 2026-03-10 Listed $140,000 CTXMLS
- 1971-01-04 Sold (Public Records) — Public Records
Property tax history
+8.9%/yrLatest (2025): $2,637 · +8.7% YoY. Source: county tax records.
Cash-flow waterfall
monthlySold comps — $/sqft
last 12 mo · ≤1 miLoading sold comps…