5995 N 78th St #1094 · Scottsdale, AZ
Flood risk 1/10 · Minimal
- FEMA flood zone
- X (shaded)
- Chance of flooding over 30 yrs
- 0.0%
- Est. flood insurance / yr
- $507 – $1,088
Fire risk 1/10 · Minimal
- Est. fire insurance / yr
- $610 – $1,132
Heat risk 8/10 · Major
- Hot days now (above 112°F)
- 6 days/yr
- Hot days in 30 yrs
- 16 days/yr
Wind risk 1/10 · Minimal
- Chance of severe wind over 30 yrs
- —
Air-quality risk 3/10 · Minor
- Unhealthy air days now
- 2 days/yr
- Unhealthy air days in 30 yrs
- 3 days/yr
Risk factors via First Street. Map © Google.
Why this score? — see what drove the D grade
The composite is a weighted blend of 9 inputs, each scored 0–100. Each bar is that input's sub-score; the figure is the points it added to the 100-point composite (weight × sub-score).
- Cash flow +12.2/30.0
- ARV discount +7.5/15.0
- Schools +4.8/10.0
- 1% rule +4.0/10.0
- Livability +4.0/5.0
- Rent growth +3.8/5.0
- DSCR +3.6/10.0
- Condition / age +2.5/5.0
- Appreciation +0.0/10.0
$270,000
🖨 Deal sheet (PDF) 📄 Offer letter ✓ Due diligence
Listing remarks MLS
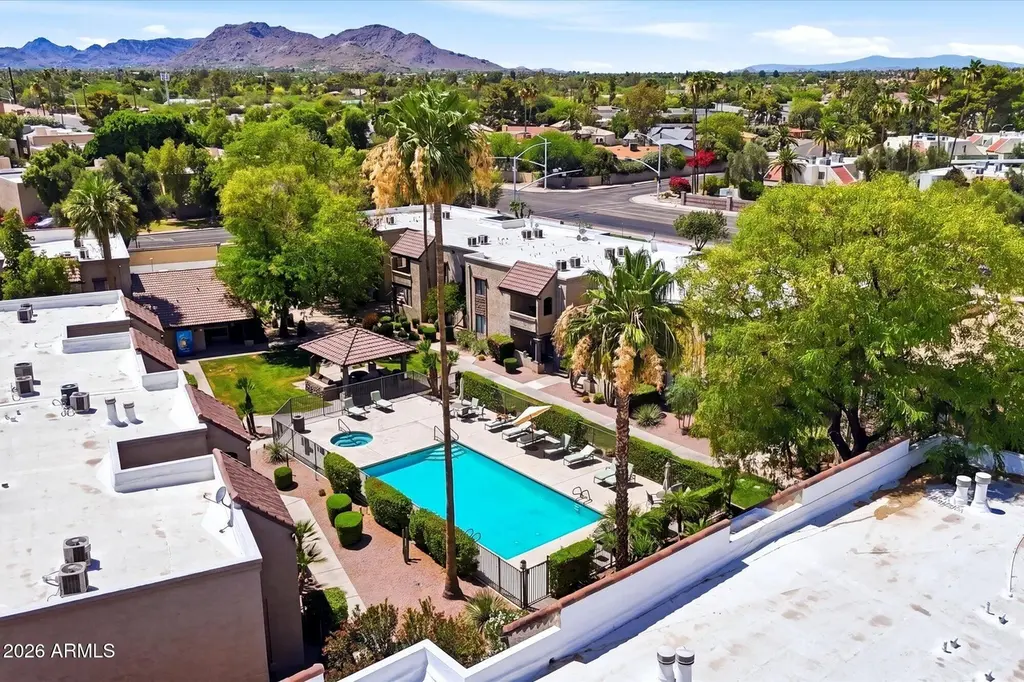
Highly sought after Bella Vita community 2br 2ba unit ready for move-in. Tastefully decorated fully furnished turn key condo perfect as a starter home, winter getaway, or investment rental. Upgrades feature cherry cabinets, granite counters, SS appliance and fridge, 20'' tile, dark laminate wood flooring, 2-tone paint, nickle finished, lighting fixtures, and ceiling fans throughout. Includes all furniture, home furnishing, electronics, kitchen hardware, and stackable w/d. Community has 2 pools, heated spa, fitness/clubhouse, BBQ picnic area, and tennis court. Centrally located in Scottsdale near to everything. Must see!!!
Key facts
- Updated showers
- Plantation shutters
- Walk in closet
Tags
Property features AI
Finance
- Other: Lot size recorded by assessor
- HOA & community: Monthly association fee; Association fee includes roof repair/replacement, insurance, sewer, grounds maintenance, exterior maintenance, trash and water
Exterior
- Parking: Assigned covered parking space; Assigned carport space
- Security: Gated community
- Utilities: City water; Public sewer
- Home design: Apartment (attached property); Fee simple ownership
- Construction: Stucco and painted wood-frame construction; Built-up roof
- Exterior features: Desert-front lot; No fencing; Community pool; Community spa (heated); Gated community; Fitness center
Interior
- Kitchen: Built-in microwave; Refrigerator; Dishwasher; Disposal
- Bedrooms: 2 possible bedrooms
- Flooring: Carpet; Tile
- Bathrooms: 2 full bathrooms
- Heating & cooling: Electric heating; Central air; Ceiling fans
- Interior features: High-speed internet; Granite counters; No interior steps; Full bathroom in primary bedroom
- Laundry & utility: Laundry inside unit
Neighborhood map
What this means for you Summary
Snapshot
- This is a 2-bed/2.0-bath condo listed at $270k.
Deal economics
- At list price, monthly cash flow is $-56 ($-671/yr) — negative.
- To cash-flow at today's rent, offer at most $260k (3.7% below list).
- To meet the 1% rule (rent ≥ 1% of price), the offer needs to be $242k (10.2% below list).
- Recommended offer: $242k (10.2% below list) — sets the bar for 1% rule.
- Cap rate 6.0% vs local median 2.5% in Scottsdale — top-decile yield for the area; either an underpriced asset or a hidden risk that comps aren't pricing in. Stress-test before assuming the spread holds.
Location & tenants
- Location reads 80/100 on livability (#4 in AZ, #1,756 nationally) — a professional / high-income tenant draw. Strengths: amenities A+, commute A+, employment A+; Watch: health & safety C-, cost of living F.
- Scottsdale Unified District (4240) (urban): math 53% / reading 55% proficiency, ranked #30 of 249 in AZ (top 12%) — acceptable for families but not a draw, mixed tenant base, ~2y average lease.
- Zoned schools: Pueblo Elementary School (math 62% / reading 67%, grade B, #104 of 1,109 statewide, top 10%, 425 students, 15% FRL); Mohave Middle School (math 45% / reading 48%, grade D+, #43 of 218 statewide, top 20%, 799 students, 31% FRL); Saguaro High School (math 37% / reading 41%, grade F, #78 of 381 statewide, top 20%, 1,466 students, 25% FRL) — zoned schools at 24% FRL track the district average.
- Market conditions: Rents rising fast (+5.2%/yr); 216 active listings in the ZIP; 40 comparable units currently listed for rent nearby; rentals at typical pace (median 19d on market — plan ~3-4 weeks tenant-placement turnaround); solid renter incomes; 36,011 units permitted in Maricopa County in 2024 (12,801 in 5+ unit buildings).
- This rent runs 30% of the median local income ($96k/yr) — at the standard rent-burdened threshold; future hikes will face affordability resistance.
Forward outlook
- Local home prices are declining (-3.0%/yr); year-one equity from $2k of loan paydown is wiped out by about $8k of value loss. Plan a longer hold.
- Maricopa County population projected at +38% by 2050 — long-run rental-demand tailwind backs the buy-and-hold thesis.
Negotiation context
- It's been on market 24 days — a 2% lower offer ($266k) is reasonable based on typical stale-listing flexibility.
- 4 sale attempts since 18y ago with the ask held roughly flat each time — persistent listings suggest the price (not the market) is what's stuck; bring a comps-based counter.
- Current owner paid $170k; list at $270k implies a 59% gain — meaningful room to come down on a strong offer.
Risks & watch-outs
- Climate carrying-cost: extreme-heat days projected 6→16/yr by 2055 (HVAC capex compounding) — expect insurance premiums to compound above CPI over the hold.
Questions for the listing agent
- What do current leases actually rent for vs. the listed asking? Can we see a recent rent roll and the last 12 months of T-12 income?
- What does the HOA fee cover, when was the last increase, and are there any pending special assessments or reserve-fund shortfalls?
- Any open or pending special assessments — roof, HVAC, plumbing, elevator, façade? What's the per-unit balance and payoff schedule, and is the seller paying it off at close or rolling it to the buyer?
- Is there a deadline driving the sale (1031 exchange, divorce, estate, relocation)? That informs how much negotiation room exists.
- Schools are A-rated — typically a magnet for longer-tenancy family renters. What's the average tenant stay here, and is there a school-zone premium baked into asking?
- The area grade is low — what's the realistic commute time and amenity access for the typical tenant pool here? Any planned neighborhood developments (good or bad) we should know about?
- What's the average days-on-market for RENTAL listings here right now (not sales)? A rising rental-DOM trend means longer vacancies and softer asking-rent achievability than the comps imply.
- What's the recent tenant-quality profile in this submarket — average credit score on applications, eviction rate, late-payment / NSF rate, and stable-employment percentage? A property-management company in the area should have these aggregated.
- How much new apartment / multifamily construction is in the pipeline within 1–3 miles? Heavy new supply (>2% of stock underway) typically softens rents 12–24 months out; light construction supports rent growth.
Investment metrics
- 1% rule
- 0.90% ✗
- Cap rate
- 6.04%
- Cash-on-cash
- -0.89%
- DSCR
- 0.96
- GRM
- 9.3
CMA / ARV
No comps found within radius.
Projected returns pro-forma
-3.0% appreciation · 5.17% rent growth · sell at horizon
- IRR
- -15.2%
- Equity multiple
- 0.45×
- Total profit
- $-41,802
- Equity at exit
- $40,258
- IRR
- -3.1%
- Equity multiple
- 0.77×
- Total profit
- $-17,368
- Equity at exit
- $23,345
Cash invested: $75,600 (down + closing). Projections, not guarantees.
Landlord ↔ Tenant lean methodology
- Overall (STATE)
- 87 Strongly Landlord-Friendly
- State Arizona
- 87 Strongly Landlord-Friendly · R+3
- County
- — inherits STATE
- City
- — inherits STATE
ZIP-level market 85250
- Rents YoY
- 5.2%
- Active inventory
- 216
- Price-to-rent
- 9.3×
Monthly cashflow live
- Estimated rent
- $2,425 high interval (Pro) →
- Mortgage (P&I)
- −$1,416
- Tax from tax record
- −$95 /mo · $1,143/yr
- Insurance
- −$112
- HOA
- −$348
- Lot rent
- −$0
- Vacancy / Maint / Mgmt
- −$509
- Net cashflow
- $-56
Break-even live
Sensitivity live
| Price | -10% $97 | -5% $21 | +0% $-56 | +5% $-132 | +10% $-209 |
|---|---|---|---|---|---|
| Rent | -10% $-247 | -5% $-152 | +0% $-56 | +5% $40 | +10% $136 |
| Rate | -1.0pp $80 | -0.5pp $13 | base $-56 | +0.5pp $-126 | +1.0pp $-197 |
UW: 25.0% down · 7.5% · 30yr · 1.5% tax · 5.0% vac · 8.0% maint · 8.0% mgmt
Financing live
Cash to close
- Down payment
- $67,500
- Closing costs
- $8,100
- Reserves months
- —
- Total cash needed
- —
Loan-product check · same deal, 3 products live
Conventional
25% down · 7.5% · 30yr
- Down + closing
- —
- Monthly P&I
- —
- Monthly cashflow
- —
- DSCR
- —
- Eligible?
- —
Personal DTI + credit; lowest rate.
DSCR
20% down · 8.5% · 30yr
- Down + closing
- —
- Monthly P&I
- —
- Monthly cashflow
- —
- DSCR
- —
- Eligible?
- —
No personal income docs; deal must DSCR.
Hard money
10% down · 12.0% · 12mo
- Down + closing
- —
- Monthly P&I
- —
- Monthly cashflow
- —
- DSCR
- —
- Eligible?
- —
Short-term bridge; refi at stabilization.
Rent comps 40 comps
| Address | Beds | Baths | Sqft | Rent | $/sqft | DOM | Units | Dist |
|---|---|---|---|---|---|---|---|---|
| 5995 N 78th St Unit 1545827P Scottsdale, AZ | 2.0 | 2.0 | 1097 | $1,998 | $1.82 | 16d | 1 | 0.01mi |
| 5995 N 78th St Unit 101 Scottsdale, AZ | 1.0 | 2.0 | 664 | $2,800 | $4.22 | 46d | 1 | 0.06mi |
| 5995 N 78th St Scottsdale, AZ | 1.0–2.0 | 1.0–3.5 | 761 | $4,000 | $5.26 | 46d | 8 | 0.08mi |
| 5995 N 78th St Scottsdale, AZ | 1.0–2.0 | 1.0–2.0 | 761 | $4,800 | $6.31 | 1d | 10 | 0.08mi |
| 6014 N 79th St Scottsdale, AZ | 2.0 | 1.5 | 976 | $2,000 | $2.05 | 46d | 1 | 0.10mi |
| 7845 E Valley Vista Dr Scottsdale, AZ | 3.0 | 2.0 | 1053 | $2,450 | $2.33 | 46d | 1 | 0.19mi |
| 7913 E Keim Dr Unit 1545939P Scottsdale, AZ | 2.0 | 1.0 | 979 | $1,717 | $1.75 | 19d | 1 | 0.22mi |
| 5950 N 78th St #216 Scottsdale, AZ | 2.0 | 2.0 | 1036 | $3,500 | $3.38 | 19d | 1 | 0.23mi |
| 5950 N 78th St Scottsdale, AZ | 2.0 | 2.0 | 1036 | $2,725 | $2.63 | 26d | 2 | 0.24mi |
| 7906 E Keim Dr Scottsdale, AZ | 3.0 | 1.0 | 1053 | $3,700 | $3.51 | 46d | 1 | 0.27mi |
| 7810 E Keim Dr Scottsdale, AZ | 2.0 | 1.5 | 1053 | $2,295 | $2.18 | 10d | 1 | 0.31mi |
| 5972 N 83rd St Scottsdale, AZ | 2.0 | 2.0 | 1088 | $3,500 | $3.22 | 46d | 1 | 0.35mi |
| 5878 N 83rd St Scottsdale, AZ | 2.0 | 2.0 | 1088 | $2,850 | $2.62 | 46d | 1 | 0.37mi |
| 8310 E McDonald Dr Scottsdale, AZ | 1.0–2.0 | 1.0–2.0 | 880 | $1,760 | $2.00 | 1d | 9 | 0.54mi |
| 8025 E Lincoln Dr Scottsdale, AZ | 1.0–2.0 | 1.0–2.0 | 825 | $1,765 | $2.14 | 0d | 11 | 0.55mi |
| 6459 N 77th Way Scottsdale, AZ | 2.0 | 2.0 | 1070 | $2,795 | $2.61 | 46d | 1 | 0.59mi |
| 6480 N 82nd St #1133 Scottsdale, AZ | 2.0 | 2.0 | 1110 | $1,799 | $1.62 | 19d | 1 | 0.60mi |
| 6480 N 82nd St #2234 Scottsdale, AZ | 2.0 | 2.0 | 1110 | $1,795 | $1.62 | 22d | 1 | 0.61mi |
| 6480 N 82nd St Unit 237 Scottsdale, AZ | 2.0 | 2.0 | 1110 | $1,700 | $1.53 | 16d | 1 | 0.63mi |
| 6480 N 82nd St #2213 Scottsdale, AZ | 2.0 | 1.5 | 1110 | $2,099 | $1.89 | 46d | 1 | 0.64mi |
| 5877 N Granite Reef Rd Scottsdale, AZ | 1.0–2.0 | 1.0–2.0 | 821 | $1,895 | $2.31 | 1d | 3 | 0.71mi |
| 5877 N Granite Reef Rd Scottsdale, AZ | 2.0 | 1.0–2.0 | 816 | $1,748 | $2.14 | 1d | 2 | 0.71mi |
| 6077 N Granite Reef Rd Scottsdale, AZ | 2.0 | 1.5 | 1088 | $2,550 | $2.34 | 46d | 1 | 0.76mi |
| 7575 E Indian Bend Rd Scottsdale, AZ | 2.0–3.0 | 2.0 | 1151 | $3,200 | $2.78 | 10d | 2 | 1.01mi |
| 7575 E Indian Bend Rd Scottsdale, AZ | 2.0–3.0 | 2.0 | 1151 | $2,345 | $2.04 | 14d | 3 | 1.01mi |
| 7575 E Indian Bend Rd Scottsdale, AZ | 1.0–3.0 | 1.0–2.0 | 980 | $3,125 | $3.19 | 6d | 3 | 1.01mi |
| 7575 E Indian Bend Rd Scottsdale, AZ | 1.0–3.0 | 1.0–2.0 | 980 | $2,375 | $2.42 | 18d | 4 | 1.01mi |
| 7575 E Indian Bend Rd Unit 709 Scottsdale, AZ | 2.0 | 2.0 | 1070 | $2,800 | $2.62 | 26d | 1 | 1.01mi |
| 8651 E Royal Palm Rd Scottsdale, AZ | 1.0–2.0 | 1.0–2.0 | 1109 | $2,495 | $2.25 | 1d | 3 | 1.02mi |
| 8651 E Royal Palm Rd Scottsdale, AZ | 1.0–2.0 | 1.0–2.0 | 1109 | $2,495 | $2.25 | 17d | 4 | 1.02mi |
| 4950 N Miller Rd Unit ROAD200 Scottsdale, AZ | 2.0 | 2.0 | 1100 | $2,100 | $1.91 | 5d | 1 | 1.03mi |
| 4950 N Miller Rd #339 Scottsdale, AZ | 1.0 | 1.0 | 726 | $1,800 | $2.48 | 26d | 1 | 1.03mi |
| 7436 E Chaparral Rd Scottsdale, AZ | 1.0–2.0 | 1.0–2.0 | 790 | $4,750 | $6.01 | 20d | 3 | 1.04mi |
| 7436 E Chaparral Rd Scottsdale, AZ | 1.0–2.0 | 1.0–2.0 | 790 | $4,750 | $6.01 | 5d | 6 | 1.04mi |
| 7430 E Chaparral Rd Unit 125A Scottsdale, AZ | 2.0 | 2.0 | 1000 | $1,600 | $1.60 | 26d | 1 | 1.05mi |
| 7575 E Indian Bend Rd Scottsdale, AZ | 1.0 | 1.0 | 731 | $1,550 | $2.12 | 16d | 1 | 1.06mi |
| 7430 E Chaparral Rd Scottsdale, AZ | 1.0–2.0 | 1.0–2.0 | 862 | $2,450 | $2.84 | 5d | 4 | 1.07mi |
| 7430 E Chaparral Rd Unit A2533 Scottsdale, AZ | 2.0 | 2.0 | 1002 | $1,750 | $1.75 | 26d | 1 | 1.07mi |
| 4950 N Miller Rd Scottsdale, AZ | 1.0 | 1.0 | 726 | $1,425 | $1.96 | 1d | 2 | 1.09mi |
| 4950 N Miller Rd Scottsdale, AZ | 1.0 | 1.0 | 726 | $1,388 | $1.91 | 19d | 3 | 1.09mi |
HOA detail condo
- Monthly dues
- $348 · $4,176/yr
- Likely covers
- pool
- Assessments
- None detected in remarks — confirm with the listing agent.
Listing history 16 events
-
2026-06-22days on market $270,000 Active 24 DOM
-
2026-06-21days on market $270,000 Active 23 DOM
-
2026-06-18days on market $270,000 Active 20 DOM
-
2026-06-17days on market $270,000 Active 19 DOM
-
2026-06-16days on market $270,000 Active 18 DOM
-
2026-06-15days on market $270,000 Active 17 DOM
-
2026-06-13days on market $270,000 Active 15 DOM
-
2026-06-13days on market $270,000 Active 14 DOM
-
2026-06-09days on market $270,000 Active 11 DOM
-
2026-06-08days on market $270,000 Active 10 DOM
-
2026-06-07days on market $270,000 Active 9 DOM
-
2026-06-04days on market $270,000 Active 6 DOM
-
2026-06-03days on market $270,000 Active 5 DOM
-
2026-06-02days on market $270,000 Active 4 DOM
-
2026-06-01days on market $270,000 Active 3 DOM
-
2026-05-31days on market $270,000 Active 2 DOM
ⓘ Source: listings_history table (triggers on properties + properties_extension) + one-shot
backfill from property_details.listing_events for pre-trigger history.
Tax reassessment forecast AZ · Resets to sale price
- Current annual tax
- $1,143 · $95/mo
- Projected year-2 tax
- $1,782 · $148/mo
- Expected delta
- +$639/yr (+$53/mo · 56.0%)
ⓘ Screening estimate from a state-policy table — verify with the county assessor before closing.
Climate risk First Street
- Flood 1/10 Low FEMA zone X (shaded) · 0% chance over 30 yrs
- Wildfire 1/10 Low
- Heat 8/10 Severe 6 d/yr ≥112°F today · 16 d/yr by 30 yrs out
- Wind 1/10 Low
- Air quality 3/10 Moderate 2 unhealthy d/yr today · 3 by 30 yrs out
Nearby sold comps map
Loading sold comps map…
Walkable amenities ~0.75 mi
Loading nearby amenities…
Taxation est. · year 1
- Rental income
- $29,100
- − Mortgage interest
- −$15,124
- − Property taxes
- −$1,143
- − Insurance
- −$1,350
- − Repairs & maintenance
- −$2,328
- − Management
- −$2,328
- − HOA
- −$4,176
- − Depreciation
- −$7,855
- Taxable loss
- −$5,204
- Est. tax savings @ 24.0%
- +$1,249
- After-tax cash flow
- $578/yr
For passive investors: Depreciation is non-cash, so a rental often shows a tax loss while cash-flowing — sheltering income. Rental losses are passive: they offset passive income freely, and up to $25,000/yr can offset ordinary (W-2) income if you actively participate and your MAGI is under $100k (phasing out to $0 by $150k); unused losses carry forward. On sale, claimed depreciation is recaptured at up to 25%, and gains may owe capital-gains tax (a 1031 exchange can defer both). Figures are a year-1 estimate at your 24.0% rate — not tax advice; consult a CPA.
Schools (NCES district)
- District
- Scottsdale Unified District (4240)
- NCES district ID
- 0407570
- Math proficiency
- 53% ▼ -10.00%
- Reading proficiency
- 55% ▼ -8.00%
- Median HH income
- $70,139
- Composite
- 48.02/100
- National rank
- #2196
- State rank
- #30 of 249 in AZ
Livability — Scottsdale
- Score
- 80/100
- State rank
- #4
- US rank
- #1756
Category grades
Schools grade is shown separately in the Schools card above.
Census & demographics
- Census place
- Scottsdale, AZ
- County
- Maricopa County · 4,537,380 people
- City population
- 290,846
- Metro
- Phoenix-Mesa-Chandler, AZ
- Population (ZIP)
- 15,394
- Household income
- $95,761
- Rent vs Own
- Severe rent burden
- 288.0
Population outlook (Maricopa County) Hauer SSP2
- Today (2025)
- 4,979,203 people
- By 2030
- 5,378,229 · +8.0%
- By 2040
- 6,156,598 · +23.6%
- By 2050
- 6,872,376 · +38.0%
- By 2075
- 8,401,270 · +68.7%
- By 2100
- 9,247,439 · +85.7%
Race, ethnicity, and origin ACS 2023
- Neighborhood character
- Predominantly White (78%)
- Race & ethnicity
- White 78% Hispanic / Latino 8% Two or more races 8% Asian 5% Native American 2% Black 1%
- Hispanic origin (detail)
- Mexican 6%
- Common ancestry
- Romanian 4% Portuguese 2% Lithuanian 2%
- Foreign-born
- 10% · Canada, South Korea, Vietnam
- Languages at home
- 91% English-only · Spanish 4% Other Indo-European 2% Russian/Polish/Slavic 1%
Political lean MEDSL · Maricopa
- 2024 margin
- Toss-up / Even · D 47.7% · R 51.2% · Other 1.1%
- 2008→2024 swing
- +7.1pp toward D · 2008: -10.6pp · 2024: -3.5pp
- All cycles
- 2024: R+3.5 2020: D+2.2 2016: R+3.5 2012: R+12.0 2008: R+10.6
Not yet ingested
- Civics
- —
Market trends
- HPI YoY
- ▼ -568.01%
- Current HPI
- 385.5354
- Rent YoY
- ▲ 5.17%
- Metro
- Phoenix-Mesa-Chandler, AZ
- State GDP YoY
- ▲ 4.54%
- F500 in state
- 20
Industry mix (Fortune 500 HQ in AZ)
| Industry | F500 HQs | Revenue |
|---|---|---|
| Technology | 2 | $13B |
|
||
| Mining / Metals | 1 | $23B |
|
||
| Environmental Services | 1 | $16B |
|
||
| Metals / Steel | 1 | $14B |
|
||
| Technology Distribution | 1 | $9B |
|
||
| Homebuilding | 1 | $8B |
|
||
Price history
-97.1% since first listed12 events — show timeline
- 2026-05-29 Listed $270,000 ARMLS
- 2013-06-07 Sold (Public Records) $169,900 Public Records
- 2013-06-07 Sold (MLS) $169,900 ARMLS
- 2013-05-21 Pending — ARMLS
- 2013-05-18 Relisted — ARMLS
- 2013-05-17 Pending — ARMLS
- 2013-05-02 Listed $169,900 ARMLS
- 2009-11-06 Sold (MLS) $142,000 ARMLS
- 2009-10-27 Listing Removed — ARMLS
- 2008-11-19 Listed $149,950 ARMLS
- 1999-01-29 Sold (Public Records) $95,174,800 Public Records
- 1981-05-14 Sold (Public Records) $9,266,864 Public Records
Property tax history
+3.3%/yrLatest (2025): $1,143 · +4.4% YoY. Source: county tax records.
Cash-flow waterfall
monthlySold comps — $/sqft
last 12 mo · ≤1 miLoading sold comps…