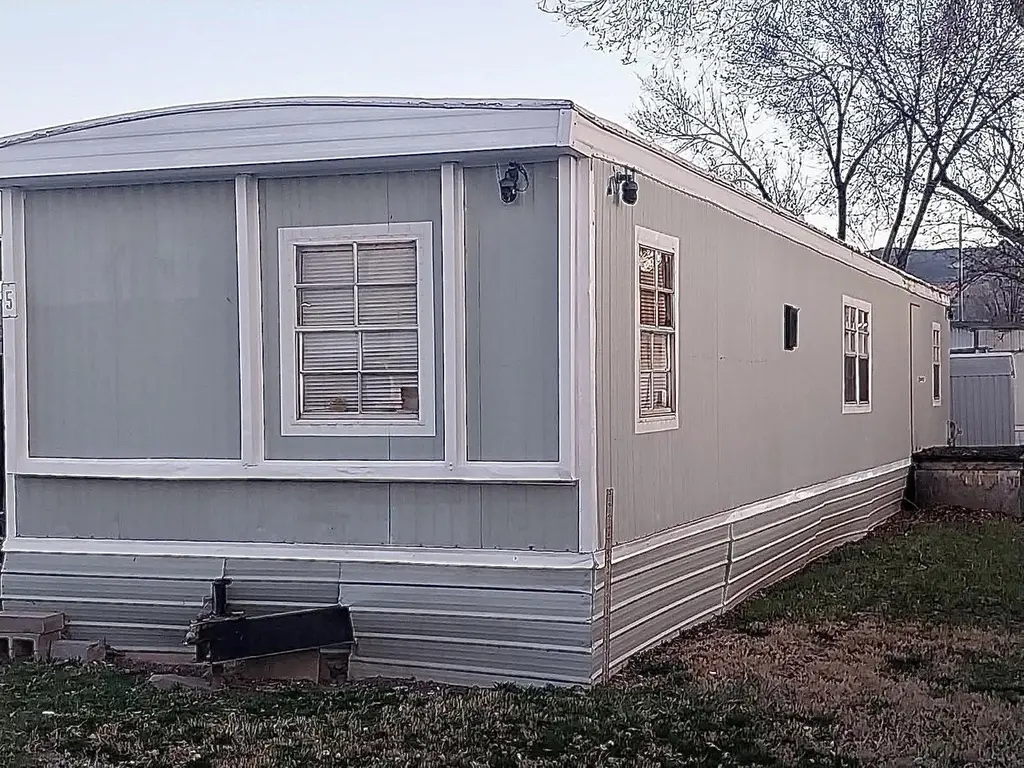
1802 Highway 6&50 #5 · Fruita, CO
Flood risk 1/10 · Minimal
- FEMA flood zone
- X (unshaded)
- Chance of flooding over 30 yrs
- 0.0%
- Est. flood insurance / yr
- $507 – $1,088
Fire risk 4/10 · Minor
- Est. fire insurance / yr
- $939 – $1,743
Heat risk 5/10 · Moderate
- Hot days now (above 96°F)
- 7 days/yr
- Hot days in 30 yrs
- 18 days/yr
Wind risk 1/10 · Minimal
- Chance of severe wind over 30 yrs
- —
Air-quality risk 2/10 · Minimal
- Unhealthy air days now
- 1 days/yr
- Unhealthy air days in 30 yrs
- 1 days/yr
Risk factors via First Street. Map © Google.
Why this score? — see what drove the D- grade
The composite is a weighted blend of 9 inputs, each scored 0–100. Each bar is that input's sub-score; the figure is the points it added to the 100-point composite (weight × sub-score).
- Cash flow +15.0/30.0
- 1% rule +5.0/10.0
- DSCR +5.0/10.0
- Rent growth +3.7/5.0
- Livability +3.7/5.0
- Schools +2.8/10.0
- Condition / age +2.5/5.0
- ARV discount +0.0/15.0
- Appreciation +0.0/10.0
$35,000
🖨 Deal sheet (PDF) 📄 Offer letter ✓ Due diligence
Listing remarks
Move in ready and sits on corner lot. Well maintained with updated interior. This property offers tankless hot water heater installed for efficiency and convenience. Newer stove and refrigerator. The washer and dryer included as well. Interior highlights include: newer vinyl wood flooring and doors throughout. Fresh paint and updated trim. The kitchen offers extra cabinets and counterspace for storage and functionality. The bathroom has been updated with a new tub surround, toilet, and faucets. Large 8x16 covered porch for entertaining and relaxing.
Key facts
- Larger corner lot
- Recent updates
- Porch addition
Tags
Property features AI
Finance
- Other: Public maintained road access on a city street; Irregular lot dimensions; Elevation approximately 4,600 ft; Zoned residential
- HOA & community: Homeowners association with a $580 monthly fee; Land is leased
Exterior
- Utilities: Public water; Sewer connected
- Home design: Mobile home (single wide); One story; Faces south; Residential property
- Construction: Metal siding; Metal roof; Built with a foundation (details not provided)
- Exterior features: Covered patio; Shed(s)
Interior
- Kitchen: Gas oven; Gas range; Microwave; Refrigerator
- Flooring: Carpet; Laminate; Simulated wood
- Heating & cooling: Forced air heating (natural gas); Evaporative cooling
- Interior features: Window coverings; No fireplace
- Laundry & utility: Dryer; Washer; Laundry area (other)
Neighborhood map
What this means for you Summary
Snapshot
- This is a 2-bed/1.0-bath manufactured listed at $35k.
Deal economics
- At list price, monthly cash flow is $426 ($5k/yr) — positive.
- The deal already cash-flows at list — no discount required.
- Meets the 1% rule at list price ($2k rent vs $35k).
- Recommended offer: $34k (1.5% below list) — sets the bar for market timing.
- Cap rate 20.9% vs local median 3.0% in Fruita — top-decile yield for the area; either an underpriced asset or a hidden risk that comps aren't pricing in. Stress-test before assuming the spread holds.
Location & tenants
- Location reads 73/100 on livability (#54 in CO) — a middle-class / working-renter tenant base. Strengths: crime A+, health & safety A+, housing A-; Watch: commute F, employment D-.
- Mesa County Valley School District No. 51 (suburban): math 26% / reading 38% proficiency, ranked #43 of 86 in CO (top 50%) — families likely to look elsewhere, expect single-tenant / working-renter base with shorter leases.
- Zoned schools: Rim Rock Elementary School (math 37% / reading 37%, grade F, #405 of 966 statewide, top 43%, 332 students, 37% FRL); Fruita Middle School (math 22% / reading 29%, grade F, #164 of 270 statewide, top 61%, 496 students, 32% FRL); Fruita Monument High School (math 38% / reading 62%, grade D+, #95 of 381 statewide, top 25%, 1,304 students, 18% FRL).
- Market conditions: Rents rising fast (+4.7%/yr); 254 active listings in the ZIP; 1 comparable units currently listed for rent nearby; solid renter incomes; 1,014 units permitted in Mesa County in 2024 (240 in 5+ unit buildings).
Forward outlook
- Local home prices are declining (-3.0%/yr); year-one equity from $242 of loan paydown is wiped out by about $1k of value loss. Plan a longer hold.
- At projected returns (-3.0% appreciation + 4.7% rent growth), your $10k cash investment doubles in ~3 years — after that, you're playing with house money.
Negotiation context
- It's been on market 27 days — a 2% lower offer ($34k) is reasonable based on typical stale-listing flexibility.
Risks & watch-outs
- Watch-outs: HOA is 37% of rent.
- Climate carrying-cost: extreme-heat days projected 7→18/yr by 2055 (HVAC capex compounding) — expect insurance premiums to compound above CPI over the hold.
Questions for the listing agent
- Built in 1974 — when were the roof, HVAC, electrical panel, plumbing, and water heater last replaced?
- What does the HOA fee cover, when was the last increase, and are there any pending special assessments or reserve-fund shortfalls?
- Is there a deadline driving the sale (1031 exchange, divorce, estate, relocation)? That informs how much negotiation room exists.
- Schools are D-rated, which usually means shorter tenancies and higher turnover. Who's the typical renter profile here, and what's been the actual vacancy rate?
- The area grade is low — what's the realistic commute time and amenity access for the typical tenant pool here? Any planned neighborhood developments (good or bad) we should know about?
- What's the average days-on-market for RENTAL listings here right now (not sales)? A rising rental-DOM trend means longer vacancies and softer asking-rent achievability than the comps imply.
- What's the recent tenant-quality profile in this submarket — average credit score on applications, eviction rate, late-payment / NSF rate, and stable-employment percentage? A property-management company in the area should have these aggregated.
- How much new for-sale + rental construction is in the pipeline within 1–3 miles? Heavy new supply typically softens prices + rents 12–24 months out; constrained supply supports both.
Investment metrics
- 1% rule
- 4.51% ✓
- Cap rate
- 20.89%
- Cash-on-cash
- 52.13%
- DSCR
- 3.32
- GRM
- 1.8
CMA / ARV
- ARV (on-the-fly)
- $27,552
- Comps found
- 1
Show comp detail 1 sale within ~0.75 mi
| Address | Dist | Beds/Ba | Sqft | Sold | Price | $/sf | Match |
|---|---|---|---|---|---|---|---|
| 1802 Highway 6&50 #5 | 0.00mi | 2/1.0 | 672 (0%) | 1mo | $27,500 | $41 | 99 |
Match score weights: distance 35% · size 25% · config 20% · recency 20%. Top-matched comps best support the ARV.
Projected returns pro-forma
-3.0% appreciation · 4.71% rent growth · sell at horizon
- IRR
- 54.1%
- Equity multiple
- 3.51×
- Total profit
- $24,585
- Equity at exit
- $5,219
- IRR
- 60.5%
- Equity multiple
- 8.10×
- Total profit
- $69,606
- Equity at exit
- $3,026
Cash invested: $9,800 (down + closing). Projections, not guarantees.
Landlord ↔ Tenant lean methodology
- Overall (STATE)
- 38 Tenant-Leaning
- State Colorado
- 38 Tenant-Leaning · D+4
- County
- — inherits STATE
- City
- — inherits STATE
ZIP-level market 81521
- Rents YoY
- 4.7%
- Active inventory
- 254
- Price-to-rent
- 1.8×
Monthly cashflow live
- Estimated rent
- $1,579 medium interval (Pro) →
- Mortgage (P&I)
- −$184
- Tax est. 1.5%
- −$44 /mo · $525/yr
- Insurance
- −$15
- HOA
- −$580
- Vacancy / Maint / Mgmt
- −$332
- Net cashflow
- $426
Break-even live
Sensitivity live
| Price | -10% $450 | -5% $438 | +0% $426 | +5% $414 | +10% $402 |
|---|---|---|---|---|---|
| Rent | -10% $301 | -5% $363 | +0% $426 | +5% $488 | +10% $550 |
| Rate | -1.0pp $443 | -0.5pp $435 | base $426 | +0.5pp $417 | +1.0pp $407 |
UW: 25.0% down · 7.5% · 30yr · 1.5% tax · 5.0% vac · 8.0% maint · 8.0% mgmt
Financing live
Cash to close
- Down payment
- $8,750
- Closing costs
- $1,050
- Reserves months
- —
- Total cash needed
- —
Loan-product check · same deal, 3 products live
Conventional
25% down · 7.5% · 30yr
- Down + closing
- —
- Monthly P&I
- —
- Monthly cashflow
- —
- DSCR
- —
- Eligible?
- —
Personal DTI + credit; lowest rate.
DSCR
20% down · 8.5% · 30yr
- Down + closing
- —
- Monthly P&I
- —
- Monthly cashflow
- —
- DSCR
- —
- Eligible?
- —
No personal income docs; deal must DSCR.
Hard money
10% down · 12.0% · 12mo
- Down + closing
- —
- Monthly P&I
- —
- Monthly cashflow
- —
- DSCR
- —
- Eligible?
- —
Short-term bridge; refi at stabilization.
Rent comps 1 comps
| Address | Beds | Baths | Sqft | Rent | $/sqft | DOM | Units | Dist |
|---|---|---|---|---|---|---|---|---|
| 535 W Aspen Ave Fruita, CO | 2.0 | 1.0–2.0 | 838 | $1,802 | $2.15 | 22d | 1 | 1.33mi |
HOA detail
- Monthly dues
- $580 · $6,960/yr
- Likely covers
- water
Listing history 2 events
-
2026-05-17status Pending
-
2026-04-20$35,000 Active
ⓘ Source: listings_history table (triggers on properties + properties_extension) + one-shot
backfill from property_details.listing_events for pre-trigger history.
Climate risk First Street
- Flood 1/10 Low FEMA zone X (unshaded) · 0% chance over 30 yrs
- Wildfire 4/10 Moderate
- Heat 5/10 Major 7 d/yr ≥96°F today · 18 d/yr by 30 yrs out
- Wind 1/10 Low
- Air quality 2/10 Low 1 unhealthy d/yr today · 1 by 30 yrs out
Nearby sold comps map
Loading sold comps map…
Walkable amenities ~0.75 mi
Loading nearby amenities…
Taxation est. · year 1
- Rental income
- $18,950
- − Mortgage interest
- −$1,961
- − Property taxes
- −$525
- − Insurance
- −$175
- − Repairs & maintenance
- −$1,516
- − Management
- −$1,516
- − HOA
- −$6,960
- − Depreciation
- −$1,018
- Taxable income
- $5,280
- Est. tax owed @ 24.0%
- −$1,267
- After-tax cash flow
- $3,841/yr
For passive investors: Depreciation is non-cash, so a rental often shows a tax loss while cash-flowing — sheltering income. Rental losses are passive: they offset passive income freely, and up to $25,000/yr can offset ordinary (W-2) income if you actively participate and your MAGI is under $100k (phasing out to $0 by $150k); unused losses carry forward. On sale, claimed depreciation is recaptured at up to 25%, and gains may owe capital-gains tax (a 1031 exchange can defer both). Figures are a year-1 estimate at your 24.0% rate — not tax advice; consult a CPA.
Schools (NCES district)
- District
- Mesa County Valley School District No. 51
- NCES district ID
- 0804350
- Math proficiency
- 26% ▲ 1.00%
- Reading proficiency
- 38% ▬ 0.00%
- Median HH income
- $50,189
- Composite
- 27.83/100
- National rank
- #6884
- State rank
- #43 of 86 in CO
Livability — Fruita
- Score
- 73/100
- State rank
- #54
- US rank
- #5575
Category grades
Schools grade is shown separately in the Schools card above.
Census & demographics
- Census place
- Fruita, CO
- County
- Mesa County · 143,088 people
- City population
- 16,613
- Metro
- Grand Junction, CO
- Population (ZIP)
- 16,613
- Household income
- $88,458
- Rent vs Own
- Severe rent burden
- 187.0
Population outlook (Mesa County) Hauer SSP2
- Today (2025)
- 153,000 people
- By 2030
- 154,479 · +1.0%
- By 2040
- 155,257 · +1.5%
- By 2050
- 153,384 · +0.3%
- By 2075
- 144,735 · -5.4%
- By 2100
- 123,825 · -19.1%
Race, ethnicity, and origin ACS 2023
- Neighborhood character
- Predominantly White (84%)
- Race & ethnicity
- White 84% Hispanic / Latino 10% Two or more races 9%
- Hispanic origin (detail)
- Mexican 8%
- Common ancestry
- Romanian 3% Iranian 3% Slovak 3%
- Foreign-born
- 1% · Canada
- Languages at home
- 96% English-only · Spanish 4%
Political lean MEDSL · Mesa
- 2024 margin
- Strong R (+24.3) · D 36.6% · R 61.0% · Other 2.4%
- 2008→2024 swing
- +5.2pp toward D · 2008: -29.5pp · 2024: -24.3pp
- All cycles
- 2024: R+24.3 2020: R+28.0 2016: R+36.3 2012: R+32.8 2008: R+29.5
Not yet ingested
- Civics
- —
Market trends
- HPI YoY
- ▼ -266.55%
- Current HPI
- 323.6467
- Rent YoY
- ▲ 4.71%
- Metro
- Grand Junction, CO
- State GDP YoY
- ▲ 1.95%
- F500 in state
- 14
Industry mix (Fortune 500 HQ in CO)
| Industry | F500 HQs | Revenue |
|---|---|---|
| Technology Distribution | 1 | $31B |
|
||
| Food / Agriculture | 1 | $18B |
|
||
| Packaging | 1 | $14B |
|
||
| Healthcare | 1 | $13B |
|
||
| Energy | 1 | $10B |
|
||
| Technology | 1 | $4B |
|
||
Price history
2 events — show timeline
- 2026-05-17 Pending — GJARA
- 2026-04-20 Listed $35,000 GJARA
Property tax history
+3.2%/yrLatest (2021): $27 · +29.4% YoY. Source: county tax records.
Cash-flow waterfall
monthlySold comps — $/sqft
last 12 mo · ≤1 miLoading sold comps…