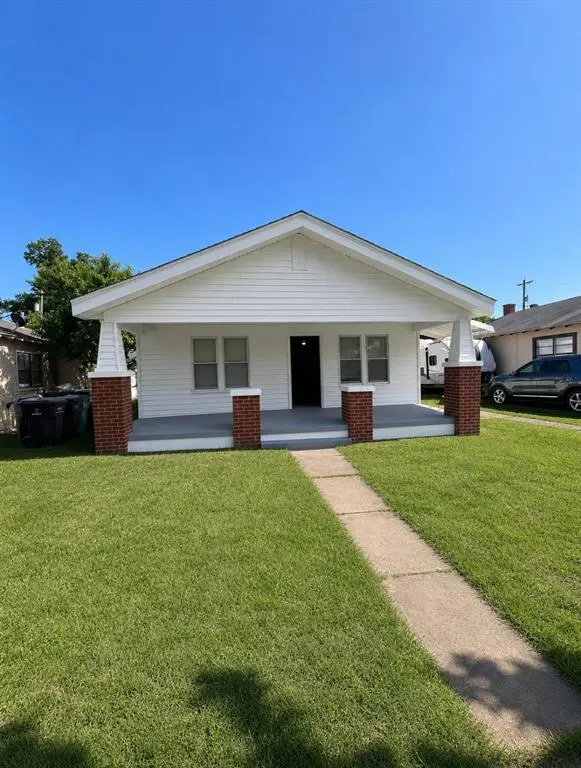
1528 NW 4th St · Oklahoma City, OK
Flood risk 1/10 · Minimal
- FEMA flood zone
- X (unshaded)
- Chance of flooding over 30 yrs
- 0.0%
- Est. flood insurance / yr
- $507 – $1,088
Fire risk 1/10 · Minimal
- Est. fire insurance / yr
- $2,463 – $4,575
Heat risk 6/10 · Moderate
- Hot days now (above 107°F)
- 7 days/yr
- Hot days in 30 yrs
- 19 days/yr
Wind risk 2/10 · Minimal
- Chance of severe wind over 30 yrs
- 4.0%
Air-quality risk 2/10 · Minimal
- Unhealthy air days now
- 1 days/yr
- Unhealthy air days in 30 yrs
- 2 days/yr
Risk factors via First Street. Map © Google.
Why this score? — see what drove the D+ grade
The composite is a weighted blend of 9 inputs, each scored 0–100. Each bar is that input's sub-score; the figure is the points it added to the 100-point composite (weight × sub-score).
- Cash flow +16.2/30.0
- ARV discount +10.8/15.0
- DSCR +5.0/10.0
- Livability +4.0/5.0
- 1% rule +3.2/10.0
- Rent growth +3.2/5.0
- Condition / age +2.5/5.0
- Schools +0.7/10.0
- Appreciation +0.0/10.0
$145,000
🖨 Deal sheet (PDF) 📄 Offer letter ✓ Due diligence
Listing remarks MLS
WELL CARED FOR FAMILY HOME. INTERIOR PAINTED IN 2001. LIVING AREA HAS GAS LOG FP WITH BUILT-IN SHELVES W/GLASS DOORS. CEILING FANS THROUGHOUT. WONDERFUL CARPET. LOTS OF WARMTH. MOVE IN READY.
Key facts
- Covered porch
- Brand-new ac system
- Updated flooring
Tags
Property features AI
Finance
- Other: Living area reported as 1,042 (assessor); Lot size about 0.1377 acre; Property in Bell Vern Second Add; Vacant and unoccupied; No historical designation; Listing status: Active; Directions: Head W from Blackwelder onto NW 4th St; property is about 0.25 mile down the road on the south side
- Financial info: Loan qualification possible; Assumable loan: No
- HOA & community: No mandatory association dues
Exterior
- Parking: 2-car garage
- Security: No storm shelter
- Utilities: No specific utility details provided
- Home design: Single family residence; One story; Residential property; Existing property; Entry level: One
- Construction: Frame construction; Composition roof; Conventional foundation; Built status: Existing
- Exterior features: Interior lot; Covered porch
Interior
- Kitchen: No appliance details provided
- Bedrooms: 2 bedrooms (one-level property)
- Flooring: No flooring details provided
- Bathrooms: 1 full bathroom
- Heating & cooling: No heating or cooling details provided
- Interior features: Covered porch; Mock fireplace
- Laundry & utility: No laundry details provided
Neighborhood map
What this means for you Summary
Snapshot
- This is a 2-bed/1.0-bath single-family listed at $145k.
Deal economics
- At list price, monthly cash flow is $76 ($916/yr) — positive.
- The deal already cash-flows at list — no discount required.
- To meet the 1% rule (rent ≥ 1% of price), the offer needs to be $119k (17.9% below list).
- Recommended offer: $119k (17.9% below list) — sets the bar for 1% rule.
- Cap rate 6.9% vs local median 3.7% in Oklahoma City — top-decile yield for the area; either an underpriced asset or a hidden risk that comps aren't pricing in. Stress-test before assuming the spread holds.
Location & tenants
- Location reads 80/100 on livability (#3 in OK, #1,635 nationally) — a professional / high-income tenant draw. Strengths: amenities A+, commute A+, cost of living A+; Watch: crime F.
- Oklahoma City (urban): math 7% / reading 10% proficiency, ranked #254 of 270 in OK (top 94%) — low school quality limits family demand, transient renter base, plan for 1-2y turnover; 82% free/reduced lunch — lower-income household profile, screen leases tightly.
- Zoned schools: Mark Twain Es (math 8% / reading 2%, grade F, #766 of 845 statewide, top 94%, 277 students, 0% FRL); Taft Ms (math 2% / reading 5%, grade F, #330 of 345 statewide, top 96%, 1,045 students, 0% FRL); Northwest Classen Hs (math 5% / reading 10%, grade F, #420 of 447 statewide, top 95%, 1,702 students, 0% FRL) — zoned schools average 0% FRL vs 82% district-wide (82 pts lower); this property's tenant base skews higher-income than the district average.
- Market conditions: Rents rising (+2.9%/yr); 170 active listings in the ZIP; 40 comparable units currently listed for rent nearby; rentals at typical pace (median 26d on market — plan ~3-4 weeks tenant-placement turnaround); 5,365 units permitted in Oklahoma County in 2024 (569 in 5+ unit buildings).
Forward outlook
- Local home prices are declining (-3.0%/yr); year-one equity from $1k of loan paydown is wiped out by about $4k of value loss. Plan a longer hold.
- Oklahoma County population projected at +41% by 2050 — long-run rental-demand tailwind backs the buy-and-hold thesis.
Negotiation context
- Only 13 days on market — expect competitive offers; lowballing is unlikely to land.
- 4 sale attempts since 25y ago with the ask held roughly flat each time — persistent listings suggest the price (not the market) is what's stuck; bring a comps-based counter.
- Current owner paid $55k; list at $145k implies a 164% gain — meaningful room to come down on a strong offer.
Risks & watch-outs
- Watch-outs: built in 1926 — expect roof / HVAC / electrical / plumbing capex.
- Climate carrying-cost: extreme-heat days projected 7→19/yr by 2055 (HVAC capex compounding) — expect insurance premiums to compound above CPI over the hold.
Questions for the listing agent
- Built in 1926 — when were the roof, HVAC, electrical panel, plumbing, and water heater last replaced?
- Is there a deadline driving the sale (1031 exchange, divorce, estate, relocation)? That informs how much negotiation room exists.
- Schools are F-rated, which usually means shorter tenancies and higher turnover. Who's the typical renter profile here, and what's been the actual vacancy rate?
- Crime grade is F in this area — have there been break-ins, vandalism, or insurance claims at this property in the last 3 years? What carrier currently insures it and at what premium?
- The area grade is low — what's the realistic commute time and amenity access for the typical tenant pool here? Any planned neighborhood developments (good or bad) we should know about?
- What's the average days-on-market for RENTAL listings here right now (not sales)? A rising rental-DOM trend means longer vacancies and softer asking-rent achievability than the comps imply.
- What's the recent tenant-quality profile in this submarket — average credit score on applications, eviction rate, late-payment / NSF rate, and stable-employment percentage? A property-management company in the area should have these aggregated.
- How much new for-sale + rental construction is in the pipeline within 1–3 miles? Heavy new supply typically softens prices + rents 12–24 months out; constrained supply supports both.
Investment metrics
- 1% rule
- 0.82% ✗
- Cap rate
- 6.92%
- Cash-on-cash
- 2.26%
- DSCR
- 1.10
- GRM
- 10.1
CMA / ARV
- ARV (on-the-fly)
- $156,300
- Comps found
- 12
Show comp detail 12 sales within ~0.75 mi
| Address | Dist | Beds/Ba | Sqft | Sold | Price | $/sf | Match |
|---|---|---|---|---|---|---|---|
| 1518 NW 8th St | 0.40mi | 2/1.0 | 985 (-6%) | 10mo | $190,000 | $193 | 64 |
| 1628 NW 8th St | 0.35mi | 3/2.0 (+1) | 1,112 (+7%) | 2mo | $179,000 | $161 | 62 |
| 1845 W Park Pl | 0.59mi | 2/1.0 | 1,006 (-4%) | 10mo | $193,900 | $193 | 58 |
| 1712 NW 7th St | 0.27mi | 3/2.0 (+1) | 1,148 (+10%) | 18mo | $180,000 | $157 | 47 |
| 1305 NW 7th St | 0.49mi | 2/1.0 | 936 (-10%) | 19mo | $80,000 | $85 | 45 |
| 2013 NW 11th St | 0.73mi | 2/1.0 | 900 (-14%) | 0mo | $120,000 | $133 | 43 |
| 1520 NW 10th St | 0.51mi | 3/1.0 (+1) | 1,190 (+14%) | 6mo | $90,000 | $76 | 42 |
| 1421 NW 9th St | 0.51mi | 2/1.0 | 920 (-12%) | 17mo | $95,000 | $103 | 42 |
| 1950 NW 10th St | 0.55mi | 2/1.0 | 900 (-14%) | 22mo | $100,000 | $111 | 33 |
| 2006 NW 11th St | 0.70mi | 2/2.0 | 1,188 (+14%) | 13mo | $239,900 | $202 | 30 |
| 1632 W Park Pl | 0.56mi | 3/1.0 (+1) | 1,197 (+15%) | 18mo | $149,900 | $125 | 29 |
| 1940 NW 11th St | 0.67mi | 2/2.0 | 1,175 (+13%) | 23mo | $176,000 | $150 | 25 |
Match score weights: distance 35% · size 25% · config 20% · recency 20%. Top-matched comps best support the ARV.
Projected returns pro-forma
-3.0% appreciation · 2.93% rent growth · sell at horizon
- IRR
- -12.8%
- Equity multiple
- 0.54×
- Total profit
- $-18,787
- Equity at exit
- $21,620
- IRR
- -4.0%
- Equity multiple
- 0.74×
- Total profit
- $-10,716
- Equity at exit
- $12,537
Cash invested: $40,600 (down + closing). Projections, not guarantees.
Landlord ↔ Tenant lean methodology
- Overall (STATE)
- 83 Strongly Landlord-Friendly
- State Oklahoma
- 83 Strongly Landlord-Friendly · R+20
- County
- — inherits STATE
- City
- — inherits STATE
ZIP-level market 73106
- Home prices YoY
- -34.8%
- Rents YoY
- 2.9%
- Active inventory
- 170
- Price-to-rent
- 10.1×
Monthly cashflow live
- Estimated rent
- $1,191 high interval (Pro) →
- Mortgage (P&I)
- −$760
- Tax from tax record
- −$44 /mo · $526/yr
- Insurance
- −$60
- HOA
- −$0
- Vacancy / Maint / Mgmt
- −$250
- Net cashflow
- $76
Break-even live
Sensitivity live
| Price | -10% $158 | -5% $117 | +0% $76 | +5% $35 | +10% $-6 |
|---|---|---|---|---|---|
| Rent | -10% $-18 | -5% $29 | +0% $76 | +5% $123 | +10% $170 |
| Rate | -1.0pp $149 | -0.5pp $113 | base $76 | +0.5pp $39 | +1.0pp $0 |
UW: 25.0% down · 7.5% · 30yr · 1.5% tax · 5.0% vac · 8.0% maint · 8.0% mgmt
Financing live
Cash to close
- Down payment
- $36,250
- Closing costs
- $4,350
- Reserves months
- —
- Total cash needed
- —
Loan-product check · same deal, 3 products live
Conventional
25% down · 7.5% · 30yr
- Down + closing
- —
- Monthly P&I
- —
- Monthly cashflow
- —
- DSCR
- —
- Eligible?
- —
Personal DTI + credit; lowest rate.
DSCR
20% down · 8.5% · 30yr
- Down + closing
- —
- Monthly P&I
- —
- Monthly cashflow
- —
- DSCR
- —
- Eligible?
- —
No personal income docs; deal must DSCR.
Hard money
10% down · 12.0% · 12mo
- Down + closing
- —
- Monthly P&I
- —
- Monthly cashflow
- —
- DSCR
- —
- Eligible?
- —
Short-term bridge; refi at stabilization.
Rent comps 40 comps
| Address | Beds | Baths | Sqft | Rent | $/sqft | DOM | Units | Dist |
|---|---|---|---|---|---|---|---|---|
| 1608 NW 7th St Oklahoma City, OK | 3.0 | 1.5 | 1028 | $1,400 | $1.36 | 13d | 1 | 0.28mi |
| 907 N Indiana Ave Oklahoma City, OK | 2.0 | 1.0 | 850 | $895 | $1.05 | 25d | 1 | 0.37mi |
| 1222 NW 8th St Oklahoma City, OK | 1.0 | 1.0 | 800 | $600 | $0.75 | 25d | 1 | 0.53mi |
| 1222 NW 8th St Oklahoma City, OK | 1.0 | 1.0 | 800 | $795 | $0.99 | 45d | 1 | 0.53mi |
| 1215 NW 8th St Oklahoma City, OK | 2.0 | 1.0 | 972 | $1,350 | $1.39 | 4d | 1 | 0.54mi |
| 1138 N Blackwelder Ave Unit 3 Oklahoma City, OK | 2.0 | 2.0 | 1250 | $1,599 | $1.28 | 13d | 1 | 0.58mi |
| 1740 NW 11th St Unit A Oklahoma City, OK | 2.0 | 1.0 | 750 | $945 | $1.26 | 16d | 1 | 0.59mi |
| 1945 W Park Pl Oklahoma City, OK | 2.0 | 1.0 | 912 | $1,215 | $1.33 | 5d | 1 | 0.62mi |
| 1119 NW 9th St Unit A Oklahoma City, OK | 1.0 | 1.0 | 750 | $795 | $1.06 | 6d | 1 | 0.66mi |
| 1625 NW 12th St Oklahoma City, OK | 2.0 | 2.0 | 868 | $1,850 | $2.13 | 3d | 1 | 0.71mi |
| 1701 NW 12th St Unit 11 Oklahoma City, OK | 1.0 | 1.0 | 791 | $1,445 | $1.83 | 45d | 1 | 0.71mi |
| 1701 NW 12th St Unit 12 Oklahoma City, OK | 1.0 | 1.0 | 791 | $1,295 | $1.64 | 25d | 1 | 0.71mi |
| 1209 NW 11th St Oklahoma City, OK | 2.0 | 2.5 | 1400 | $1,795 | $1.28 | 19d | 1 | 0.75mi |
| 1209 NW 11th St Oklahoma City, OK | 2.0 | 2.5 | 1400 | $1,795 | $1.28 | 6d | 1 | 0.75mi |
| 835 W Sheridan Ave Oklahoma City, OK | 3.0 | 1.0–2.0 | 992 | $2,271 | $2.29 | 3d | 19 | 0.82mi |
| 700 NW 4th St Oklahoma City, OK | 2.0 | 1.0–2.0 | 743 | $2,094 | $2.82 | 3d | 14 | 0.82mi |
| SW 36th St Moore, OK | 2.0 | 2.0 | 874 | $1,095 | $1.25 | 45d | 1 | 0.85mi |
| 1215 NW 13th St Oklahoma City, OK | 3.0 | 1.0 | 1368 | $2,200 | $1.61 | 45d | 1 | 0.86mi |
| 1744 NW 15th St Oklahoma City, OK | 2.0 | 1.0 | 821 | $1,600 | $1.95 | 45d | 1 | 0.88mi |
| 1411 N Klein Ave Unit 1 Oklahoma City, OK | 2.0 | 1.0 | 820 | $875 | $1.07 | 25d | 1 | 0.89mi |
| 1201 N Francis Ave Oklahoma City, OK | 1.0 | 1.0–1.5 | 769 | $1,388 | $1.80 | 6d | 4 | 0.91mi |
| 1217 N Francis Ave Oklahoma City, OK | 1.0 | 1.0 | 812 | $1,450 | $1.79 | 25d | 1 | 0.93mi |
| 1300 NW 15th St Oklahoma City, OK | 1.0 | 1.0 | 952 | $925 | $0.97 | 45d | 1 | 0.94mi |
| 2004 NW 15th St Oklahoma City, OK | 2.0 | 1.0 | 982 | $975 | $0.99 | 45d | 1 | 0.94mi |
| 2229 NW 12th St Unit 22295 Oklahoma City, OK | 1.0 | 1.0 | 983 | $895 | $0.91 | 16d | 1 | 0.95mi |
| 2231 NW 12th St Unit 22315 Oklahoma City, OK | 1.0 | 1.0 | 983 | $795 | $0.81 | 16d | 1 | 0.95mi |
| 910 NW 13th St Apt 10 Oklahoma City, OK | 1.0 | 1.0 | 800 | $695 | $0.87 | 25d | 1 | 0.98mi |
| 1625 NW 16th St Unit 2 Oklahoma City, OK | 2.0 | 2.0 | 1136 | $1,850 | $1.63 | 45d | 1 | 0.98mi |
| 900 NW 13th St Unit 204 Oklahoma City, OK | 1.0 | 1.0 | 900 | $795 | $0.88 | 45d | 1 | 0.99mi |
| 900 NW 13th St Unit 203 Oklahoma City, OK | 2.0 | 2.0 | 900 | $995 | $1.11 | 25d | 1 | 0.99mi |
| 900 NW 13th St Unit 200 Oklahoma City, OK | 1.0 | 1.0 | 895 | $895 | $1.00 | 25d | 1 | 0.99mi |
| 2319 NW 12th St Unit A Oklahoma City, OK | 2.0 | 1.0 | 874 | $925 | $1.06 | 45d | 1 | 1.02mi |
| 301 N Walker Ave Oklahoma City, OK | 1.0–2.0 | 1.0–2.0 | 1003 | $2,655 | $2.65 | 3d | 18 | 1.02mi |
| 1628 NW 17th St Unit 1 Oklahoma City, OK | 2.0 | 1.0 | 1125 | $1,450 | $1.29 | 45d | 1 | 1.02mi |
| 2325 NW 12th St Unit D Oklahoma City, OK | 2.0 | 1.0 | 836 | $899 | $1.08 | 45d | 1 | 1.03mi |
| 1630 NW 17th St Unit 2 Oklahoma City, OK | 2.0 | 1.0 | 1125 | $1,400 | $1.24 | 45d | 1 | 1.03mi |
| 2325 NW 12th St Unit C Oklahoma City, OK | 2.0 | 1.0 | 736 | $899 | $1.22 | 19d | 1 | 1.03mi |
| 901 NW 13th St Unit 205 Oklahoma City, OK | 1.0 | 1.0 | 900 | $831 | $0.92 | 25d | 1 | 1.03mi |
| 901 NW 13th St Apt 103 Oklahoma City, OK | 1.0 | 1.0 | 850 | $795 | $0.94 | 45d | 1 | 1.03mi |
| 901 NW 13th St Unit 207 Oklahoma City, OK | 1.0 | 1.0 | 900 | $855 | $0.95 | 25d | 1 | 1.03mi |
Listing history 8 events
-
2026-06-21days on market $145,000 Active 13 DOM
-
2026-06-18days on market $145,000 Active 10 DOM
-
2026-06-17days on market $145,000 Active 9 DOM
-
2026-06-16days on market $145,000 Active 8 DOM
-
2026-06-15days on market $145,000 Active 7 DOM
-
2026-06-13days on market $145,000 Active 5 DOM
-
2026-06-09remarks 695-char remark
-
2026-06-09$145,000 Active 1 DOM
ⓘ Source: listings_history table (triggers on properties + properties_extension) + one-shot
backfill from property_details.listing_events for pre-trigger history.
Tax reassessment forecast OK · Resets to sale price
- Current annual tax
- $526 · $44/mo
- Projected year-2 tax
- $1,305 · $109/mo
- Expected delta
- +$778/yr (+$65/mo · 147.9%)
ⓘ Screening estimate from a state-policy table — verify with the county assessor before closing.
Climate risk First Street
- Flood 1/10 Low FEMA zone X (unshaded) · 0% chance over 30 yrs
- Wildfire 1/10 Low
- Heat 6/10 Major 7 d/yr ≥107°F today · 19 d/yr by 30 yrs out
- Wind 2/10 Low 4% chance of damaging wind over 30 yrs
- Air quality 2/10 Low 1 unhealthy d/yr today · 2 by 30 yrs out
Nearby sold comps map
Loading sold comps map…
Walkable amenities ~0.75 mi
Loading nearby amenities…
Taxation est. · year 1
- Rental income
- $14,293
- − Mortgage interest
- −$8,122
- − Property taxes
- −$526
- − Insurance
- −$725
- − Repairs & maintenance
- −$1,143
- − Management
- −$1,143
- − Depreciation
- −$4,218
- Taxable loss
- −$1,585
- Est. tax savings @ 24.0%
- +$381
- After-tax cash flow
- $1,296/yr
For passive investors: Depreciation is non-cash, so a rental often shows a tax loss while cash-flowing — sheltering income. Rental losses are passive: they offset passive income freely, and up to $25,000/yr can offset ordinary (W-2) income if you actively participate and your MAGI is under $100k (phasing out to $0 by $150k); unused losses carry forward. On sale, claimed depreciation is recaptured at up to 25%, and gains may owe capital-gains tax (a 1031 exchange can defer both). Figures are a year-1 estimate at your 24.0% rate — not tax advice; consult a CPA.
Schools (NCES district)
- District
- Oklahoma City
- NCES district ID
- 4022770
- Math proficiency
- 7% ▼ -5.00%
- Reading proficiency
- 10% ▼ -6.00%
- Median HH income
- $35,606
- Composite
- 7.0/100
- National rank
- #9970
- State rank
- #254 of 270 in OK
Livability — Oklahoma City
- Score
- 80/100
- State rank
- #3
- US rank
- #1635
Category grades
Schools grade is shown separately in the Schools card above.
Census & demographics
- Census place
- Oklahoma City, OK
- County
- Oklahoma County · 771,644 people
- City population
- 498,656
- Metro
- Oklahoma City, OK
- Population (ZIP)
- 12,140
- Household income
- $60,205
- Rent vs Own
- Severe rent burden
- 892.0
Population outlook (Oklahoma County) Hauer SSP2
- Today (2025)
- 911,875 people
- By 2030
- 982,413 · +7.7%
- By 2040
- 1,130,468 · +24.0%
- By 2050
- 1,288,422 · +41.3%
- By 2075
- 1,711,482 · +87.7%
- By 2100
- 2,088,448 · +129.0%
Race, ethnicity, and origin ACS 2023
- Neighborhood character
- Diverse neighborhood (Simpson 0.67)
- Race & ethnicity
- White 50% Hispanic / Latino 27% Two or more races 15% Black 7% Asian 6% Native American 3%
- Hispanic origin (detail)
- Mexican 20%
- Common ancestry
- Scottish 3% Lithuanian 2% Slovak 2%
- Foreign-born
- 17% · Canada, Vietnam, Jamaica
- Languages at home
- 71% English-only · Spanish 21% German/W. Germanic 3% Vietnamese 2%
Political lean MEDSL · Oklahoma
- 2024 margin
- Toss-up / Even · D 48.0% · R 49.7% · Other 2.3%
- 2008→2024 swing
- +15.1pp toward D · 2008: -16.8pp · 2024: -1.7pp
- All cycles
- 2024: R+1.7 2020: R+1.1 2016: R+10.5 2012: R+16.7 2008: R+16.8
Not yet ingested
- Civics
- —
Market trends
- HPI YoY
- ▼ -237.74%
- Current HPI
- 445.1464
- Rent YoY
- ▲ 2.93%
- Metro
- Oklahoma City, OK
- State GDP YoY
- ▲ 1.55%
- F500 in state
- 6
Industry mix (Fortune 500 HQ in OK)
| Industry | F500 HQs | Revenue |
|---|---|---|
| Energy | 3 | $48B |
|
||
Price history
+504.2% since first listed11 events — show timeline
- 2026-06-08 Listed $145,000 MLSOK
- 2026-05-17 Relisted — MLSOK
- 2026-03-20 Sold (Public Records) $55,000 Public Records
- 2026-03-05 Price Changed $99,990 MLSOK
- 2026-02-07 Price Changed $104,990 MLSOK
- 2026-02-03 Price Changed $109,990 MLSOK
- 2026-01-28 Price Changed $114,990 MLSOK
- 2026-01-22 Listed $119,990 MLSOK
- 2001-05-22 Sold (Public Records) $24,000 Public Records
- 2001-05-21 Sold (MLS) $24,000 MLSOK
- 2001-04-09 Listed $24,000 MLSOK
Property tax history
+7.0%/yrLatest (2025): $526 · +4.2% YoY. Source: county tax records.
Cash-flow waterfall
monthlySold comps — $/sqft
last 12 mo · ≤1 miLoading sold comps…