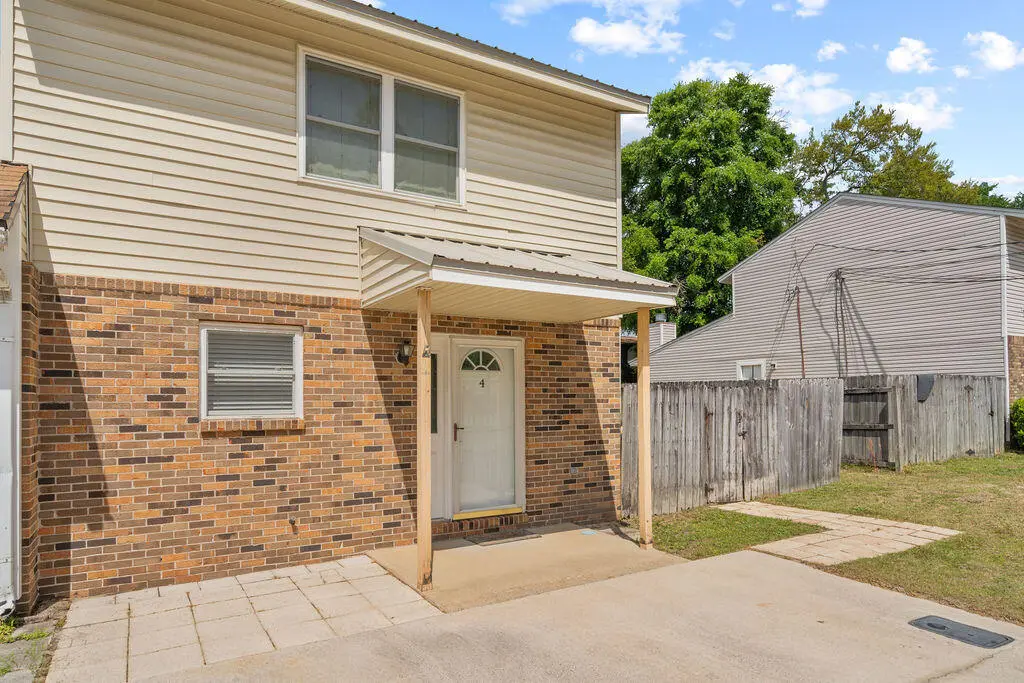
940 Central Ave #4 · Wright, FL
Flood risk 1/10 · Minimal
- FEMA flood zone
- X (unshaded)
- Chance of flooding over 30 yrs
- 0.0%
- Est. flood insurance / yr
- $507 – $1,088
Fire risk 4/10 · Minor
- Est. fire insurance / yr
- $947 – $1,759
Heat risk 10/10 · Severe
- Hot days now (above 104°F)
- 7 days/yr
- Hot days in 30 yrs
- 23 days/yr
Wind risk 9/10 · Severe
- Chance of severe wind over 30 yrs
- 99.0%
Air-quality risk 2/10 · Minimal
- Unhealthy air days now
- 1 days/yr
- Unhealthy air days in 30 yrs
- 2 days/yr
Risk factors via First Street. Map © Google.
Why this score? — see what drove the C- grade
The composite is a weighted blend of 9 inputs, each scored 0–100. Each bar is that input's sub-score; the figure is the points it added to the 100-point composite (weight × sub-score).
- Cash flow +20.2/30.0
- ARV discount +10.1/15.0
- DSCR +6.4/10.0
- Schools +5.2/10.0
- 1% rule +4.0/10.0
- Livability +4.0/5.0
- Rent growth +2.5/5.0
- Condition / age +2.5/5.0
- Appreciation +0.0/10.0
$195,000
🖨 Deal sheet (PDF) 📄 Offer letter ✓ Due diligence
Listing remarks
MOTIVATED SELLER!!! $15k price reduction!! Welcome to this lovingly maintained 2-bedroom, 1.5-bath townhouse offering 1,320 square feet of comfortable, well-proportioned living space in one of Fort Walton Beach's most convenient locations -- tucked right between Eglin Air Force Base and Hurlburt Field. Whether you're active duty, a veteran, a DoD civilian, or simply someone who values an easy commute and a great community, this home is worth a serious look. Inside, the main level flows from a welcoming living area into a functional kitchen, laundry room and a convenient half bath rounding out the first floor. Upstairs, two well-sized bedrooms share a full bath -- a layout that works beaut
Key facts
- Durable metal roof
- Great community
- Fully fenced yard
Tags
Property features AI
Finance
- HOA & community: Subdivision: BELL-BROOK ESTATES
Exterior
- Utilities: Electric service; Public water; Public sewer
- Home design: Townhome; 2 stories; Built in 1983
- Construction: Brick and vinyl siding exterior; Metal roof
- Exterior features: Private yard; Privacy fencing; Open patio; Cleared, level lot; Zoned for single-family residential
Interior
- Kitchen: Range hood
- Bedrooms: 2 bedrooms; Master bedroom located on the second floor; Second bedroom located on the second floor
- Flooring: Laminate; Carpet
- Bathrooms: 2 bathrooms (1 full, 1 half)
- Heating & cooling: Central heating; Central air conditioning
- Interior features: Unfurnished; Washer/dryer hookup
- Laundry & utility: Washer/dryer hookup; Electric water heater
Neighborhood map
What this means for you Summary
Snapshot
- This is a 2-bed/2.0-bath townhouse listed at $195k.
Deal economics
- At list price, monthly cash flow is $247 ($3k/yr) — positive.
- The deal already cash-flows at list — no discount required.
- To meet the 1% rule (rent ≥ 1% of price), the offer needs to be $175k (10.1% below list).
- Recommended offer: $175k (10.1% below list) — sets the bar for 1% rule.
- Cap rate 7.8% vs local median 4.2% in Wright — top-decile yield for the area; either an underpriced asset or a hidden risk that comps aren't pricing in. Stress-test before assuming the spread holds.
Location & tenants
- Location reads 80/100 on livability (#117 in FL, #1,790 nationally) — a professional / high-income tenant draw. Strengths: commute A+, cost of living A+, housing A+; Watch: amenities F.
- Okaloosa (other): math 60% / reading 60% proficiency, ranked #12 of 73 in FL (top 16%) — acceptable for families but not a draw, mixed tenant base, ~2y average lease.
- Zoned schools: Wright Elementary School (math 48% / reading 49%, grade D, #1,152 of 2,144 statewide, top 55%, 635 students, 73% FRL); Choctawhatchee Senior High School (math 42% / reading 50%, grade D-, #220 of 667 statewide, top 33%, 1,677 students, 52% FRL) — zoned schools average 62% FRL vs 36% district-wide (26 pts higher); higher-poverty schools than district average — tighter screening recommended.
- Zoned-school proficiency averages 47% at this address vs 60% district-wide (-13 pts) — the specific schools serving this property underperform the Okaloosa average; the district grade overstates school quality for this exact location.
- Market conditions: Rents soft (-0.1%/yr); 232 active listings in the ZIP; 40 comparable units currently listed for rent nearby; rentals at typical pace (median 23d on market — plan ~3-4 weeks tenant-placement turnaround); 40% of comp listings sitting > 30 days — soft ceiling on asking rent; 1,268 units permitted in Okaloosa County in 2024 (175 in 5+ unit buildings).
Forward outlook
- Local home prices are declining (-3.0%/yr); year-one equity from $1k of loan paydown is wiped out by about $6k of value loss. Plan a longer hold.
- Okaloosa County population projected at +37% by 2050 — long-run rental-demand tailwind backs the buy-and-hold thesis.
Negotiation context
- It's been on market 56 days — a 3% lower offer ($189k) is reasonable based on typical stale-listing flexibility.
- 2 sale attempts since 30y ago; this cycle's ask has dropped $15k (7%) from the opening price — seller is motivated, your offer sets the floor, not the list.
- Current owner paid $55k; list at $195k implies a 255% gain — meaningful room to come down on a strong offer.
Risks & watch-outs
- Climate carrying-cost: severe wind risk, 99% chance of damaging wind over 30y; extreme-heat days projected 7→23/yr by 2055 (HVAC capex compounding) — expect insurance premiums to compound above CPI over the hold.
Questions for the listing agent
- It's been on market 56 days. Have you received any prior offers? Is the seller open to a 10% concession, seller financing, or rate buy-down credit?
- Is there a deadline driving the sale (1031 exchange, divorce, estate, relocation)? That informs how much negotiation room exists.
- Schools are D-rated, which usually means shorter tenancies and higher turnover. Who's the typical renter profile here, and what's been the actual vacancy rate?
- What's the average days-on-market for RENTAL listings here right now (not sales)? A rising rental-DOM trend means longer vacancies and softer asking-rent achievability than the comps imply.
- What's the recent tenant-quality profile in this submarket — average credit score on applications, eviction rate, late-payment / NSF rate, and stable-employment percentage? A property-management company in the area should have these aggregated.
- How much new for-sale + rental construction is in the pipeline within 1–3 miles? Heavy new supply typically softens prices + rents 12–24 months out; constrained supply supports both.
Investment metrics
- 1% rule
- 0.90% ✗
- Cap rate
- 7.81%
- Cash-on-cash
- 5.43%
- DSCR
- 1.24
- GRM
- 9.3
CMA / ARV
- ARV (median comp)
- $206,911
- List price
- $195,000
- Delta
- -5.76%
- Verdict
- FAIR
- Comps
- 20 within 1.0 mi
Show comp detail 12 sales within ~0.75 mi
| Address | Dist | Beds/Ba | Sqft | Sold | Price | $/sf | Match |
|---|---|---|---|---|---|---|---|
| 1100 Crosswinds Lndg Unit 19 | 0.51mi | 2/2.0 | 1,330 (+1%) | 4mo | $290,000 | $218 | 71 |
| 901 Tokalon Ct #3 | 0.41mi | 2/2.5 | 1,344 (+2%) | 13mo | $228,000 | $170 | 66 |
| 208 Cloverdale Blvd Unit 8 | 0.61mi | 2/1.5 | 1,280 (-3%) | 1mo | $230,000 | $180 | 64 |
| 947 Ashley Ln Unit D | 0.11mi | 2/2.5 | 1,483 (+12%) | 10mo | $140,000 | $94 | 64 |
| 400 Rhonda Kay Court St #4 | 0.35mi | 3/1.5 (+1) | 1,256 (-5%) | 8mo | $236,900 | $189 | 62 |
| 214 Cloverdale Blvd Unit A | 0.68mi | 2/1.5 | 1,330 (+1%) | 7mo | $235,000 | $177 | 59 |
| 518 NW Parkview Rd Unit A | 0.33mi | 3/2.0 (+1) | 1,450 (+10%) | 6mo | $260,000 | $179 | 58 |
| 524 NW Parkview Rd Unit A | 0.35mi | 2/2.5 | 1,231 (-7%) | 16mo | $260,900 | $212 | 56 |
| 309 Olympia Ct | 0.37mi | 2/1.5 | 1,197 (-9%) | 12mo | $220,000 | $184 | 55 |
| 1942 Woodcrest Rdg #2 | 0.48mi | 2/2.0 | 1,516 (+15%) | 2mo | $330,000 | $218 | 51 |
| 518 NW Parkview Rd Unit B | 0.33mi | 3/2.0 (+1) | 1,450 (+10%) | 15mo | $295,000 | $203 | 51 |
| 2112 Pomegranate Ct | 0.64mi | 3/2.5 (+1) | 1,449 (+10%) | 5mo | $285,000 | $197 | 42 |
Match score weights: distance 35% · size 25% · config 20% · recency 20%. Top-matched comps best support the ARV.
Projected returns pro-forma
-3.0% appreciation · 0.0% rent growth · sell at horizon
- IRR
- -10.9%
- Equity multiple
- 0.61×
- Total profit
- $-21,109
- Equity at exit
- $29,075
- IRR
- -5.9%
- Equity multiple
- 0.66×
- Total profit
- $-18,395
- Equity at exit
- $16,860
Cash invested: $54,600 (down + closing). Projections, not guarantees.
Landlord ↔ Tenant lean methodology
- Overall (STATE)
- 87 Strongly Landlord-Friendly
- State Florida
- 87 Strongly Landlord-Friendly · R+3
- County
- — inherits STATE
- City
- — inherits STATE
ZIP-level market 32547
- Home prices YoY
- -29.3%
- Rents YoY
- -0.1%
- Active inventory
- 232
- Price-to-rent
- 9.3×
Monthly cashflow live
- Estimated rent
- $1,752 high interval (Pro) →
- Mortgage (P&I)
- −$1,023
- Tax from tax record
- −$34 /mo · $404/yr
- Insurance
- −$81
- HOA
- −$0
- Lot rent
- −$0
- Vacancy / Maint / Mgmt
- −$368
- Net cashflow
- $247
Break-even live
Sensitivity live
| Price | -10% $357 | -5% $302 | +0% $247 | +5% $-31 | +10% $-98 |
|---|---|---|---|---|---|
| Rent | -10% $108 | -5% $178 | +0% $247 | +5% $316 | +10% $385 |
| Rate | -1.0pp $345 | -0.5pp $297 | base $247 | +0.5pp $196 | +1.0pp $145 |
UW: 25.0% down · 7.5% · 30yr · 1.5% tax · 5.0% vac · 8.0% maint · 8.0% mgmt
Financing live
Cash to close
- Down payment
- $48,750
- Closing costs
- $5,850
- Reserves months
- —
- Total cash needed
- —
Loan-product check · same deal, 3 products live
Conventional
25% down · 7.5% · 30yr
- Down + closing
- —
- Monthly P&I
- —
- Monthly cashflow
- —
- DSCR
- —
- Eligible?
- —
Personal DTI + credit; lowest rate.
DSCR
20% down · 8.5% · 30yr
- Down + closing
- —
- Monthly P&I
- —
- Monthly cashflow
- —
- DSCR
- —
- Eligible?
- —
No personal income docs; deal must DSCR.
Hard money
10% down · 12.0% · 12mo
- Down + closing
- —
- Monthly P&I
- —
- Monthly cashflow
- —
- DSCR
- —
- Eligible?
- —
Short-term bridge; refi at stabilization.
Rent comps 40 comps
| Address | Beds | Baths | Sqft | Rent | $/sqft | DOM | Units | Dist |
|---|---|---|---|---|---|---|---|---|
| 940 Central Ave #16 Fort Walton Beach, FL | 3.0 | 2.0 | 1320 | $1,800 | $1.36 | 16d | 1 | 0.02mi |
| 508 Parkview Rd NW Fort Walton Beach, FL | 2.0 | 2.0 | 1250 | $1,575 | $1.26 | 46d | 1 | 0.26mi |
| 422 Bear Rd Unit A Fort Walton Beach, FL | 2.0 | 1.5 | 1175 | $1,600 | $1.36 | 16d | 1 | 0.32mi |
| 400 Rhonda Kay Ct #66 Fort Walton Beach, FL | 3.0 | 1.5 | 1256 | $1,650 | $1.31 | 46d | 1 | 0.37mi |
| 104 Hydac Rd Unit B Fort Walton Beach, FL | 2.0 | 1.5 | 1144 | $1,650 | $1.44 | 23d | 1 | 0.50mi |
| 2100 Pomegranate Ct Fort Walton Beach, FL | 3.0 | 2.5 | 1743 | $2,025 | $1.16 | 23d | 1 | 0.62mi |
| 833 Jonleen Dr Fort Walton Beach, FL | 3.0 | 2.5 | 1500 | $1,895 | $1.26 | 46d | 1 | 0.62mi |
| 831 Jonleen Dr Fort Walton Beach, FL | 3.0 | 2.5 | 1500 | $1,895 | $1.26 | 46d | 1 | 0.62mi |
| 829 Jonleen Dr Fort Walton Beach, FL | 3.0 | 2.5 | 1500 | $1,995 | $1.33 | 46d | 1 | 0.63mi |
| 800 Denton Blvd NW Fort Walton Beach, FL | 2.0 | 1.0 | 1000 | $1,600 | $1.60 | 16d | 1 | 0.66mi |
| 790 Navy St Fort Walton Beach, FL | 2.0 | 1.0 | 900 | $1,300 | $1.44 | 16d | 1 | 0.67mi |
| 216 Cloverdale Blvd Unit C Fort Walton Beach, FL | 2.0 | 1.5 | 1224 | $1,700 | $1.39 | 46d | 1 | 0.69mi |
| 309 Union St Fort Walton Beach, FL | 3.0 | 2.0 | 1602 | $2,100 | $1.31 | 16d | 1 | 0.73mi |
| 517 Scott Ln Fort Walton Beach, FL | 3.0 | 2.0 | 980 | $1,595 | $1.63 | 46d | 1 | 0.74mi |
| 1504 E Ponderosa Rd Fort Walton Beach, FL | 3.0 | 2.0 | 1000 | $1,650 | $1.65 | 23d | 1 | 0.76mi |
| 585 Bob Sikes Blvd Fort Walton Beach, FL | 2.0 | 1.0 | 1190 | $1,550 | $1.30 | 46d | 1 | 0.80mi |
| 589 Bob Sikes Blvd Fort Walton Beach, FL | 2.0 | 1.0 | 1190 | $1,500 | $1.26 | 46d | 1 | 0.80mi |
| 2415 Suwanee Ln Fort Walton Beach, FL | 2.0 | 1.5 | 1250 | $1,700 | $1.36 | 46d | 1 | 0.85mi |
| 1329 White Blossom Ln Fort Walton Beach, FL | 3.0 | 2.5 | 1735 | $1,900 | $1.10 | 16d | 1 | 0.85mi |
| 1839 Sod Dr Fort Walton Beach, FL | 3.0 | 2.0 | 1425 | $1,925 | $1.35 | 23d | 1 | 0.86mi |
| 2400 Suwanee Ln Fort Walton Beach, FL | 2.0 | 1.5 | 1242 | $1,700 | $1.37 | 23d | 1 | 0.87mi |
| 2404 Suwanee Ln Fort Walton Beach, FL | 2.0 | 1.5 | 1242 | $1,700 | $1.37 | 23d | 1 | 0.87mi |
| 713 Trowbridge Ave Fort Walton Beach, FL | 3.0 | 2.0 | 1550 | $2,350 | $1.52 | 16d | 1 | 0.88mi |
| 696 Tyner St #41 Fort Walton Beach, FL | 2.0 | 1.5 | 960 | $1,550 | $1.61 | 16d | 1 | 0.88mi |
| 615 Bob Sikes Blvd #7 Fort Walton Beach, FL | 2.0 | 1.0 | 1190 | $1,500 | $1.26 | 16d | 1 | 0.89mi |
| 615 Bob Sikes Blvd #5 Fort Walton Beach, FL | 2.0 | 1.5 | 1190 | $1,450 | $1.22 | 46d | 1 | 0.89mi |
| 2800 Bradford Pl NW Fort Walton Beach, FL | 2.0 | 2.0 | 850 | $1,395 | $1.64 | 16d | 5 | 0.90mi |
| 2809 Bradford Pl NW Unit 4 Fort Walton Beach, FL | 2.0 | 2.0 | 928 | $1,250 | $1.35 | 46d | 1 | 0.91mi |
| 1128 Sweetbriar Station Fort Walton Beach, FL | 3.0 | 2.0 | 1150 | $1,850 | $1.61 | 23d | 1 | 0.91mi |
| 2809 Bradford Pl NW Unit 3 Fort Walton Beach, FL | 2.0 | 2.0 | 928 | $1,300 | $1.40 | 16d | 1 | 0.91mi |
| 1004 McLaren Cir Fort Walton Beach, FL | 3.0 | 2.5 | 1537 | $2,500 | $1.63 | 46d | 1 | 0.93mi |
| 2813 Bradford Pl NW Unit 2 Fort Walton Beach, FL | 2.0 | 2.0 | 928 | $1,300 | $1.40 | 16d | 1 | 0.93mi |
| 2812 Bradford Pl NW Unit 4 Fort Walton Beach, FL | 2.0 | 2.0 | 928 | $1,250 | $1.35 | 23d | 1 | 0.94mi |
| 2814 Bradford Pl NW Unit 3 Fort Walton Beach, FL | 2.0 | 2.0 | 928 | $1,250 | $1.35 | 23d | 1 | 0.95mi |
| 905 Piedmont Pl Fort Walton Beach, FL | 3.0 | 2.0 | 1303 | $1,695 | $1.30 | 46d | 1 | 0.96mi |
| 964 Southern Oaks Ct Fort Walton Beach, FL | 3.0 | 2.0 | 1315 | $2,000 | $1.52 | 46d | 1 | 0.99mi |
| 1008 Pineview Blvd Unit D Fort Walton Beach, FL | 2.0 | 2.0 | 1200 | $1,650 | $1.38 | 23d | 1 | 1.00mi |
| 500 Liberty Ln NW Fort Walton Beach, FL | 1.0–3.0 | 1.0–2.0 | 967 | $2,340 | $2.42 | 16d | 14 | 1.01mi |
| 913 Landry St #5 Fort Walton Beach, FL | 2.0 | 1.0 | 884 | $1,200 | $1.36 | 23d | 1 | 1.02mi |
| 977 Scenic Oak Ln Fort Walton Beach, FL | 2.0 | 2.5 | 1248 | $1,650 | $1.32 | 46d | 1 | 1.04mi |
Listing history 20 events
-
2026-06-21days on market $195,000 Active 56 DOM
-
2026-06-18days on market $195,000 Active 53 DOM
-
2026-06-17days on market $195,000 Active 52 DOM
-
2026-06-16days on market $195,000 Active 51 DOM
-
2026-06-15days on market $195,000 Active 50 DOM
-
2026-06-14days on market $195,000 Active 48 DOM
-
2026-06-13days on market $195,000 Active 47 DOM
-
2026-06-10days on market $195,000 Active 45 DOM
-
2026-06-09days on market $195,000 Active 44 DOM
-
2026-06-08days on market $195,000 Active 43 DOM
-
2026-06-07days on market $195,000 Active 42 DOM
-
2026-06-05days on market $195,000 Active 39 DOM
-
2026-06-02days on market $195,000 Active 37 DOM
-
2026-06-01days on market $195,000 Active 36 DOM
-
2026-05-31days on market $195,000 Active 35 DOM
-
2026-05-30days on market $195,000 Active 34 DOM
-
2026-04-26$210,000 Active 1664-char remark
-
1996-05-31soldstatus $55,000
-
1996-03-27$55,900
-
1989-05-01soldstatus $18,000
ⓘ Source: listings_history table (triggers on properties + properties_extension) + one-shot
backfill from property_details.listing_events for pre-trigger history.
Tax reassessment forecast FL · Resets to sale price
- Current annual tax
- $404 · $34/mo
- Projected year-2 tax
- $1,618 · $135/mo
- Expected delta
- +$1,214/yr (+$101/mo · 300.4%)
ⓘ Screening estimate from a state-policy table — verify with the county assessor before closing.
Climate risk First Street
- Flood 1/10 Low FEMA zone X (unshaded) · 0% chance over 30 yrs
- Wildfire 4/10 Moderate
- Heat 10/10 Extreme 7 d/yr ≥104°F today · 23 d/yr by 30 yrs out
- Wind 9/10 Extreme 99% chance of damaging wind over 30 yrs
- Air quality 2/10 Low 1 unhealthy d/yr today · 2 by 30 yrs out
Nearby sold comps map
Loading sold comps map…
Walkable amenities ~0.75 mi
Loading nearby amenities…
Taxation est. · year 1
- Rental income
- $21,030
- − Mortgage interest
- −$10,923
- − Property taxes
- −$404
- − Insurance
- −$975
- − Repairs & maintenance
- −$1,682
- − Management
- −$1,682
- − Depreciation
- −$5,673
- Taxable loss
- −$310
- Est. tax savings @ 24.0%
- +$74
- After-tax cash flow
- $3,038/yr
For passive investors: Depreciation is non-cash, so a rental often shows a tax loss while cash-flowing — sheltering income. Rental losses are passive: they offset passive income freely, and up to $25,000/yr can offset ordinary (W-2) income if you actively participate and your MAGI is under $100k (phasing out to $0 by $150k); unused losses carry forward. On sale, claimed depreciation is recaptured at up to 25%, and gains may owe capital-gains tax (a 1031 exchange can defer both). Figures are a year-1 estimate at your 24.0% rate — not tax advice; consult a CPA.
Schools (NCES district)
- District
- Okaloosa
- NCES district ID
- 1201380
- Math proficiency
- 60% ▼ -12.00%
- Reading proficiency
- 60% ▼ -4.00%
- Median HH income
- $55,601
- Composite
- 51.62/100
- National rank
- #1705
- State rank
- #12 of 73 in FL
Livability — Wright
- Score
- 80/100
- State rank
- #117
- US rank
- #1790
Category grades
Schools grade is shown separately in the Schools card above.
Census & demographics
- Census place
- Wright, FL
- County
- Okaloosa County · 194,352 people
- City population
- 35,522
- Metro
- Crestview-Fort Walton Beach-Destin, FL
- Population (ZIP)
- 35,527
- Household income
- $70,711
- Rent vs Own
- Severe rent burden
- 1203.0
Population outlook (Okaloosa County) Hauer SSP2
- Today (2025)
- 235,133 people
- By 2030
- 253,483 · +7.8%
- By 2040
- 289,537 · +23.1%
- By 2050
- 322,954 · +37.3%
- By 2075
- 399,624 · +70.0%
- By 2100
- 425,311 · +80.9%
Race, ethnicity, and origin ACS 2023
- Neighborhood character
- Diverse neighborhood (Simpson 0.60)
- Race & ethnicity
- White 59% Hispanic / Latino 19% Two or more races 14% Black 11% Asian 3%
- Hispanic origin (detail)
- Mexican 5% Puerto Rican 3% Dominican 1%
- Common ancestry
- Slovak 2% Lithuanian 2% Scotch-Irish 2%
- Foreign-born
- 15% · Canada, Vietnam, Jamaica
- Languages at home
- 81% English-only · Spanish 14% Other Indo-European 1% Vietnamese 1%
Political lean MEDSL · Okaloosa
- 2024 margin
- Solid R (+42.4) · D 28.2% · R 70.7% · Other 1.1%
- 2008→2024 swing
- +2.5pp toward D · 2008: -44.9pp · 2024: -42.4pp
- All cycles
- 2024: R+42.4 2020: R+39.1 2016: R+47.8 2012: R+49.4 2008: R+44.9
Not yet ingested
- Civics
- —
Market trends
- HPI YoY
- ▼ -111.28%
- Current HPI
- 268.6497
- Rent YoY
- ▼ -0.13%
- Metro
- Crestview-Fort Walton Beach-Destin, FL
- State GDP YoY
- ▲ 3.28%
- F500 in state
- 36
Industry mix (Fortune 500 HQ in FL)
| Industry | F500 HQs | Revenue |
|---|---|---|
| Industrial Technology | 2 | $29B |
|
||
| Insurance | 2 | $17B |
|
||
| Retail | 1 | $60B |
|
||
| Technology Distribution | 1 | $58B |
|
||
| Homebuilding | 1 | $35B |
|
||
| Technology Manufacturing | 1 | $35B |
|
||
Price history
+983.3% since first listed5 events — show timeline
- 2026-05-29 Price Changed $195,000 ECAR
- 2026-04-26 Listed $210,000 ECAR
- 1996-05-31 Sold (Public Records) $55,000 Public Records
- 1996-03-27 Listed $55,900 ECAR
- 1989-05-01 Sold (Public Records) $18,000 Public Records
Property tax history
+0.7%/yrLatest (2025): $404 · +2.5% YoY. Source: county tax records.
Cash-flow waterfall
monthlySold comps — $/sqft
last 12 mo · ≤1 miLoading sold comps…