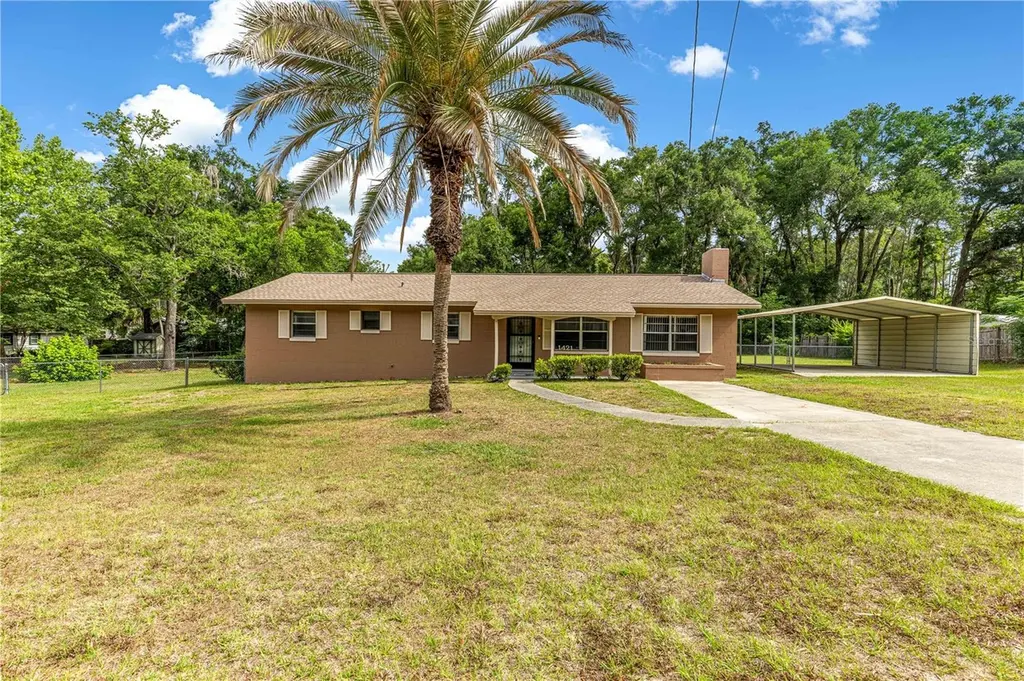
1421 NE 23rd St · Ocala, FL
Flood risk 6/10 · Moderate
- FEMA flood zone
- X (shaded)
- Chance of flooding over 30 yrs
- 0.7%
- Est. flood insurance / yr
- $507 – $1,088
Fire risk 2/10 · Minimal
- Est. fire insurance / yr
- $947 – $1,759
Heat risk 8/10 · Major
- Hot days now (above 108°F)
- 7 days/yr
- Hot days in 30 yrs
- 21 days/yr
Wind risk 9/10 · Severe
- Chance of severe wind over 30 yrs
- 99.0%
Air-quality risk 4/10 · Minor
- Unhealthy air days now
- 5 days/yr
- Unhealthy air days in 30 yrs
- 5 days/yr
Risk factors via First Street. Map © Google.
Why this score? — see what drove the D grade
The composite is a weighted blend of 9 inputs, each scored 0–100. Each bar is that input's sub-score; the figure is the points it added to the 100-point composite (weight × sub-score).
- Cash flow +14.6/30.0
- ARV discount +10.4/15.0
- DSCR +4.5/10.0
- Schools +3.6/10.0
- Livability +3.5/5.0
- 1% rule +2.9/10.0
- Rent growth +2.5/5.0
- Condition / age +2.5/5.0
- Appreciation +0.0/10.0
$199,999
🖨 Deal sheet (PDF) 📄 Offer letter ✓ Due diligence
Listing remarks
Under contract-accepting backup offers. This home is a must see and ready for immediate occupancy. The home features 4 bedrooms, 2 full baths, a nicely appointed kitchen, large den/flex space, inside laundry/utility room and a screened back porch. It has a large yard and the back is fenced for your family to enjoy or your furry friends. A large carport that will protect your cars or toys. There is a utility shed in the back for lawn equipment or storage. Reroofed in 2023 and HVAC in 2016. Located in NE Ocala with close proximity to shopping, medical and restaurants. Call for your appointment to view before it's gone!
Key facts
- Screened back porch
- Large yard
- Large carport
Tags
Property features AI
Finance
- Other: Lot approximately 0.54 acres (dimensions 158 x 150); Living area 1,456 (per public records); total building area 1,704; Zoned R1A
Exterior
- Parking: Carport with 2 spaces
- Utilities: Public water; Public sewer; Cable available; Electricity connected; Water connected; Sewer connected
- Home design: Single family residence; One story; Faces south; Homesteaded property
- Construction: Block construction; Shingle roof; Block and concrete perimeter foundation; Built on one level
- Exterior features: Private mailbox; Storage; Chain link fencing; Paved public road access
Interior
- Kitchen: Dishwasher; Microwave; Range; Refrigerator; Electric water heater
- Bedrooms: 4 bedrooms
- Flooring: Carpet; Laminate
- Bathrooms: 2 full bathrooms
- Heating & cooling: Central heating; Electric heating; Heat pump; Central air conditioning
- Interior features: Ceiling fans; Eat-in kitchen; Thermostat; Den/Library/Office; Fireplace (other type)
- Laundry & utility: Washer hookup; Electric dryer hookup; Laundry inside
Neighborhood map
What this means for you Summary
Snapshot
- This is a 3-bed/1.5-bath single-family listed at $200k.
Deal economics
- At list price, monthly cash flow is $47 ($567/yr) — positive.
- The deal already cash-flows at list — no discount required.
- To meet the 1% rule (rent ≥ 1% of price), the offer needs to be $158k (20.9% below list).
- Recommended offer: $158k (20.9% below list) — sets the bar for 1% rule.
- Cap rate 6.6% vs local median 4.1% in Ocala — top-decile yield for the area; either an underpriced asset or a hidden risk that comps aren't pricing in. Stress-test before assuming the spread holds.
Location & tenants
- Location reads 69/100 on livability (#476 in FL) — a middle-class / working-renter tenant base. Strengths: cost of living A+, housing A+, health & safety A+; Watch: crime F, amenities F, commute F.
- Marion (rural): math 42% / reading 43% proficiency, ranked #61 of 73 in FL (top 84%) — families likely to look elsewhere, expect single-tenant / working-renter base with shorter leases; 61% free/reduced lunch — lower-income household profile, screen leases tightly.
- Zoned schools: Oakcrest Elementary School (math 38% / reading 32%, grade F, #1,697 of 2,144 statewide, top 80%, 470 students, 83% FRL); Fort King Middle School (math 37% / reading 35%, grade F, #410 of 571 statewide, top 72%, 1,092 students, 71% FRL); Vanguard High School (math 22% / reading 48%, grade F, #379 of 667 statewide, top 58%, 1,661 students, 59% FRL).
- Market conditions: Rents soft (-0.1%/yr); 297 active listings in the ZIP; 17 comparable units currently listed for rent nearby; rentals at typical pace (median 23d on market — plan ~3-4 weeks tenant-placement turnaround); 7,071 units permitted in Marion County in 2024 (534 in 5+ unit buildings).
- This rent runs 36% of the median local income ($52k/yr) — at the standard rent-burdened threshold; future hikes will face affordability resistance.
Forward outlook
- Local home prices are declining (-3.0%/yr); year-one equity from $1k of loan paydown is wiped out by about $6k of value loss. Plan a longer hold.
- Marion County population projected at +13% by 2050 — modest demand growth; plan on rents tracking national, not racing it.
Negotiation context
- Only 6 days on market — expect competitive offers; lowballing is unlikely to land.
Risks & watch-outs
- Climate carrying-cost: major flood risk; severe wind risk, 99% chance of damaging wind over 30y; extreme-heat days projected 7→21/yr by 2055 (HVAC capex compounding) — expect insurance premiums to compound above CPI over the hold.
Questions for the listing agent
- Built in 1973 — when were the roof, HVAC, electrical panel, plumbing, and water heater last replaced?
- Is there a deadline driving the sale (1031 exchange, divorce, estate, relocation)? That informs how much negotiation room exists.
- Crime grade is F in this area — have there been break-ins, vandalism, or insurance claims at this property in the last 3 years? What carrier currently insures it and at what premium?
- The area grade is low — what's the realistic commute time and amenity access for the typical tenant pool here? Any planned neighborhood developments (good or bad) we should know about?
- What's the average days-on-market for RENTAL listings here right now (not sales)? A rising rental-DOM trend means longer vacancies and softer asking-rent achievability than the comps imply.
- What's the recent tenant-quality profile in this submarket — average credit score on applications, eviction rate, late-payment / NSF rate, and stable-employment percentage? A property-management company in the area should have these aggregated.
- How much new for-sale + rental construction is in the pipeline within 1–3 miles? Heavy new supply typically softens prices + rents 12–24 months out; constrained supply supports both.
Investment metrics
- 1% rule
- 0.79% ✗
- Cap rate
- 6.58%
- Cash-on-cash
- 1.01%
- DSCR
- 1.05
- GRM
- 10.5
CMA / ARV
- ARV (median comp)
- $213,529
- List price
- $199,999
- Delta
- -6.34%
- Verdict
- FAIR
- Comps
- 20 within 1.0 mi
Projected returns pro-forma
-3.0% appreciation · 0.0% rent growth · sell at horizon
- IRR
- -17.7%
- Equity multiple
- 0.39×
- Total profit
- $-34,121
- Equity at exit
- $29,821
- IRR
- -15.9%
- Equity multiple
- 0.21×
- Total profit
- $-44,099
- Equity at exit
- $17,292
Cash invested: $56,000 (down + closing). Projections, not guarantees.
Landlord ↔ Tenant lean methodology
- Overall (STATE)
- 87 Strongly Landlord-Friendly
- State Florida
- 87 Strongly Landlord-Friendly · R+3
- County
- — inherits STATE
- City
- — inherits STATE
ZIP-level market 34470
- Home prices YoY
- -27.6%
- Rents YoY
- -0.1%
- Active inventory
- 297
- Price-to-rent
- 10.5×
Monthly cashflow live
- Estimated rent
- $1,581 high interval (Pro) →
- Mortgage (P&I)
- −$1,049
- Tax from tax record
- −$70 /mo · $836/yr
- Insurance
- −$83
- HOA
- −$0
- Vacancy / Maint / Mgmt
- −$332
- Net cashflow
- $47
Break-even live
Sensitivity live
| Price | -10% $160 | -5% $104 | +0% $47 | +5% $-9 | +10% $-66 |
|---|---|---|---|---|---|
| Rent | -10% $-78 | -5% $-15 | +0% $47 | +5% $110 | +10% $172 |
| Rate | -1.0pp $148 | -0.5pp $98 | base $47 | +0.5pp $-5 | +1.0pp $-57 |
UW: 25.0% down · 7.5% · 30yr · 1.5% tax · 5.0% vac · 8.0% maint · 8.0% mgmt
Financing live
Cash to close
- Down payment
- $50,000
- Closing costs
- $6,000
- Reserves months
- —
- Total cash needed
- —
Loan-product check · same deal, 3 products live
Conventional
25% down · 7.5% · 30yr
- Down + closing
- —
- Monthly P&I
- —
- Monthly cashflow
- —
- DSCR
- —
- Eligible?
- —
Personal DTI + credit; lowest rate.
DSCR
20% down · 8.5% · 30yr
- Down + closing
- —
- Monthly P&I
- —
- Monthly cashflow
- —
- DSCR
- —
- Eligible?
- —
No personal income docs; deal must DSCR.
Hard money
10% down · 12.0% · 12mo
- Down + closing
- —
- Monthly P&I
- —
- Monthly cashflow
- —
- DSCR
- —
- Eligible?
- —
Short-term bridge; refi at stabilization.
Rent comps 17 comps
| Address | Beds | Baths | Sqft | Rent | $/sqft | DOM | Units | Dist |
|---|---|---|---|---|---|---|---|---|
| 2205 NE 14th Ave Ocala, FL | 3.0 | 1.0 | 1020 | $1,345 | $1.32 | 23d | 1 | 0.10mi |
| 1643 NE 16th Ave Unit B Ocala, FL | 2.0 | 1.0 | 1635 | $1,450 | $0.89 | 23d | 1 | 0.48mi |
| 1838 NE 17th St Ocala, FL | 2.0 | 1.0 | 1680 | $1,200 | $0.71 | 16d | 1 | 0.62mi |
| 3219 NE 16th Ct Unit 3219 Ocala, FL | 3.0 | 2.0 | 1200 | $1,700 | $1.42 | 16d | 1 | 0.67mi |
| 2122 NE 28th Pl Ocala, FL | 3.0 | 2.0 | 1328 | $2,100 | $1.58 | 16d | 1 | 0.68mi |
| 712 NE 26th St Ocala, FL | 3.0 | 2.0 | 1105 | $1,590 | $1.44 | 23d | 1 | 0.69mi |
| 2855 NE 20th Ter Ocala, FL | 3.0 | 2.0 | 1504 | $1,875 | $1.25 | 16d | 1 | 0.70mi |
| 708 NE 26th St Ocala, FL | 3.0 | 2.0 | 1100 | $1,600 | $1.45 | 23d | 1 | 0.70mi |
| 408 NE 12th Ave Ocala, FL | 4.0 | 2.0 | 1808 | $2,100 | $1.16 | 23d | 1 | 1.34mi |
| 1706 NE 4th St Ocala, FL | 3.0 | 2.0 | 1573 | $2,100 | $1.34 | 16d | 1 | 1.39mi |
| 2701 NE 10th St #406 Ocala, FL | 2.0 | 2.5 | 1200 | $1,450 | $1.21 | 16d | 1 | 1.42mi |
| 1549 NE 2nd St Unit B Ocala, FL | 2.0 | 2.0 | 1036 | $1,249 | $1.21 | 23d | 1 | 1.43mi |
| 1718 NE 3rd St Ocala, FL | 2.0 | 1.5 | 1200 | $1,289 | $1.07 | 16d | 1 | 1.45mi |
| 1718 NE 3rd St Ocala, FL | 2.0 | 1.5 | 1200 | $1,289 | $1.07 | 23d | 1 | 1.45mi |
| 1812 NE 3rd St Unit 1808 Ocala, FL | 2.0 | 2.0 | 936 | $1,599 | $1.71 | 16d | 1 | 1.46mi |
| 1812 NE 3rd St Unit 1752 Ocala, FL | 2.0 | 2.0 | 936 | $1,499 | $1.60 | 23d | 1 | 1.47mi |
| 1713 NE 2nd St Ocala, FL | 2.0 | 1.5 | 1200 | $1,289 | $1.07 | 23d | 1 | 1.50mi |
Listing history 2 events
-
2026-05-13$199,999 Active 584-char remark
-
1972-01-01soldstatus $19,600
ⓘ Source: listings_history table (triggers on properties + properties_extension) + one-shot
backfill from property_details.listing_events for pre-trigger history.
Tax reassessment forecast FL · Resets to sale price
- Current annual tax
- $836 · $70/mo
- Projected year-2 tax
- $1,660 · $138/mo
- Expected delta
- +$824/yr (+$69/mo · 98.6%)
ⓘ Screening estimate from a state-policy table — verify with the county assessor before closing.
Climate risk First Street
- Flood 6/10 Major FEMA zone X (shaded) · 70% chance over 30 yrs
- Wildfire 2/10 Low
- Heat 8/10 Severe 7 d/yr ≥108°F today · 21 d/yr by 30 yrs out
- Wind 9/10 Extreme 99% chance of damaging wind over 30 yrs
- Air quality 4/10 Moderate 5 unhealthy d/yr today · 5 by 30 yrs out
Nearby sold comps map
Loading sold comps map…
Walkable amenities ~0.75 mi
Loading nearby amenities…
Taxation est. · year 1
- Rental income
- $18,972
- − Mortgage interest
- −$11,203
- − Property taxes
- −$836
- − Insurance
- −$1,000
- − Repairs & maintenance
- −$1,518
- − Management
- −$1,518
- − Depreciation
- −$5,818
- Taxable loss
- −$2,920
- Est. tax savings @ 24.0%
- +$701
- After-tax cash flow
- $1,268/yr
For passive investors: Depreciation is non-cash, so a rental often shows a tax loss while cash-flowing — sheltering income. Rental losses are passive: they offset passive income freely, and up to $25,000/yr can offset ordinary (W-2) income if you actively participate and your MAGI is under $100k (phasing out to $0 by $150k); unused losses carry forward. On sale, claimed depreciation is recaptured at up to 25%, and gains may owe capital-gains tax (a 1031 exchange can defer both). Figures are a year-1 estimate at your 24.0% rate — not tax advice; consult a CPA.
Schools (NCES district)
- District
- Marion
- NCES district ID
- 1201260
- Math proficiency
- 42% ▼ -7.00%
- Reading proficiency
- 43% ▼ -4.00%
- Median HH income
- $40,015
- Composite
- 35.61/100
- National rank
- #4890
- State rank
- #61 of 73 in FL
Livability — Ocala
- Score
- 69/100
- State rank
- #476
- US rank
- #8461
Category grades
Schools grade is shown separately in the Schools card above.
Census & demographics
- Census place
- Ocala, FL
- County
- Marion County · 315,796 people
- City population
- 263,375
- Metro
- Ocala, FL
- Population (ZIP)
- 22,443
- Household income
- $52,083
- Rent vs Own
- Severe rent burden
- 771.0
Population outlook (Marion County) Hauer SSP2
- Today (2025)
- 365,905 people
- By 2030
- 376,768 · +3.0%
- By 2040
- 396,555 · +8.4%
- By 2050
- 412,723 · +12.8%
- By 2075
- 446,090 · +21.9%
- By 2100
- 436,193 · +19.2%
Race, ethnicity, and origin ACS 2023
- Neighborhood character
- Predominantly White (71%)
- Race & ethnicity
- White 71% Two or more races 12% Hispanic / Latino 12% Black 10% Asian 1%
- Hispanic origin (detail)
- Mexican 2% Puerto Rican 6% Cuban 1%
- Common ancestry
- Lithuanian 3% Romanian 2% Italian 2%
- Foreign-born
- 6% · Canada, Jamaica, Vietnam
- Languages at home
- 89% English-only · Spanish 9%
Political lean MEDSL · Marion
- 2024 margin
- Solid R (+31.6) · D 33.8% · R 65.5%
- 2008→2024 swing
- -20.0pp toward R · 2008: -11.6pp · 2024: -31.6pp
- All cycles
- 2024: R+31.6 2020: R+25.9 2016: R+26.2 2012: R+16.2 2008: R+11.6
Not yet ingested
- Civics
- —
Market trends
- HPI YoY
- ▼ -92.74%
- Current HPI
- 242.686
- Rent YoY
- ▼ -0.07%
- Metro
- Ocala, FL
- State GDP YoY
- ▲ 3.28%
- F500 in state
- 36
Industry mix (Fortune 500 HQ in FL)
| Industry | F500 HQs | Revenue |
|---|---|---|
| Industrial Technology | 2 | $29B |
|
||
| Insurance | 2 | $17B |
|
||
| Retail | 1 | $60B |
|
||
| Technology Distribution | 1 | $58B |
|
||
| Homebuilding | 1 | $35B |
|
||
| Technology Manufacturing | 1 | $35B |
|
||
Price history
+894.9% since first listed4 events — show timeline
- 2026-06-05 Sold (MLS) $195,000 Stellar MLS as Distributed by MLS Grid
- 2026-05-19 Pending — Stellar MLS as Distributed by MLS Grid
- 2026-05-13 Listed $199,999 Stellar MLS as Distributed by MLS Grid
- 1972-01-01 Sold (Public Records) $19,600 Public Records
Property tax history
+4.5%/yrLatest (2025): $836 · +2.3% YoY. Source: county tax records.
Cash-flow waterfall
monthlySold comps — $/sqft
last 12 mo · ≤1 miLoading sold comps…