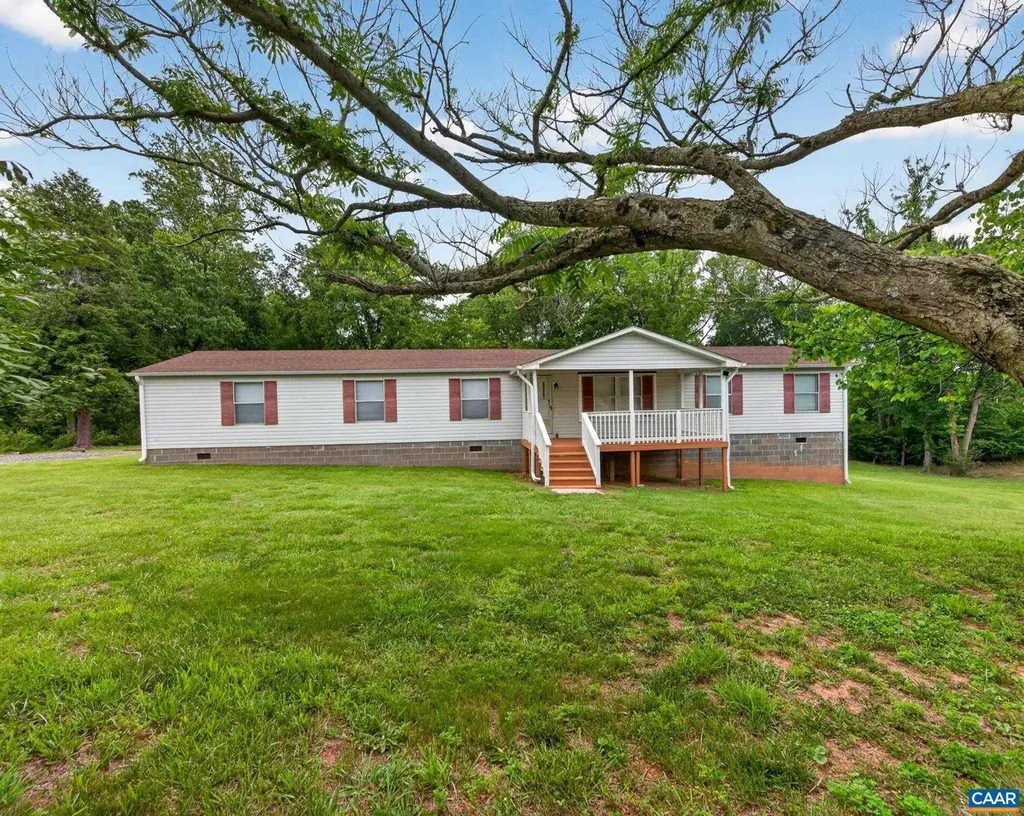
2026 Banton Shop Rd · Buckingham Courthouse, VA
Flood risk 1/10 · Minimal
- FEMA flood zone
- X (unshaded)
- Chance of flooding over 30 yrs
- 0.0%
- Est. flood insurance / yr
- $507 – $1,088
Fire risk 5/10 · Moderate
- Est. fire insurance / yr
- $666 – $1,236
Heat risk 6/10 · Moderate
- Hot days now (above 104°F)
- 7 days/yr
- Hot days in 30 yrs
- 17 days/yr
Wind risk 3/10 · Minor
- Chance of severe wind over 30 yrs
- 5.0%
Air-quality risk 2/10 · Minimal
- Unhealthy air days now
- 0 days/yr
- Unhealthy air days in 30 yrs
- 1 days/yr
Risk factors via First Street. Map © Google.
Why this score? — see what drove the D- grade
The composite is a weighted blend of 9 inputs, each scored 0–100. Each bar is that input's sub-score; the figure is the points it added to the 100-point composite (weight × sub-score).
- Appreciation +10.0/10.0
- Cash flow +8.3/30.0
- ARV discount +4.9/15.0
- Schools +3.6/10.0
- Livability +3.2/5.0
- Rent growth +2.5/5.0
- Condition / age +2.5/5.0
- DSCR +2.2/10.0
- 1% rule +1.5/10.0
$309,900
🖨 Deal sheet (PDF) 📄 Offer letter ✓ Due diligence
Listing remarks MLS
Large property with lots of acreage! Covered front porch and addition on back. Needs some TLC, great investment property!
Key facts
- Room for gardens
- Vaulted ceilings
- Room for animals
Tags
Property features AI
Exterior
- Utilities: Well water (private); Septic tank; Fiber optic available
- Home design: Detached single-level home; One story
- Construction: Manufactured construction with vinyl siding; Block foundation; Composition shingle roof
- Exterior features: Front porch; Porch; Lot of approximately 6.89 acres
Interior
- Kitchen: Kitchen on the main level
- Bedrooms: Four main-level bedrooms; Primary bedroom on the first level
- Bathrooms: Two full bathrooms, both on the main level; Primary bathroom on the first level
- Heating & cooling: Heat pump heating; Central air conditioning
- Interior features: Primary suite located on the main level; Utility room; One fireplace
- Laundry & utility: Washer hookup; Dryer hookup; Utility room on the main level
Neighborhood map
What this means for you Summary
Snapshot
- This is a 4-bed/2.0-bath single-family listed at $310k.
Deal economics
- At list price, monthly cash flow is $-286 ($-3k/yr) — negative.
- To cash-flow at today's rent, offer at most $259k (16.3% below list).
- To meet the 1% rule (rent ≥ 1% of price), the offer needs to be $201k (35.2% below list).
- Recommended offer: $201k (35.2% below list) — sets the bar for 1% rule.
Location & tenants
- Location reads 64/100 on livability (#363 in VA) — a middle-class / working-renter tenant base. Strengths: crime A+, employment A+, housing A+; Watch: amenities F, commute F, health & safety F.
- Buckingham County Public School District (rural): math 36% / reading 49% proficiency, ranked #117 of 131 in VA (top 89%) — families likely to look elsewhere, expect single-tenant / working-renter base with shorter leases; 60% free/reduced lunch — lower-income household profile, screen leases tightly.
- Zoned schools: Buckingham Co Primary (355 students, 93% FRL); Buckingham County Middle (math 31% / reading 50%, grade F, #303 of 342 statewide, top 89%, 466 students, 92% FRL); Buckingham County High (math 57% / reading 62%, grade C+, #247 of 319 statewide, top 80%, 654 students, 92% FRL) — zoned schools average 92% FRL vs 60% district-wide (32 pts higher); higher-poverty schools than district average — tighter screening recommended.
- Market conditions: 63 active listings in the ZIP; 96 units permitted in Buckingham County in 2024 (0 in 5+ unit buildings).
Forward outlook
- In year one you build about $33k of equity ($2k loan paydown + $31k appreciation (10.0% local appreciation)).
- Buckingham County population projected to shrink 8% by 2050 — rents likely to lag national; underwrite the cash flow, not the appreciation.
- By year 2, paydown + projected appreciation supports a ~$53k cash-out refi (75% LTV) — recoverable capital for the next deal without selling this one.
Negotiation context
- Only 14 days on market — expect competitive offers; lowballing is unlikely to land.
- 3 sale attempts since 9y ago with the ask held roughly flat each time — persistent listings suggest the price (not the market) is what's stuck; bring a comps-based counter.
- Current owner paid $35k; list at $310k implies a 796% gain — meaningful room to come down on a strong offer.
Risks & watch-outs
- Climate carrying-cost: moderate wildfire risk; extreme-heat days projected 7→17/yr by 2055 (HVAC capex compounding) — expect insurance premiums to compound above CPI over the hold.
Questions for the listing agent
- What do current leases actually rent for vs. the listed asking? Can we see a recent rent roll and the last 12 months of T-12 income?
- Is there a deadline driving the sale (1031 exchange, divorce, estate, relocation)? That informs how much negotiation room exists.
- Schools are F-rated, which usually means shorter tenancies and higher turnover. Who's the typical renter profile here, and what's been the actual vacancy rate?
- The area grade is low — what's the realistic commute time and amenity access for the typical tenant pool here? Any planned neighborhood developments (good or bad) we should know about?
- What's the average days-on-market for RENTAL listings here right now (not sales)? A rising rental-DOM trend means longer vacancies and softer asking-rent achievability than the comps imply.
- What's the recent tenant-quality profile in this submarket — average credit score on applications, eviction rate, late-payment / NSF rate, and stable-employment percentage? A property-management company in the area should have these aggregated.
- How much new for-sale + rental construction is in the pipeline within 1–3 miles? Heavy new supply typically softens prices + rents 12–24 months out; constrained supply supports both.
Investment metrics
- 1% rule
- 0.65% ✗
- Cap rate
- 5.19%
- Cash-on-cash
- -3.95%
- DSCR
- 0.82
- GRM
- 12.9
CMA / ARV
- ARV (on-the-fly)
- $293,250
- Comps found
- 1
Show comp detail 1 sale within ~0.75 mi
| Address | Dist | Beds/Ba | Sqft | Sold | Price | $/sf | Match |
|---|---|---|---|---|---|---|---|
| 2237 Banton Shop Rd | 0.17mi | 4/2.0 | 1,908 (+11%) | 8mo | $325,000 | $170 | 68 |
Match score weights: distance 35% · size 25% · config 20% · recency 20%. Top-matched comps best support the ARV.
Projected returns pro-forma
10.0% appreciation · 3.0% rent growth · sell at horizon
- IRR
- 21.5%
- Equity multiple
- 2.73×
- Total profit
- $150,430
- Equity at exit
- $279,182
- IRR
- 19.4%
- Equity multiple
- 6.27×
- Total profit
- $457,047
- Equity at exit
- $602,068
Cash invested: $86,772 (down + closing). Projections, not guarantees.
Landlord ↔ Tenant lean methodology
- Overall (STATE)
- 55 Moderately Landlord-Leaning
- State Virginia
- 55 Moderately Landlord-Leaning · D+2
- County
- — inherits STATE
- City
- — inherits STATE
ZIP-level market 23936
- Home prices YoY
- 21.8%
- Active inventory
- 63
- Price-to-rent
- 12.9×
Monthly cashflow live
- Estimated rent
- $2,007 medium interval (Pro) →
- Mortgage (P&I)
- −$1,625
- Tax from tax record
- −$118 /mo · $1,411/yr
- Insurance
- −$129
- HOA
- −$0
- Lot rent
- −$0
- Vacancy / Maint / Mgmt
- −$422
- Net cashflow
- $-286
Break-even live
Sensitivity live
| Price | -10% $-111 | -5% $-198 | +0% $-286 | +5% $-374 | +10% $-461 |
|---|---|---|---|---|---|
| Rent | -10% $-445 | -5% $-365 | +0% $-286 | +5% $-207 | +10% $-127 |
| Rate | -1.0pp $-130 | -0.5pp $-207 | base $-286 | +0.5pp $-366 | +1.0pp $-448 |
UW: 25.0% down · 7.5% · 30yr · 1.5% tax · 5.0% vac · 8.0% maint · 8.0% mgmt
Financing live
Cash to close
- Down payment
- $77,475
- Closing costs
- $9,297
- Reserves months
- —
- Total cash needed
- —
Loan-product check · same deal, 3 products live
Conventional
25% down · 7.5% · 30yr
- Down + closing
- —
- Monthly P&I
- —
- Monthly cashflow
- —
- DSCR
- —
- Eligible?
- —
Personal DTI + credit; lowest rate.
DSCR
20% down · 8.5% · 30yr
- Down + closing
- —
- Monthly P&I
- —
- Monthly cashflow
- —
- DSCR
- —
- Eligible?
- —
No personal income docs; deal must DSCR.
Hard money
10% down · 12.0% · 12mo
- Down + closing
- —
- Monthly P&I
- —
- Monthly cashflow
- —
- DSCR
- —
- Eligible?
- —
Short-term bridge; refi at stabilization.
Listing history 12 events
-
2026-06-23days on market $309,900 Active 14 DOM
-
2026-06-22days on market $309,900 Active 13 DOM
-
2026-06-19days on market $309,900 Active 11 DOM
-
2026-06-18days on market $309,900 Active 10 DOM
-
2026-06-17days on market $309,900 Active 9 DOM
-
2026-06-16days on market $309,900 Active 8 DOM
-
2026-06-15days on market $309,900 Active 7 DOM
-
2026-06-14days on market $309,900 Active 5 DOM
-
2026-06-13days on market $309,900 Active 4 DOM
-
2026-06-10days on market $309,900 Active 2 DOM
-
2026-06-09remarks 699-char remark
-
2026-06-09$309,900 Active 1 DOM
ⓘ Source: listings_history table (triggers on properties + properties_extension) + one-shot
backfill from property_details.listing_events for pre-trigger history.
Tax reassessment forecast VA · Resets to sale price
- Current annual tax
- $1,411 · $118/mo
- Projected year-2 tax
- $2,541 · $212/mo
- Expected delta
- +$1,130/yr (+$94/mo · 80.1%)
ⓘ Screening estimate from a state-policy table — verify with the county assessor before closing.
Climate risk First Street
- Flood 1/10 Low FEMA zone X (unshaded) · 0% chance over 30 yrs
- Wildfire 5/10 Major
- Heat 6/10 Major 7 d/yr ≥104°F today · 17 d/yr by 30 yrs out
- Wind 3/10 Moderate 5% chance of damaging wind over 30 yrs
- Air quality 2/10 Low 0 unhealthy d/yr today · 1 by 30 yrs out
Nearby sold comps map
Loading sold comps map…
Walkable amenities ~0.75 mi
Loading nearby amenities…
Taxation est. · year 1
- Rental income
- $24,090
- − Mortgage interest
- −$17,359
- − Property taxes
- −$1,411
- − Insurance
- −$1,550
- − Repairs & maintenance
- −$1,927
- − Management
- −$1,927
- − Depreciation
- −$9,015
- Taxable loss
- −$9,100
- Est. tax savings @ 24.0%
- +$2,184
- After-tax cash flow
- $-1,248/yr
For passive investors: Depreciation is non-cash, so a rental often shows a tax loss while cash-flowing — sheltering income. Rental losses are passive: they offset passive income freely, and up to $25,000/yr can offset ordinary (W-2) income if you actively participate and your MAGI is under $100k (phasing out to $0 by $150k); unused losses carry forward. On sale, claimed depreciation is recaptured at up to 25%, and gains may owe capital-gains tax (a 1031 exchange can defer both). Figures are a year-1 estimate at your 24.0% rate — not tax advice; consult a CPA.
Schools (NCES district)
- District
- Buckingham County Public School District
- NCES district ID
- 5100540
- Math proficiency
- 36% ▼ -38.00%
- Reading proficiency
- 49% ▼ -12.00%
- Median HH income
- $40,158
- Composite
- 35.58/100
- National rank
- #4897
- State rank
- #117 of 131 in VA
Livability — Buckingham Courthouse
- Score
- 64/100
- State rank
- #363
- US rank
- #14483
Category grades
Schools grade is shown separately in the Schools card above.
Census & demographics
- Population (ZIP)
- 6,992
Population outlook (Buckingham County) Hauer SSP2
- Today (2025)
- 16,866 people
- By 2030
- 16,625 · -1.4%
- By 2040
- 16,108 · -4.5%
- By 2050
- 15,588 · -7.6%
- By 2075
- 14,125 · -16.3%
- By 2100
- 11,701 · -30.6%
Race, ethnicity, and origin ACS 2023
- Neighborhood character
- Diverse neighborhood (Simpson 0.56)
- Race & ethnicity
- White 53% Black 40% Two or more races 5% Hispanic / Latino 1%
- Common ancestry
- Lithuanian 1% Slovak 1% Scotch-Irish 1%
- Foreign-born
- 2% · Canada
- Languages at home
- 96% English-only · German/W. Germanic 2% Spanish 1%
Political lean MEDSL · Buckingham
- 2024 margin
- Strong R (+23.5) · D 37.8% · R 61.2% · Other 1.0%
- 2008→2024 swing
- -24.4pp toward R · 2008: 0.9pp · 2024: -23.5pp
- All cycles
- 2024: R+23.5 2020: R+13.2 2016: R+11.6 2012: D+2.4 2008: D+0.9
Not yet ingested
- Civics
- —
Market trends
- HPI YoY
- ▲ 39.71%
- Current HPI
- 221.8804
- Rent YoY
- —
- Metro
- —
- State GDP YoY
- ▲ 2.40%
- F500 in state
- 50
Industry mix (Fortune 500 HQ in VA)
| Industry | F500 HQs | Revenue |
|---|---|---|
| Aerospace / Defense | 4 | $236B |
|
||
| Technology / Defense | 3 | $32B |
|
||
| Financial Services | 2 | $176B |
|
||
| Utilities | 2 | $27B |
|
||
| Insurance | 2 | $25B |
|
||
| Technology | 2 | $15B |
|
||
Price history
+377.5% since first listed4 events — show timeline
- 2026-06-08 Listed $309,900 CAAR
- 2017-05-26 Sold (MLS) $34,600 LMLS
- 2017-04-24 Listed $39,900 LMLS
- 2017-01-27 Listed $64,900 GAAR
Property tax history
+6.9%/yrLatest (2026): $1,411 · +89.8% YoY. Source: county tax records.
Cash-flow waterfall
monthlySold comps — $/sqft
last 12 mo · ≤1 miLoading sold comps…