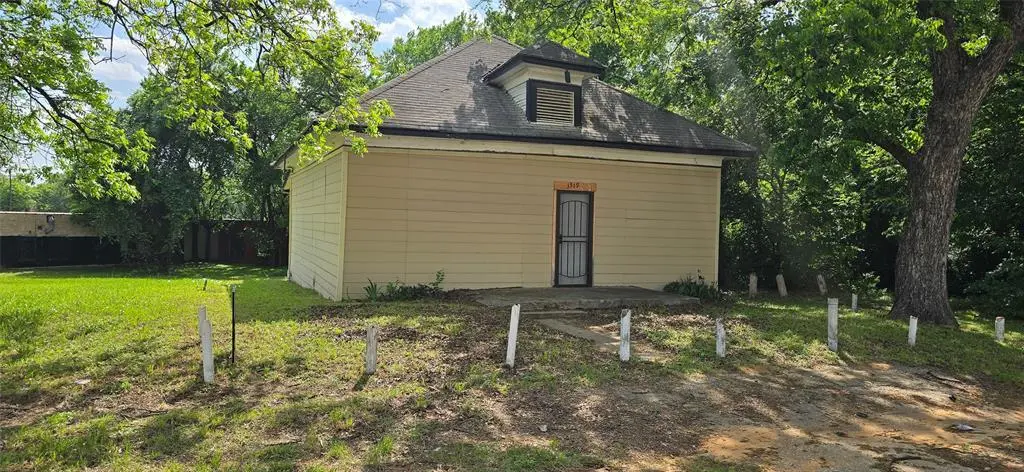
3519 Parnell St · Dallas, TX
Flood risk 3/10 · Minor
- FEMA flood zone
- X (shaded)
- Chance of flooding over 30 yrs
- 0.14%
- Est. flood insurance / yr
- $507 – $1,088
Fire risk 2/10 · Minimal
- Est. fire insurance / yr
- $1,222 – $2,270
Heat risk 7/10 · Major
- Hot days now (above 109°F)
- 7 days/yr
- Hot days in 30 yrs
- 24 days/yr
Wind risk 6/10 · Moderate
- Chance of severe wind over 30 yrs
- 27.0%
Air-quality risk 3/10 · Minor
- Unhealthy air days now
- 2 days/yr
- Unhealthy air days in 30 yrs
- 3 days/yr
Risk factors via First Street. Map © Google.
Why this score? — see what drove the A- grade
The composite is a weighted blend of 9 inputs, each scored 0–100. Each bar is that input's sub-score; the figure is the points it added to the 100-point composite (weight × sub-score).
- Cash flow +30.0/30.0
- ARV discount +15.0/15.0
- DSCR +10.0/10.0
- 1% rule +9.4/10.0
- Appreciation +5.4/10.0
- Rent growth +4.3/5.0
- Livability +4.0/5.0
- Schools +2.8/10.0
- Condition / age +2.5/5.0
$149,900
🖨 Deal sheet (PDF) 📄 Offer letter ✓ Due diligence
Listing remarks
Prime opportunity! This property is a great fit for a buyer with a vision for renovation or an investor looking to build from the ground up. The surrounding neighborhood is experiencing new construction and redevelopment throughout. The home features 3 bedrooms, 1 bathroom, and approximately 1,372 square feet, originally built in 1910. Conveniently located near Downtown Dallas, Dallas Love Field, Fair Park, and the Dallas Farmers Market, this property offers easy access to dining, entertainment, and a vibrant lifestyle.
Key facts
- New construction
- Redevelopment
- 6,752 sq ft lot
Tags
Property features AI
Finance
- Other: Unknown encumbrance(s) listed in restrictions; Will not subdivide
- Financial info: Listing terms: Cash, Conventional; Loan type treated as clear; No second mortgage indicated; Special listing conditions: Standard; Possession at closing/funding
- HOA & community: No association (no HOA)
Exterior
- Parking: No garage; No covered parking; No carport spaces
- Security: No smart home features listed
- Utilities: City water; City sewer; Not in a municipal utility district
- Home design: Single family residence; Residential property; One story; Property is not attached; Accessibility features not present; Subdivision: Russell Realty Co Colonial Hill
- Construction: Built in 1910; Wood construction; Composition roof; Preowned
- Exterior features: Interior lot; No fencing
Interior
- Kitchen: Kitchen (1st level) approximately 10 x 9; No appliances included
- Bedrooms: Primary bedroom (1st level) approximately 10 x 12; Bedroom (1st level) approximately 10 x 10; Bedroom (1st level) approximately 10 x 10
- Flooring: No flooring details provided
- Bathrooms: 1 full bathroom (1st level) approximately 9 x 8
- Heating & cooling: No heating or cooling details provided
- Interior features: One-level layout; 7 total rooms; One living area; One dining area; Other interior features
- Laundry & utility: No specific laundry or utility features listed
Neighborhood map
What this means for you Summary
Snapshot
- This is a 3-bed/1.0-bath single-family listed at $150k.
Deal economics
- At list price, monthly cash flow is $690 ($8k/yr) — positive.
- The deal already cash-flows at list — no discount required.
- Meets the 1% rule at list price ($2k rent vs $150k).
- Recommended offer: $145k (3.0% below list) — sets the bar for market timing.
- Cap rate 11.8% vs local median 2.3% in Dallas — top-decile yield for the area; either an underpriced asset or a hidden risk that comps aren't pricing in. Stress-test before assuming the spread holds.
Location & tenants
- Location reads 81/100 on livability (#24 in TX, #1,380 nationally) — a professional / high-income tenant draw. Strengths: amenities A+, commute A+, housing A+; Watch: crime F.
- Dallas ISD (urban): math 31% / reading 36% proficiency, ranked #559 of 826 in TX (top 68%) — families likely to look elsewhere, expect single-tenant / working-renter base with shorter leases; 83% free/reduced lunch — lower-income household profile, screen leases tightly.
- Zoned schools: Paul L Dunbar Learning Center (math 27% / reading 22%, grade F, #3,052 of 4,322 statewide, top 74%, 531 students, 95% FRL); Billy Earl Dade Middle (math 18% / reading 23%, grade F, #1,407 of 1,662 statewide, top 86%, 636 students, 100% FRL); James Madison H S (math 17% / reading 17%, grade F, #1,491 of 1,632 statewide, top 92%, 359 students, 96% FRL).
- Zoned-school proficiency averages 21% at this address vs 34% district-wide (-13 pts) — the specific schools serving this property underperform the Dallas ISD average; the district grade overstates school quality for this exact location.
- Market conditions: Rents rising fast (+7.2%/yr); 247 active listings in the ZIP; 40 comparable units currently listed for rent nearby; rentals at typical pace (median 17d on market — plan ~3-4 weeks tenant-placement turnaround); 12,577 units permitted in Dallas County in 2024 (6,829 in 5+ unit buildings).
Forward outlook
- In year one you build about $2k of equity ($1k loan paydown + $1k appreciation (0.8% local appreciation)).
- Dallas County population projected at +35% by 2050 — long-run rental-demand tailwind backs the buy-and-hold thesis.
- At projected returns (0.8% appreciation + 7.2% rent growth), your $42k cash investment doubles in ~4 years — after that, you're playing with house money.
Negotiation context
- It's been on market 57 days — a 3% lower offer ($145k) is reasonable based on typical stale-listing flexibility.
- 2 sale attempts with the ask held roughly flat each time — persistent listings suggest the price (not the market) is what's stuck; bring a comps-based counter.
Risks & watch-outs
- Watch-outs: built in 1910 — expect roof / HVAC / electrical / plumbing capex.
- Climate carrying-cost: major wind risk, 27% chance of damaging wind over 30y; extreme-heat days projected 7→24/yr by 2055 (HVAC capex compounding) — expect insurance premiums to compound above CPI over the hold.
Questions for the listing agent
- It's been on market 57 days. Have you received any prior offers? Is the seller open to a 3% concession, seller financing, or rate buy-down credit?
- Built in 1910 — when were the roof, HVAC, electrical panel, plumbing, and water heater last replaced?
- Is there a deadline driving the sale (1031 exchange, divorce, estate, relocation)? That informs how much negotiation room exists.
- Crime grade is F in this area — have there been break-ins, vandalism, or insurance claims at this property in the last 3 years? What carrier currently insures it and at what premium?
- What's the average days-on-market for RENTAL listings here right now (not sales)? A rising rental-DOM trend means longer vacancies and softer asking-rent achievability than the comps imply.
- What's the recent tenant-quality profile in this submarket — average credit score on applications, eviction rate, late-payment / NSF rate, and stable-employment percentage? A property-management company in the area should have these aggregated.
- How much new for-sale + rental construction is in the pipeline within 1–3 miles? Heavy new supply typically softens prices + rents 12–24 months out; constrained supply supports both.
Investment metrics
- 1% rule
- 1.44% ✓
- Cap rate
- 11.82%
- Cash-on-cash
- 19.72%
- DSCR
- 1.88
- GRM
- 5.8
CMA / ARV
- ARV (median comp)
- $210,000
- List price
- $149,900
- Delta
- -28.62%
- Verdict
- UNDERPRICED
- Comps
- 20 within 1.0 mi
Show comp detail 12 sales within ~0.75 mi
| Address | Dist | Beds/Ba | Sqft | Sold | Price | $/sf | Match |
|---|---|---|---|---|---|---|---|
| 1570 Panama Pl | 0.21mi | 3/2.5 | 1,376 (+0%) | 4mo | $205,000 | $149 | 81 |
| 3300 Holmes St | 0.19mi | 3/2.5 | 1,473 (+7%) | 4mo | $215,000 | $146 | 70 |
| 1422 Mcdonald Ave | 0.39mi | 3/2.0 | 1,350 (-2%) | 6mo | $295,000 | $219 | 70 |
| 1817 Cooper St | 0.42mi | 3/2.5 | 1,405 (+2%) | 4mo | $220,000 | $157 | 67 |
| 2312 Jordan St | 0.64mi | 3/2.0 | 1,386 (+1%) | 1mo | $188,500 | $136 | 63 |
| 3500 S Harwood St | 0.45mi | 3/2.0 | 1,448 (+6%) | 5mo | $100,000 | $69 | 62 |
| 3740 Wendelkin St | 0.47mi | 3/1.0 | 1,478 (+8%) | 7mo | $125,000 | $85 | 59 |
| 1609 Pine St | 0.57mi | 3/2.0 | 1,445 (+5%) | 3mo | $229,000 | $158 | 58 |
| 2211 Romine Ave | 0.54mi | 4/2.0 (+1) | 1,456 (+6%) | 6mo | $99,995 | $69 | 50 |
| 3424 Kimble St | 0.56mi | 3/1.0 | 1,178 (-14%) | 2mo | $150,000 | $127 | 49 |
| 2232 Poplar St | 0.73mi | 3/1.0 | 1,231 (-10%) | 5mo | $90,000 | $73 | 45 |
| 2403 Romine Ave | 0.66mi | 3/2.0 | 1,170 (-15%) | 2mo | $210,000 | $179 | 38 |
Match score weights: distance 35% · size 25% · config 20% · recency 20%. Top-matched comps best support the ARV.
Projected returns pro-forma
0.79% appreciation · 7.19% rent growth · sell at horizon
- IRR
- 24.8%
- Equity multiple
- 2.30×
- Total profit
- $54,695
- Equity at exit
- $49,536
- IRR
- 30.3%
- Equity multiple
- 5.12×
- Total profit
- $172,951
- Equity at exit
- $64,580
Cash invested: $41,972 (down + closing). Projections, not guarantees.
Landlord ↔ Tenant lean methodology
- Overall (STATE)
- 87 Strongly Landlord-Friendly
- State Texas
- 87 Strongly Landlord-Friendly · R+5
- County
- — inherits STATE
- City
- — inherits STATE
ZIP-level market 75215
- Home prices YoY
- 0.3%
- Rents YoY
- 7.2%
- Active inventory
- 247
- Price-to-rent
- 5.8×
Monthly cashflow live
- Estimated rent
- $2,157 high interval (Pro) →
- Mortgage (P&I)
- −$786
- Tax from tax record
- −$166 /mo · $1,988/yr
- Insurance
- −$62
- HOA
- −$0
- Vacancy / Maint / Mgmt
- −$453
- Net cashflow
- $690
Break-even live
Sensitivity live
| Price | -10% $775 | -5% $732 | +0% $690 | +5% $647 | +10% $605 |
|---|---|---|---|---|---|
| Rent | -10% $519 | -5% $605 | +0% $690 | +5% $775 | +10% $860 |
| Rate | -1.0pp $765 | -0.5pp $728 | base $690 | +0.5pp $651 | +1.0pp $611 |
UW: 25.0% down · 7.5% · 30yr · 1.5% tax · 5.0% vac · 8.0% maint · 8.0% mgmt
Financing live
Cash to close
- Down payment
- $37,475
- Closing costs
- $4,497
- Reserves months
- —
- Total cash needed
- —
Loan-product check · same deal, 3 products live
Conventional
25% down · 7.5% · 30yr
- Down + closing
- —
- Monthly P&I
- —
- Monthly cashflow
- —
- DSCR
- —
- Eligible?
- —
Personal DTI + credit; lowest rate.
DSCR
20% down · 8.5% · 30yr
- Down + closing
- —
- Monthly P&I
- —
- Monthly cashflow
- —
- DSCR
- —
- Eligible?
- —
No personal income docs; deal must DSCR.
Hard money
10% down · 12.0% · 12mo
- Down + closing
- —
- Monthly P&I
- —
- Monthly cashflow
- —
- DSCR
- —
- Eligible?
- —
Short-term bridge; refi at stabilization.
Rent comps 40 comps
| Address | Beds | Baths | Sqft | Rent | $/sqft | DOM | Units | Dist |
|---|---|---|---|---|---|---|---|---|
| 3609 Cleveland St Dallas, TX | 4.0 | 2.5 | 1500 | $2,700 | $1.80 | 9d | 1 | 0.08mi |
| 3413 Wendelkin St Dallas, TX | 3.0 | 2.5 | 1724 | $2,650 | $1.54 | 3d | 1 | 0.37mi |
| 3521 S Harwood St Dallas, TX | 3.0 | 2.5 | 1750 | $2,700 | $1.54 | 4d | 1 | 0.42mi |
| 1630 Poplar St Dallas, TX | 2.0 | 1.0 | 903 | $1,400 | $1.55 | 26d | 1 | 0.52mi |
| 1628 Poplar St Dallas, TX | 2.0 | 1.0 | 903 | $1,400 | $1.55 | 45d | 1 | 0.53mi |
| 4024 Colonial Ave Dallas, TX | 4.0 | 2.0 | 1560 | $2,400 | $1.54 | 26d | 1 | 0.54mi |
| 3502 Edgewood St Dallas, TX | 4.0 | 2.0 | 1866 | $2,523 | $1.35 | 3d | 1 | 0.61mi |
| 3501 Latimer St Dallas, TX | 2.0 | 1.0 | 1008 | $1,095 | $1.09 | 4d | 1 | 0.70mi |
| 2507 Birmingham Ave Dallas, TX | 3.0 | 2.5 | 1516 | $2,500 | $1.65 | 26d | 1 | 0.75mi |
| 2545 Metropolitan Ave Dallas, TX | 3.0 | 1.0 | 936 | $1,750 | $1.87 | 1d | 1 | 0.84mi |
| 3711 Guaranty St Dallas, TX | 3.0 | 1.0 | 984 | $1,800 | $1.83 | 16d | 1 | 0.89mi |
| 1100 Corinth St Dallas, TX | 2.0–3.0 | 2.5–3.5 | 1572 | $3,595 | $2.29 | 45d | 10 | 1.03mi |
| 2513 Southland St Dallas, TX | 2.0 | 1.0 | 1010 | $1,299 | $1.29 | 4d | 1 | 1.06mi |
| 2513 Southland St Dallas, TX | 2.0 | 1.0 | 1010 | $1,399 | $1.39 | 22d | 1 | 1.06mi |
| 4024 Myrtle St Dallas, TX | 3.0 | 2.0 | 1106 | $1,595 | $1.44 | 6d | 1 | 1.06mi |
| 948 Corinth St Unit 15 Dallas, TX | 2.0 | 2.0 | 920 | $1,495 | $1.62 | 16d | 1 | 1.07mi |
| 948 Corinth St Unit 1 Dallas, TX | 2.0 | 2.0 | 1013 | $1,650 | $1.63 | 16d | 1 | 1.07mi |
| 948 Corinth St Unit 10 Dallas, TX | 2.0 | 2.0 | 920 | $1,525 | $1.66 | 16d | 1 | 1.07mi |
| 948 Corinth St Unit 11 Dallas, TX | 2.0 | 2.0 | 1013 | $1,595 | $1.57 | 16d | 1 | 1.07mi |
| 948 Corinth St Unit 5 Dallas, TX | 2.0 | 2.0 | 920 | $1,850 | $2.01 | 45d | 1 | 1.07mi |
| 948 Corinth St Unit 6 Dallas, TX | 2.0 | 2.0 | 1013 | $1,625 | $1.60 | 16d | 1 | 1.07mi |
| 2822 McDermott Ave Dallas, TX | 3.0 | 2.0 | 1200 | $1,795 | $1.50 | 26d | 1 | 1.08mi |
| 2020 S Ervay St Dallas, TX | 2.0 | 1.0–2.0 | 821 | $2,325 | $2.83 | 1d | 56 | 1.09mi |
| 2016 S Ervay St Unit B1 Dallas, TX | 2.0 | 2.0 | 1102 | $2,225 | $2.02 | 45d | 1 | 1.10mi |
| 2847 Metropolitan Ave Dallas, TX | 3.0 | 1.0 | 1344 | $2,050 | $1.53 | 23d | 1 | 1.12mi |
| 215 Corinth St Dallas, TX | 2.0 | 1.0–2.0 | 772 | $1,518 | $1.97 | 26d | 74 | 1.12mi |
| 2080 Kelly Ave Unit 109 Dallas, TX | 2.0 | 2.5 | 1164 | $2,595 | $2.23 | 45d | 1 | 1.13mi |
| 1919 S Akard St Dallas, TX | 1.0–2.0 | 1.0–2.0 | 965 | $2,054 | $2.13 | 1d | 8 | 1.13mi |
| 2561 Elsie Faye Heggins St Dallas, TX | 3.0 | 2.0 | 876 | $1,390 | $1.59 | 8d | 1 | 1.14mi |
| 2563 Elsie Faye Heggins St Dallas, TX | 3.0 | 2.0 | 876 | $1,240 | $1.42 | 17d | 1 | 1.14mi |
| 2603 Elsie Faye Heggins St Dallas, TX | 3.0 | 2.0 | 876 | $1,385 | $1.58 | 45d | 1 | 1.15mi |
| 2615 Elsie Faye Heggins St Dallas, TX | 3.0 | 2.0 | 876 | $1,280 | $1.46 | 17d | 1 | 1.16mi |
| 2627 Elsie Faye Heggins St Dallas, TX | 3.0 | 2.0 | 876 | $1,280 | $1.46 | 45d | 1 | 1.17mi |
| 2218 Rockefeller Blvd Dallas, TX | 3.0 | 1.0 | 1028 | $1,750 | $1.70 | 1d | 1 | 1.17mi |
| 1900 S Ervay St Dallas, TX | 2.0 | 3.0 | 1302 | $3,700 | $2.84 | 45d | 1 | 1.17mi |
| 801 Avenue I Unit 1-205 Dallas, TX | 2.0 | 2.0 | 1185 | $2,099 | $1.77 | 4d | 1 | 1.19mi |
| 1812 Hickory St Dallas, TX | 1.0–2.0 | 1.0–2.0 | 825 | $2,261 | $2.74 | 45d | 19 | 1.21mi |
| 1704 Gould St Dallas, TX | 2.0 | 1.0 | 1000 | $1,800 | $1.80 | 45d | 1 | 1.26mi |
| 2246 Hooper St Dallas, TX | 3.0 | 3.0 | 1870 | $2,400 | $1.28 | 45d | 1 | 1.29mi |
| 2207 Anderson St Dallas, TX | 3.0 | 2.5 | 1419 | $2,300 | $1.62 | 9d | 1 | 1.30mi |
Listing history 17 events
-
2026-06-21days on market $149,900 Active 57 DOM
-
2026-06-18days on market $149,900 Active 54 DOM
-
2026-06-17days on market $149,900 Active 53 DOM
-
2026-06-16days on market $149,900 Active 52 DOM
-
2026-06-15days on market $149,900 Active 51 DOM
-
2026-06-13days on market $149,900 Active 49 DOM
-
2026-06-09days on market $149,900 Active 45 DOM
-
2026-06-08days on market $149,900 Active 44 DOM
-
2026-06-07days on market $149,900 Active 43 DOM
-
2026-06-04days on market $149,900 Active 40 DOM
-
2026-06-03days on market $149,900 Active 39 DOM
-
2026-06-02days on market $149,900 Active 38 DOM
-
2026-06-01days on market $149,900 Active 37 DOM
-
2026-05-31days on market $149,900 Active 36 DOM
-
2026-05-13status Active 525-char remark
-
2026-05-01historical Active Option Contract 525-char remark
-
2026-04-24$149,900 Active 525-char remark
ⓘ Source: listings_history table (triggers on properties + properties_extension) + one-shot
backfill from property_details.listing_events for pre-trigger history.
Tax reassessment forecast TX · Resets to sale price
- Current annual tax
- $1,988 · $166/mo
- Projected year-2 tax
- $2,743 · $229/mo
- Expected delta
- +$755/yr (+$63/mo · 38.0%)
ⓘ Screening estimate from a state-policy table — verify with the county assessor before closing.
Climate risk First Street
- Flood 3/10 Moderate FEMA zone X (shaded) · 14% chance over 30 yrs
- Wildfire 2/10 Low
- Heat 7/10 Severe 7 d/yr ≥109°F today · 24 d/yr by 30 yrs out
- Wind 6/10 Major 27% chance of damaging wind over 30 yrs
- Air quality 3/10 Moderate 2 unhealthy d/yr today · 3 by 30 yrs out
Nearby sold comps map
Loading sold comps map…
Walkable amenities ~0.75 mi
Loading nearby amenities…
Taxation est. · year 1
- Rental income
- $25,884
- − Mortgage interest
- −$8,397
- − Property taxes
- −$1,988
- − Insurance
- −$750
- − Repairs & maintenance
- −$2,071
- − Management
- −$2,071
- − Depreciation
- −$4,361
- Taxable income
- $6,248
- Est. tax owed @ 24.0%
- −$1,499
- After-tax cash flow
- $6,778/yr
For passive investors: Depreciation is non-cash, so a rental often shows a tax loss while cash-flowing — sheltering income. Rental losses are passive: they offset passive income freely, and up to $25,000/yr can offset ordinary (W-2) income if you actively participate and your MAGI is under $100k (phasing out to $0 by $150k); unused losses carry forward. On sale, claimed depreciation is recaptured at up to 25%, and gains may owe capital-gains tax (a 1031 exchange can defer both). Figures are a year-1 estimate at your 24.0% rate — not tax advice; consult a CPA.
Schools (NCES district)
- District
- Dallas ISD
- NCES district ID
- 4816230
- Math proficiency
- 31% ▼ -16.00%
- Reading proficiency
- 36% ▼ -4.00%
- Median HH income
- $42,881
- Composite
- 28.41/100
- National rank
- #6763
- State rank
- #559 of 826 in TX
Livability — Dallas
- Score
- 81/100
- State rank
- #24
- US rank
- #1380
Category grades
Schools grade is shown separately in the Schools card above.
Census & demographics
- Census place
- Dallas, TX
- County
- Dallas County · 2,612,404 people
- City population
- 1,168,437
- Metro
- Dallas-Fort Worth-Arlington, TX
- Population (ZIP)
- 18,895
- Household income
- $45,557
- Rent vs Own
- Severe rent burden
- 1464.0
Population outlook (Dallas County) Hauer SSP2
- Today (2025)
- 2,979,839 people
- By 2030
- 3,191,823 · +7.1%
- By 2040
- 3,619,611 · +21.5%
- By 2050
- 4,026,915 · +35.1%
- By 2075
- 4,957,073 · +66.4%
- By 2100
- 5,508,725 · +84.9%
Race, ethnicity, and origin ACS 2023
- Neighborhood character
- Diverse neighborhood (Simpson 0.58)
- Race & ethnicity
- Black 59% Hispanic / Latino 25% White 11% Two or more races 10%
- Hispanic origin (detail)
- Mexican 21%
- Common ancestry
- Italian 1% Hispanic 1%
- Foreign-born
- 16% · Canada
- Languages at home
- 74% English-only · Spanish 26%
Political lean MEDSL · Dallas
- 2024 margin
- Strong D (+22.2) · D 60.2% · R 38.0% · Other 1.8%
- 2008→2024 swing
- +6.9pp toward D · 2008: 15.3pp · 2024: 22.2pp
- All cycles
- 2024: D+22.2 2020: D+31.6 2016: D+26.2 2012: D+15.4 2008: D+15.3
Not yet ingested
- Civics
- —
Market trends
- HPI YoY
- ▲ 0.79%
- Current HPI
- 224.2955
- Rent YoY
- ▲ 7.19%
- Metro
- Dallas-Fort Worth-Arlington, TX
- State GDP YoY
- ▲ 3.95%
- F500 in state
- 110
Industry mix (Fortune 500 HQ in TX)
| Industry | F500 HQs | Revenue |
|---|---|---|
| Energy | 16 | $1,198B |
|
||
| Technology | 5 | $198B |
|
||
| Engineering / Construction | 4 | $72B |
|
||
| Energy Services | 3 | $60B |
|
||
| Utilities | 3 | $41B |
|
||
| Healthcare | 2 | $330B |
|
||
Price history
3 events — show timeline
- 2026-05-13 Relisted — NTREIS
- 2026-05-01 Contingent — NTREIS
- 2026-04-24 Listed $149,900 NTREIS
Property tax history
+8.3%/yrLatest (2025): $1,988 · +22.8% YoY. Source: county tax records.
Cash-flow waterfall
monthlySold comps — $/sqft
last 12 mo · ≤1 miLoading sold comps…