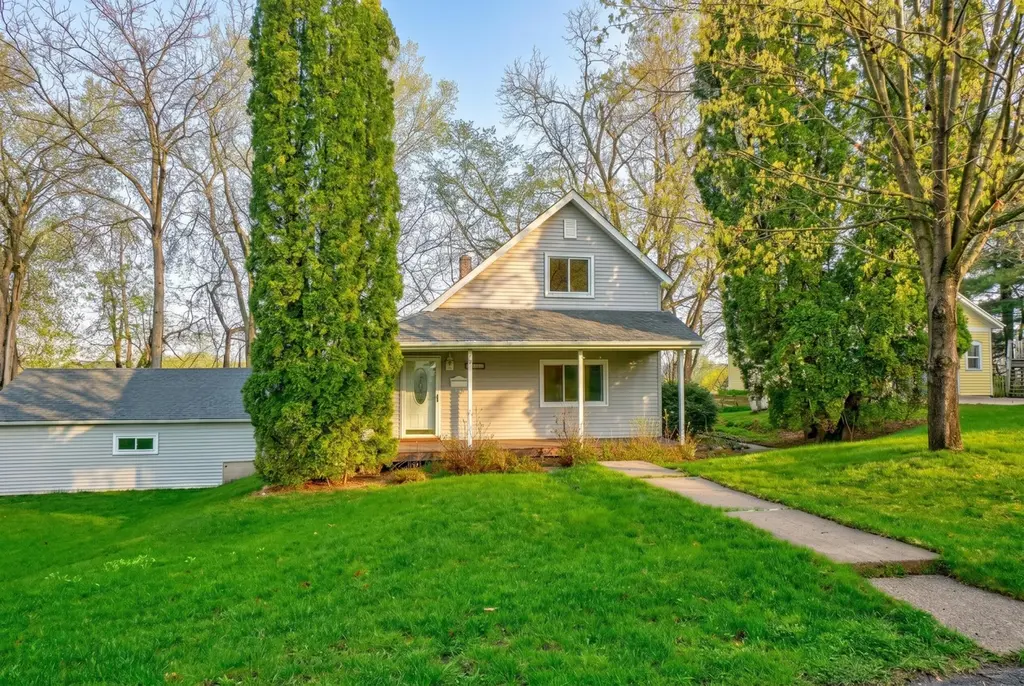
1211 3rd St N · Stillwater, MN
Flood risk 1/10 · Minimal
- FEMA flood zone
- X (unshaded)
- Chance of flooding over 30 yrs
- 0.0%
- Est. flood insurance / yr
- $473 – $860
Fire risk 2/10 · Minimal
- Est. fire insurance / yr
- $888 – $1,650
Heat risk 2/10 · Minimal
- Hot days now (above 100°F)
- 7 days/yr
- Hot days in 30 yrs
- 14 days/yr
Wind risk 2/10 · Minimal
- Chance of severe wind over 30 yrs
- —
Air-quality risk 3/10 · Minor
- Unhealthy air days now
- 2 days/yr
- Unhealthy air days in 30 yrs
- 3 days/yr
Risk factors via First Street. Map © Google.
Why this score? — see what drove the D+ grade
The composite is a weighted blend of 9 inputs, each scored 0–100. Each bar is that input's sub-score; the figure is the points it added to the 100-point composite (weight × sub-score).
- ARV discount +15.0/15.0
- Cash flow +11.7/30.0
- Schools +5.0/10.0
- Livability +4.2/5.0
- DSCR +3.4/10.0
- Rent growth +3.3/5.0
- 1% rule +2.8/10.0
- Condition / age +2.5/5.0
- Appreciation +0.0/10.0
$375,000
🖨 Deal sheet (PDF) 📄 Offer letter ✓ Due diligence
Listing remarks
Spacious hard to find affordable home located on Stillwaters North Hill. Fantastic corner lot on a quiet street with an oversized two car garage. This home offers a functional floor plan with 3 bedrooms, 2 bathrooms, finished lower level family room and additional flex space.
Key facts
- 0.27 acre lot
- 2 garage spots
- Built 1908
Property features AI
Exterior
- Parking: Asphalt parking; 2-car garage with automatic door opener (garage approx. 28x24)
- Utilities: City water (connected); City sewer (connected); Natural gas; Electric with circuit breakers
- Home design: Residential property; One and one-half levels; Above-grade finished area and total living area included; Above and below grade finished living space
- Construction: Block and frame construction; Block foundation; Pitched roof (over 8 years old)
- Exterior features: Vinyl exterior; Deck and porch; Corner lot; City/paved streets with public maintenance
Interior
- Kitchen: Kitchen with center island; Kitchen window; Dishwasher; Range; Microwave; Refrigerator
- Bedrooms: 3 bedrooms (one on the main floor); Bedroom (main): 10x14; Bedroom 2 (upper): 15x9; Bedroom 3 (upper): 12x9
- Flooring: Tile floors
- Bathrooms: Main floor full bathroom; 3/4 bathroom in basement
- Heating & cooling: Forced air heating; Central air conditioning
- Interior features: Ceiling fan(s); Skylight; Tile floors; Living/Dining room
- Laundry & utility: Washer and dryer (hookup); Washer; Dryer; Laundry in basement
Neighborhood map
What this means for you Summary
Snapshot
- This is a 3-bed/1.0-bath single-family listed at $375k.
Deal economics
- At list price, monthly cash flow is $-111 ($-1k/yr) — negative.
- To cash-flow at today's rent, offer at most $355k (5.2% below list).
- To meet the 1% rule (rent ≥ 1% of price), the offer needs to be $294k (21.7% below list).
- Recommended offer: $294k (21.7% below list) — sets the bar for 1% rule.
- Cap rate 5.9% vs local median 3.4% in Stillwater — top-decile yield for the area; either an underpriced asset or a hidden risk that comps aren't pricing in. Stress-test before assuming the spread holds.
Location & tenants
- Location reads 85/100 on livability (#19 in MN, #547 nationally) — a professional / high-income tenant draw. Strengths: crime A+, commute A+, employment A+; Watch: cost of living D+, amenities F.
- Stillwater Area Public School District (suburban): math 53% / reading 56% proficiency, ranked #54 of 301 in MN (top 18%) — acceptable for families but not a draw, mixed tenant base, ~2y average lease; only 12% free/reduced lunch — higher-income household profile.
- Zoned schools: Stonebridge Elementary (math 52% / reading 57%, grade C, #320 of 857 statewide, top 41%, 421 students, 17% FRL); Stillwater Middle School (math 54% / reading 60%, grade B, #36 of 258 statewide, top 14%, 906 students, 20% FRL); Stillwater Area High School (math 57% / reading 66%, grade B-, #39 of 471 statewide, top 9%, 2,647 students, 20% FRL).
- Market conditions: Rents rising (+3.0%/yr); 191 active listings in the ZIP; 2 comparable units currently listed for rent nearby; high-income renter base; 1,405 units permitted in Washington County in 2024 (121 in 5+ unit buildings).
- This rent runs 31% of the median local income ($115k/yr) — at the standard rent-burdened threshold; future hikes will face affordability resistance.
Forward outlook
- Local home prices are declining (-3.0%/yr); year-one equity from $3k of loan paydown is wiped out by about $11k of value loss. Plan a longer hold.
- Washington County population projected at +16% by 2050 — long-run rental-demand tailwind backs the buy-and-hold thesis.
Negotiation context
- Only 3 days on market — expect competitive offers; lowballing is unlikely to land.
Risks & watch-outs
- Watch-outs: built in 1908 — expect roof / HVAC / electrical / plumbing capex.
Questions for the listing agent
- What do current leases actually rent for vs. the listed asking? Can we see a recent rent roll and the last 12 months of T-12 income?
- Built in 1908 — when were the roof, HVAC, electrical panel, plumbing, and water heater last replaced?
- Is there a deadline driving the sale (1031 exchange, divorce, estate, relocation)? That informs how much negotiation room exists.
- Schools are A-rated — typically a magnet for longer-tenancy family renters. What's the average tenant stay here, and is there a school-zone premium baked into asking?
- The area grade is low — what's the realistic commute time and amenity access for the typical tenant pool here? Any planned neighborhood developments (good or bad) we should know about?
- What's the average days-on-market for RENTAL listings here right now (not sales)? A rising rental-DOM trend means longer vacancies and softer asking-rent achievability than the comps imply.
- What's the recent tenant-quality profile in this submarket — average credit score on applications, eviction rate, late-payment / NSF rate, and stable-employment percentage? A property-management company in the area should have these aggregated.
- How much new for-sale + rental construction is in the pipeline within 1–3 miles? Heavy new supply typically softens prices + rents 12–24 months out; constrained supply supports both.
Investment metrics
- 1% rule
- 0.78% ✗
- Cap rate
- 5.94%
- Cash-on-cash
- -1.27%
- DSCR
- 0.94
- GRM
- 10.6
CMA / ARV
- ARV (median comp)
- $583,734
- List price
- $375,000
- Delta
- -35.76%
- Verdict
- UNDERPRICED
- Comps
- 4 within 1.0 mi
Show comp detail 1 sale within ~0.75 mi
| Address | Dist | Beds/Ba | Sqft | Sold | Price | $/sf | Match |
|---|---|---|---|---|---|---|---|
| 318 Stillwater Ave W | 0.19mi | 2/1.0 (-1) | 1,266 (+9%) | 20mo | $400,000 | $316 | 54 |
Match score weights: distance 35% · size 25% · config 20% · recency 20%. Top-matched comps best support the ARV.
Projected returns pro-forma
-3.0% appreciation · 3.04% rent growth · sell at horizon
- IRR
- -18.4%
- Equity multiple
- 0.35×
- Total profit
- $-67,769
- Equity at exit
- $55,914
- IRR
- -10.7%
- Equity multiple
- 0.35×
- Total profit
- $-67,848
- Equity at exit
- $32,423
Cash invested: $105,000 (down + closing). Projections, not guarantees.
Landlord ↔ Tenant lean methodology
- Overall (STATE)
- 46 Balanced
- State Minnesota
- 46 Balanced · D+2
- County
- — inherits STATE
- City
- — inherits STATE
ZIP-level market 55082
- Rents YoY
- 3.0%
- Active inventory
- 191
- Price-to-rent
- 10.6×
Monthly cashflow live
- Estimated rent
- $2,935 medium interval (Pro) →
- Mortgage (P&I)
- −$1,967
- Tax from tax record
- −$307 /mo · $3,686/yr
- Insurance
- −$156
- HOA
- −$0
- Lot rent
- −$0
- Vacancy / Maint / Mgmt
- −$616
- Net cashflow
- $-111
Break-even live
Sensitivity live
| Price | -10% $101 | -5% $-5 | +0% $-111 | +5% $-217 | +10% $-323 |
|---|---|---|---|---|---|
| Rent | -10% $-343 | -5% $-227 | +0% $-111 | +5% $5 | +10% $121 |
| Rate | -1.0pp $78 | -0.5pp $-16 | base $-111 | +0.5pp $-208 | +1.0pp $-307 |
UW: 25.0% down · 7.5% · 30yr · 1.5% tax · 5.0% vac · 8.0% maint · 8.0% mgmt
Financing live
Cash to close
- Down payment
- $93,750
- Closing costs
- $11,250
- Reserves months
- —
- Total cash needed
- —
Loan-product check · same deal, 3 products live
Conventional
25% down · 7.5% · 30yr
- Down + closing
- —
- Monthly P&I
- —
- Monthly cashflow
- —
- DSCR
- —
- Eligible?
- —
Personal DTI + credit; lowest rate.
DSCR
20% down · 8.5% · 30yr
- Down + closing
- —
- Monthly P&I
- —
- Monthly cashflow
- —
- DSCR
- —
- Eligible?
- —
No personal income docs; deal must DSCR.
Hard money
10% down · 12.0% · 12mo
- Down + closing
- —
- Monthly P&I
- —
- Monthly cashflow
- —
- DSCR
- —
- Eligible?
- —
Short-term bridge; refi at stabilization.
Rent comps 2 comps
| Address | Beds | Baths | Sqft | Rent | $/sqft | DOM | Units | Dist |
|---|---|---|---|---|---|---|---|---|
| 1512 1st St N Stillwater, MN | 3.0 | 2.0 | 1500 | $3,600 | $2.40 | 5d | 1 | 0.19mi |
| 119 Pine St E #2 Stillwater, MN | 2.0 | 1.0 | 1000 | $1,500 | $1.50 | 22d | 1 | 1.05mi |
Listing history 5 events
-
2026-05-02status Pending 278-char remark
-
2026-04-29$375,000 Active 278-char remark
-
2015-02-20soldstatus $200,000
-
1991-07-01soldstatus $83,900
-
1988-07-01soldstatus $76,500
ⓘ Source: listings_history table (triggers on properties + properties_extension) + one-shot
backfill from property_details.listing_events for pre-trigger history.
Tax reassessment forecast MN · Partial reset (capped growth)
- Current annual tax
- $3,686 · $307/mo
- Projected year-2 tax
- $3,943 · $329/mo
- Expected delta
- +$257/yr (+$21/mo · 7.0%)
ⓘ Screening estimate from a state-policy table — verify with the county assessor before closing.
Climate risk First Street
- Flood 1/10 Low FEMA zone X (unshaded) · 0% chance over 30 yrs
- Wildfire 2/10 Low
- Heat 2/10 Low 7 d/yr ≥100°F today · 14 d/yr by 30 yrs out
- Wind 2/10 Low
- Air quality 3/10 Moderate 2 unhealthy d/yr today · 3 by 30 yrs out
Nearby sold comps map
Loading sold comps map…
Walkable amenities ~0.75 mi
Loading nearby amenities…
Taxation est. · year 1
- Rental income
- $35,226
- − Mortgage interest
- −$21,006
- − Property taxes
- −$3,686
- − Insurance
- −$1,875
- − Repairs & maintenance
- −$2,818
- − Management
- −$2,818
- − Depreciation
- −$10,909
- Taxable loss
- −$7,886
- Est. tax savings @ 24.0%
- +$1,893
- After-tax cash flow
- $561/yr
For passive investors: Depreciation is non-cash, so a rental often shows a tax loss while cash-flowing — sheltering income. Rental losses are passive: they offset passive income freely, and up to $25,000/yr can offset ordinary (W-2) income if you actively participate and your MAGI is under $100k (phasing out to $0 by $150k); unused losses carry forward. On sale, claimed depreciation is recaptured at up to 25%, and gains may owe capital-gains tax (a 1031 exchange can defer both). Figures are a year-1 estimate at your 24.0% rate — not tax advice; consult a CPA.
Schools (NCES district)
- District
- Stillwater Area Public School District
- NCES district ID
- 2738190
- Math proficiency
- 53% ▼ -11.00%
- Reading proficiency
- 56% ▼ -12.00%
- Median HH income
- $84,438
- Composite
- 49.8/100
- National rank
- #1954
- State rank
- #54 of 301 in MN
Livability — Stillwater
- Score
- 85/100
- State rank
- #19
- US rank
- #547
Category grades
Schools grade is shown separately in the Schools card above.
Census & demographics
- Census place
- Stillwater, MN
- County
- Washington County · 235,613 people
- City population
- 36,277
- Metro
- Minneapolis-St. Paul-Bloomington, MN-WI
- Population (ZIP)
- 36,277
- Household income
- $115,040
- Rent vs Own
- Severe rent burden
- 723.0
Population outlook (Washington County) Hauer SSP2
- Today (2025)
- 278,554 people
- By 2030
- 290,465 · +4.3%
- By 2040
- 310,014 · +11.3%
- By 2050
- 324,118 · +16.4%
- By 2075
- 362,697 · +30.2%
- By 2100
- 381,491 · +37.0%
Race, ethnicity, and origin ACS 2023
- Neighborhood character
- Predominantly White (87%)
- Race & ethnicity
- White 87% Hispanic / Latino 5% Two or more races 4% Asian 2% Black 2%
- Hispanic origin (detail)
- Mexican 3%
- Common ancestry
- Portuguese 12% Lithuanian 4% Romanian 4%
- Foreign-born
- 4% · Canada, China
- Languages at home
- 94% English-only · Spanish 3% Chinese 1%
Political lean MEDSL · Washington
- 2024 margin
- Lean D (+8.9) · D 53.5% · R 44.6% · Other 1.9%
- 2008→2024 swing
- +4.6pp toward D · 2008: 4.3pp · 2024: 8.9pp
- All cycles
- 2024: D+8.9 2020: D+9.2 2016: D+1.9 2012: D+0.8 2008: D+4.3
Not yet ingested
- Civics
- —
Market trends
- HPI YoY
- ▼ -395.99%
- Current HPI
- 241.3998
- Rent YoY
- ▲ 3.04%
- Metro
- Minneapolis-St. Paul-Bloomington, MN-WI
- State GDP YoY
- ▲ 2.41%
- F500 in state
- 34
Industry mix (Fortune 500 HQ in MN)
| Industry | F500 HQs | Revenue |
|---|---|---|
| Healthcare | 2 | $407B |
|
||
| Retail | 2 | $150B |
|
||
| Consumer Goods | 2 | $32B |
|
||
| Industrial Machinery | 2 | $6B |
|
||
| Agriculture | 1 | $40B |
|
||
| Healthcare / Medical Devices | 1 | $32B |
|
||
Price history
+403.3% since first listed6 events — show timeline
- 2026-06-05 Sold (MLS) $385,000 NORTHSTARMLS as Distributed by MLS Grid
- 2026-05-02 Pending — NORTHSTARMLS as Distributed by MLS Grid
- 2026-04-29 Listed $375,000 NORTHSTARMLS as Distributed by MLS Grid
- 2015-02-20 Sold (Public Records) $200,000 Public Records
- 1991-07-01 Sold (Public Records) $83,900 Public Records
- 1988-07-01 Sold (Public Records) $76,500 Public Records
Property tax history
+4.9%/yrLatest (2025): $3,686 · +3.8% YoY. Source: county tax records.
Cash-flow waterfall
monthlySold comps — $/sqft
last 12 mo · ≤1 miLoading sold comps…