 Duplex
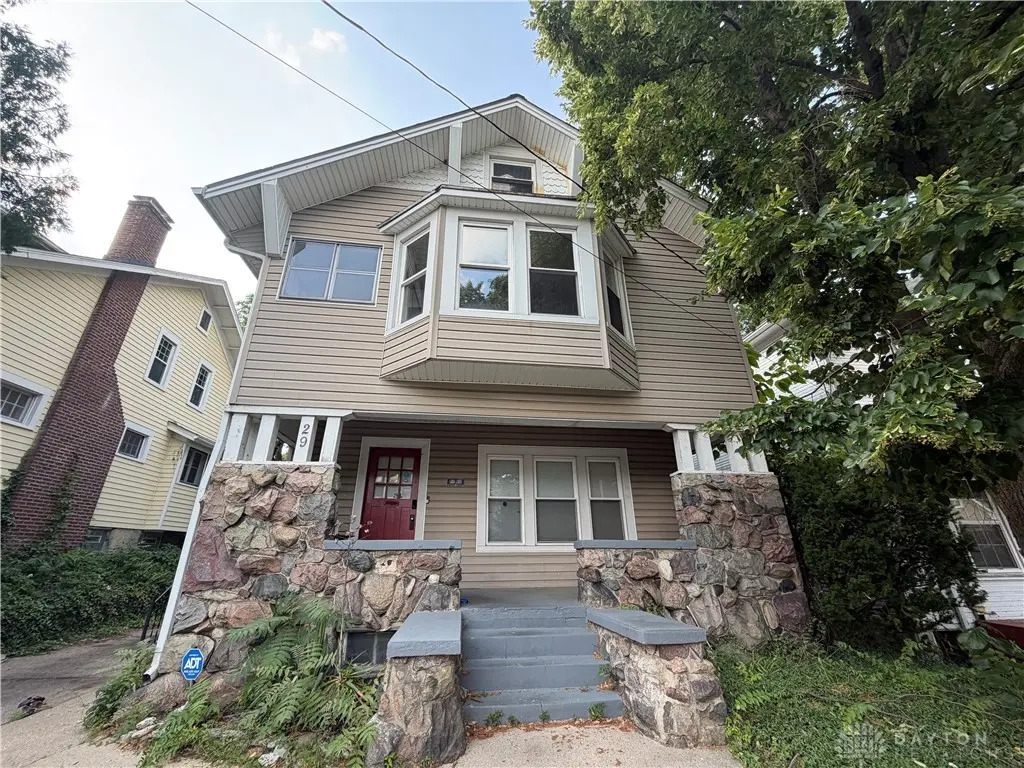
29 Laura Ave · Dayton, OH
Flood risk 3/10 · Minor
- FEMA flood zone
- X (unshaded)
- Chance of flooding over 30 yrs
- 0.2%
- Est. flood insurance / yr
- $473 – $860
Fire risk 1/10 · Minimal
- Est. fire insurance / yr
- $713 – $1,323
Heat risk 3/10 · Minor
- Hot days now (above 104°F)
- 7 days/yr
- Hot days in 30 yrs
- 18 days/yr
Wind risk 2/10 · Minimal
- Chance of severe wind over 30 yrs
- 0.0%
Air-quality risk 3/10 · Minor
- Unhealthy air days now
- 2 days/yr
- Unhealthy air days in 30 yrs
- 4 days/yr
Risk factors via First Street. Map © Google.
Why this score? — see what drove the B+ grade
The composite is a weighted blend of 9 inputs, each scored 0–100. Each bar is that input's sub-score; the figure is the points it added to the 100-point composite (weight × sub-score).
- Cash flow +30.0/30.0
- ARV discount +15.0/15.0
- 1% rule +10.0/10.0
- DSCR +10.0/10.0
- Rent growth +3.6/5.0
- Livability +3.2/5.0
- Condition / age +2.5/5.0
- Schools +1.3/10.0
- Appreciation +0.0/10.0
$69,900
🖨 Deal sheet (PDF) 📄 Offer letter ✓ Due diligence
Multi-family units
County records classify this as Multi-Family (2-4 Unit). Listing-text estimate: 2 units. confirmed
Listing remarks MLS
This upstairs/downstairs duplex would make an excellent addition to an investor's portfolio. The lower unit is a 1 bedroom, 1 bathroom unit, with access to the full basement and washer/dryer hook ups. The upstairs unit is a 2 bed, 1 bath unit, with the second bedroom being an attic bedroom walk up. Owner pays all utilities, as utilities are not metered separately. There is one furnace, water heater, and electric box for the property. Lower unit is rented for $675, upper unit is rented for $650.
Key facts
- 3,106 sq ft lot
- Garage
- Built 1915
Property features AI
Finance
- Financial info: Offered for sale
Exterior
- Parking: Driveway; On-street parking; One-car garage
- Utilities: Public water; Public sewer; Natural gas available
- Home design: Two-story building; Single building with 2 residential units
- Construction: Stone and vinyl siding exterior
- Exterior features: Residential zoning; Lot approximately 0.0713 acres
Interior
- Bedrooms: One-bedroom unit; Two-bedroom unit
- Bathrooms: Two full bathrooms (total for property)
- Heating & cooling: Forced air heating (natural gas); Wall cooling units
- Interior features: Finished full basement
Neighborhood map
What this means for you Summary
Snapshot
- This is a 1×1bd/1.0ba + 1×2bd/1.0ba units multifamily listed at $70k.
Deal economics
- At list price, monthly cash flow is $869 ($10k/yr) — positive. Per door: $434/mo.
- The deal already cash-flows at list — no discount required.
- Meets the 1% rule at list price ($2k rent vs $70k).
- Cap rate 21.2% vs local median 7.3% in Dayton — top-decile yield for the area; either an underpriced asset or a hidden risk that comps aren't pricing in. Stress-test before assuming the spread holds.
Location & tenants
- Location reads 65/100 on livability (#716 in OH) — a middle-class / working-renter tenant base. Strengths: cost of living A+, housing A+, health & safety A; Watch: amenities C-, crime F, commute F.
- Dayton City (urban): math 12% / reading 21% proficiency, ranked #641 of 656 in OH (top 98%) — low school quality limits family demand, transient renter base, plan for 1-2y turnover; 74% free/reduced lunch — lower-income household profile, screen leases tightly.
- Zoned schools: River'S Edge Montessori Elementary School (math 22% / reading 32%, grade F, #1,193 of 1,584 statewide, top 76%, 494 students, 0% FRL); Belmont High School (math 5% / reading 20%, grade F, #720 of 781 statewide, top 93%, 1,100 students, 0% FRL) — zoned schools average 0% FRL vs 74% district-wide (74 pts lower); this property's tenant base skews higher-income than the district average.
- Market conditions: Rents rising fast (+4.3%/yr); 136 active listings in the ZIP; 36 comparable units currently listed for rent nearby; rentals lingering (median 45d on market — plan ~5-8 weeks vacancy on turnover, expect pricing pressure); 58% of comp listings sitting > 30 days — soft ceiling on asking rent; lower-income renter base — watch delinquency; 907 units permitted in Montgomery County in 2024 (416 in 5+ unit buildings).
- At $1,706/mo this rent would consume 47% of the median local household income ($44k/yr) (locally 1475% of renters already pay >50% of income on rent) — very limited rent-growth headroom before tenants either downsize or default.
Forward outlook
- Local home prices are declining (-3.0%/yr); year-one equity from $483 of loan paydown is wiped out by about $2k of value loss. Plan a longer hold.
- Montgomery County population projected at -10% by 2050 — secular population decline; favor cash flow + early exit over multi-decade hold.
- At projected returns (-3.0% appreciation + 4.3% rent growth), your $20k cash investment doubles in ~3 years — after that, you're playing with house money.
Negotiation context
- Only 10 days on market — expect competitive offers; lowballing is unlikely to land.
- 11 sale attempts since 11y ago; this cycle's ask has dropped $5k (7%) from the opening price — seller is motivated, your offer sets the floor, not the list.
Risks & watch-outs
- Watch-outs: built in 1915 — expect roof / HVAC / electrical / plumbing capex.
Questions for the listing agent
- Can we see the unit-by-unit rent roll, current vacancy, and any below-market leases? What's the average tenancy length?
- What capital expenditures (roof, boiler, parking lot, exteriors) have been made in the last 5 years, and what's planned in the next 2?
- Built in 1915 — when were the roof, HVAC, electrical panel, plumbing, and water heater last replaced?
- Is there a deadline driving the sale (1031 exchange, divorce, estate, relocation)? That informs how much negotiation room exists.
- Crime grade is F in this area — have there been break-ins, vandalism, or insurance claims at this property in the last 3 years? What carrier currently insures it and at what premium?
- What's the average days-on-market for RENTAL listings here right now (not sales)? A rising rental-DOM trend means longer vacancies and softer asking-rent achievability than the comps imply.
- What's the recent tenant-quality profile in this submarket — average credit score on applications, eviction rate, late-payment / NSF rate, and stable-employment percentage? A property-management company in the area should have these aggregated.
- How much new apartment / multifamily construction is in the pipeline within 1–3 miles? Heavy new supply (>2% of stock underway) typically softens rents 12–24 months out; light construction supports rent growth.
Investment metrics
- 1% rule
- 2.44% ✓
- Cap rate
- 21.21%
- Cash-on-cash
- 53.27%
- DSCR
- 3.37
- GRM
- 3.4
CMA / ARV
- ARV (on-the-fly)
- $116,116
- Comps found
- 3
Show comp detail 3 sales within ~0.75 mi
| Address | Dist | Beds/Ba | Sqft | Sold | Price | $/sf | Match |
|---|---|---|---|---|---|---|---|
| 221 Odlin Ave | 0.65mi | 4/— | 1,552 (+3%) | 13mo | $33,220 | $21 | 54 |
| 3417 Riverside Dr #3415 | 0.67mi | 4/2.0 | 1,488 (-1%) | 19mo | $120,000 | $81 | 51 |
| 3505-3507 Theodore Ave | 0.63mi | 4/2.0 | 1,696 (+12%) | 20mo | $129,900 | $77 | 33 |
Match score weights: distance 35% · size 25% · config 20% · recency 20%. Top-matched comps best support the ARV.
Projected returns pro-forma
-3.0% appreciation · 4.34% rent growth · sell at horizon
- IRR
- 52.9%
- Equity multiple
- 3.37×
- Total profit
- $46,368
- Equity at exit
- $10,422
- IRR
- 58.6%
- Equity multiple
- 7.21×
- Total profit
- $121,560
- Equity at exit
- $6,044
Cash invested: $19,572 (down + closing). Projections, not guarantees.
Landlord ↔ Tenant lean methodology
- Overall (STATE)
- 73 Landlord-Friendly
- State Ohio
- 73 Landlord-Friendly · R+6
- County
- — inherits STATE
- City
- — inherits STATE
ZIP-level market 45405
- Rents YoY
- 4.3%
- Active inventory
- 136
- Price-to-rent
- 7.0×
Monthly cashflow live
- Estimated rent
- $1,706 high interval (Pro) →
- Mortgage (P&I)
- −$367
- Tax from tax record
- −$83 /mo · $998/yr
- Insurance
- −$29
- HOA
- −$0
- Vacancy / Maint / Mgmt
- −$358
- Net cashflow
- $869
Break-even live
Sensitivity live
| Price | -10% $908 | -5% $889 | +0% $869 | +5% $849 | +10% $829 |
|---|---|---|---|---|---|
| Rent | -10% $734 | -5% $802 | +0% $869 | +5% $936 | +10% $1,004 |
| Rate | -1.0pp $904 | -0.5pp $887 | base $869 | +0.5pp $851 | +1.0pp $832 |
2-unit breakdown (identical units grouped — click to expand)
| Units | Beds | Baths | Est. rent |
|---|---|---|---|
| 1× unit | 1 | 1 | $830 |
| 1× unit | 2 | 1 | $876 |
| Total (2 units) | $1,706 | ||
UW: 25.0% down · 7.5% · 30yr · 1.5% tax · 5.0% vac · 8.0% maint · 8.0% mgmt
Financing live
Cash to close
- Down payment
- $17,475
- Closing costs
- $2,097
- Reserves months
- —
- Total cash needed
- —
Loan-product check · same deal, 3 products live
Conventional
25% down · 7.5% · 30yr
- Down + closing
- —
- Monthly P&I
- —
- Monthly cashflow
- —
- DSCR
- —
- Eligible?
- —
Personal DTI + credit; lowest rate.
DSCR
20% down · 8.5% · 30yr
- Down + closing
- —
- Monthly P&I
- —
- Monthly cashflow
- —
- DSCR
- —
- Eligible?
- —
No personal income docs; deal must DSCR.
Hard money
10% down · 12.0% · 12mo
- Down + closing
- —
- Monthly P&I
- —
- Monthly cashflow
- —
- DSCR
- —
- Eligible?
- —
Short-term bridge; refi at stabilization.
Rent comps 36 comps
| Address | Beds | Baths | Sqft | Rent | $/sqft | DOM | Units | Dist |
|---|---|---|---|---|---|---|---|---|
| 2327 Eastview Ave Dayton, OH | 5.0 | 1.0 | 1290 | $1,300 | $1.01 | 45d | 1 | 0.17mi |
| 41 W Fairview Ave Unit 2 Dayton, OH | 3.0 | 1.0 | 1452 | $1,200 | $0.83 | 16d | 1 | 0.21mi |
| 26 W Beechwood Ave Dayton, OH | 3.0 | 1.5 | 1468 | $1,050 | $0.72 | 45d | 1 | 0.24mi |
| 31 E Norman Ave Dayton, OH | 3.0 | 1.0 | 1100 | $1,150 | $1.05 | 25d | 1 | 0.25mi |
| 101 W Norman Ave Unit 101 Dayton, OH | 3.0 | 1.0 | 1600 | $945 | $0.59 | 45d | 1 | 0.29mi |
| 39 E Maplewood Ave Dayton, OH | 4.0 | 1.5 | 1560 | $1,050 | $0.67 | 5d | 1 | 0.32mi |
| 42 Pointview Ave Unit 42 Dayton, OH | 3.0 | 2.0 | 1240 | $1,200 | $0.97 | 5d | 1 | 0.36mi |
| 181 W Norman Ave Dayton, OH | 3.0 | 2.0 | 1228 | $1,150 | $0.94 | 45d | 1 | 0.39mi |
| 201 W Norman Ave Dayton, OH | 3.0 | 1.0 | 1424 | $1,200 | $0.84 | 45d | 1 | 0.40mi |
| 167 W Hudson Ave Dayton, OH | 3.0 | 1.5 | 1344 | $1,185 | $0.88 | 45d | 1 | 0.42mi |
| 317 Fernwood Ave Dayton, OH | 3.0 | 1.0 | 1320 | $1,100 | $0.83 | 12d | 1 | 0.46mi |
| 439 W Fairview Ave Dayton, OH | 3.0 | 1.0 | 1500 | $1,200 | $0.80 | 45d | 1 | 0.50mi |
| 234 Santa Clara Ave Dayton, OH | 3.0 | 1.0 | 1368 | $1,125 | $0.82 | 45d | 1 | 0.53mi |
| 101 E Bruce Ave Dayton, OH | 3.0 | 1.0 | 1455 | $1,150 | $0.79 | 4d | 1 | 0.54mi |
| 265 Victor Ave Dayton, OH | 3.0 | 1.0 | 1204 | $900 | $0.75 | 45d | 1 | 0.66mi |
| 1501 Viola Ave Dayton, OH | 3.0 | 1.0 | 1952 | $1,175 | $0.60 | 16d | 1 | 0.80mi |
| 1019 Cherry Dr Dayton, OH | 4.0 | 1.0 | 1057 | $1,125 | $1.06 | 45d | 1 | 0.83mi |
| 338 Kenwood Ave Dayton, OH | 3.0 | 1.5 | 1512 | $1,195 | $0.79 | 45d | 1 | 0.89mi |
| 1743 Radcliffe Rd Dayton, OH | 3.0 | 1.5 | 1729 | $1,200 | $0.69 | 45d | 1 | 0.90mi |
| 2247 Salem Ave Unit 2249 Dayton, OH | 3.0 | 1.5 | 1300 | $1,400 | $1.08 | 45d | 1 | 0.97mi |
| 2247 Salem Ave Unit 2247 Dayton, OH | 3.0 | 1.5 | 1300 | $1,350 | $1.04 | 5d | 1 | 0.97mi |
| 2232 Salem Ave Dayton, OH | 3.0 | 1.0 | 1250 | $1,200 | $0.96 | 5d | 1 | 0.97mi |
| 1225 Amherst Pl Dayton, OH | 3.0 | 1.0 | 1548 | $1,300 | $0.84 | 16d | 1 | 1.02mi |
| 932 Harvard Blvd Dayton, OH | 5.0 | 2.0 | 1986 | $1,500 | $0.76 | 45d | 1 | 1.07mi |
| 942 Harvard Blvd Dayton, OH | 3.0 | 2.0 | 1596 | $1,200 | $0.75 | 5d | 1 | 1.08mi |
| 132 Wroe Ave Unit 132 Dayton, OH | 3.0 | 2.5 | 1934 | $1,297 | $0.67 | 45d | 1 | 1.12mi |
| 138 Rockwood Ave Dayton, OH | 3.0 | 1.5 | 1439 | $1,200 | $0.83 | 25d | 1 | 1.14mi |
| 136 Rockwood Ave Dayton, OH | 3.0 | 1.5 | 1439 | $1,200 | $0.83 | 45d | 1 | 1.14mi |
| 1927 Burroughs Dr Dayton, OH | 3.0 | 2.0 | 1409 | $1,245 | $0.88 | 16d | 1 | 1.16mi |
| 905 Neal Ave Dayton, OH | 3.0 | 1.0 | 1100 | $850 | $0.77 | 45d | 1 | 1.18mi |
| 534 Geyer St Dayton, OH | 4.0 | 1.0 | 1640 | $1,530 | $0.93 | 25d | 1 | 1.19mi |
| 412 Forest Ave Unit 414 Dayton, OH | 3.0 | 1.5 | 1200 | $1,200 | $1.00 | 45d | 1 | 1.26mi |
| 2141 Philadelphia Dr Dayton, OH | 3.0 | 1.0 | 1736 | $1,395 | $0.80 | 45d | 1 | 1.29mi |
| 1108 Rydale Rd Dayton, OH | 3.0 | 1.0 | 1281 | $1,245 | $0.97 | 20d | 1 | 1.41mi |
| 1011 N Broadway St Dayton, OH | 3.0 | 1.5 | 1700 | $950 | $0.56 | 45d | 1 | 1.44mi |
| 424 Lexington Ave Dayton, OH | 3.0 | 2.0 | 1536 | $1,025 | $0.67 | 45d | 1 | 1.49mi |
Listing history 8 events
-
2026-06-22statusdays on market $69,900 ActiveUnderContract 10 DOM
-
2026-06-18days on market $69,900 Active 7 DOM
-
2026-06-17days on market $69,900 Active 6 DOM
-
2026-06-16pricedays on market $69,900 Active 5 DOM
-
2026-06-15days on market $74,900 Active 4 DOM
-
2026-06-14days on market $74,900 Active 2 DOM
-
2026-06-13remarks 699-char remark
-
2026-06-13$74,900 Active 1 DOM
ⓘ Source: listings_history table (triggers on properties + properties_extension) + one-shot
backfill from property_details.listing_events for pre-trigger history.
Tax reassessment forecast OH · Partial reset (capped growth)
- Current annual tax
- $998 · $83/mo
- Projected year-2 tax
- $1,044 · $87/mo
- Expected delta
- +$46/yr (+$4/mo · 4.6%)
ⓘ Screening estimate from a state-policy table — verify with the county assessor before closing.
Climate risk First Street
- Flood 3/10 Moderate FEMA zone X (unshaded) · 20% chance over 30 yrs
- Wildfire 1/10 Low
- Heat 3/10 Moderate 7 d/yr ≥104°F today · 18 d/yr by 30 yrs out
- Wind 2/10 Low 0% chance of damaging wind over 30 yrs
- Air quality 3/10 Moderate 2 unhealthy d/yr today · 4 by 30 yrs out
Nearby sold comps map
Loading sold comps map…
Walkable amenities ~0.75 mi
Loading nearby amenities…
Taxation est. · year 1
- Rental income
- $20,472
- − Mortgage interest
- −$3,915
- − Property taxes
- −$998
- − Insurance
- −$350
- − Repairs & maintenance
- −$1,638
- − Management
- −$1,638
- − Depreciation
- −$2,033
- Taxable income
- $9,900
- Est. tax owed @ 24.0%
- −$2,376
- After-tax cash flow
- $8,051/yr
For passive investors: Depreciation is non-cash, so a rental often shows a tax loss while cash-flowing — sheltering income. Rental losses are passive: they offset passive income freely, and up to $25,000/yr can offset ordinary (W-2) income if you actively participate and your MAGI is under $100k (phasing out to $0 by $150k); unused losses carry forward. On sale, claimed depreciation is recaptured at up to 25%, and gains may owe capital-gains tax (a 1031 exchange can defer both). Figures are a year-1 estimate at your 24.0% rate — not tax advice; consult a CPA.
Schools (NCES district)
- District
- Dayton City
- NCES district ID
- 3904384
- Math proficiency
- 12% ▼ -12.00%
- Reading proficiency
- 21% ▼ -11.00%
- Median HH income
- $28,688
- Composite
- 12.94/100
- National rank
- #9579
- State rank
- #641 of 656 in OH
Livability — Dayton
- Score
- 65/100
- State rank
- #716
- US rank
- #12895
Category grades
Schools grade is shown separately in the Schools card above.
Census & demographics
- Census place
- Dayton, OH
- County
- Montgomery County · 459,541 people
- City population
- 164,387
- Metro
- Dayton-Kettering, OH
- Population (ZIP)
- 18,955
- Household income
- $43,973
- Rent vs Own
- Severe rent burden
- 1475.0
Population outlook (Montgomery County) Hauer SSP2
- Today (2025)
- 523,241 people
- By 2030
- 514,948 · -1.6%
- By 2040
- 493,378 · -5.7%
- By 2050
- 469,639 · -10.2%
- By 2075
- 418,360 · -20.0%
- By 2100
- 353,315 · -32.5%
Race, ethnicity, and origin ACS 2023
- Neighborhood character
- Predominantly Black (68%)
- Race & ethnicity
- Black 68% White 23% Two or more races 7% Hispanic / Latino 3%
- Common ancestry
- Italian 1% Slovak 1%
- Foreign-born
- 3% · Canada
- Languages at home
- 95% English-only · Spanish 2% French/Haitian/Cajun 1%
Political lean MEDSL · Montgomery
- 2024 margin
- Toss-up / Even · D 49.8% · R 49.3%
- 2008→2024 swing
- -5.8pp toward R · 2008: 6.2pp · 2024: 0.5pp
- All cycles
- 2024: D+0.5 2020: D+2.2 2016: R+1.2 2012: D+3.1 2008: D+6.2
Not yet ingested
- Civics
- —
Market trends
- HPI YoY
- ▼ -125.58%
- Current HPI
- 173.4962
- Rent YoY
- ▲ 4.34%
- Metro
- Dayton-Kettering, OH
- State GDP YoY
- ▲ 1.98%
- F500 in state
- 48
Industry mix (Fortune 500 HQ in OH)
| Industry | F500 HQs | Revenue |
|---|---|---|
| Insurance | 3 | $145B |
|
||
| Industrial Machinery | 3 | $49B |
|
||
| Financial Services | 3 | $24B |
|
||
| Consumer Goods | 2 | $93B |
|
||
| Aerospace / Defense | 2 | $47B |
|
||
| Utilities | 2 | $33B |
|
||
Price history
+178.4% since first listed38 events — show timeline
- 2026-06-11 Listed $74,900 Dayton MLS
- 2026-04-20 Relisted — Dayton MLS
- 2026-04-11 Listing Removed — Dayton MLS
- 2026-04-06 Contingent — Dayton MLS
- 2026-03-12 Pending — Dayton MLS
- 2026-03-02 Relisted — Dayton MLS
- 2026-03-02 Price Changed $90,000 Dayton MLS
- 2026-02-03 Contingent — Dayton MLS
- 2026-01-07 Relisted — Dayton MLS
- 2026-01-07 Price Changed $100,000 Dayton MLS
- 2025-12-16 Contingent — Dayton MLS
- 2025-11-19 Price Changed $115,000 Dayton MLS
- 2025-10-11 Listed $125,000 Dayton MLS
- 2021-03-03 Sold (MLS) $61,250 Dayton MLS
- 2021-03-03 Sold (MLS) $61,250 Dayton MLS
- 2021-01-28 Pending — Dayton MLS
- 2021-01-26 Listed $80,000 Dayton MLS
- 2020-07-29 Listing Removed — Dayton MLS
- 2020-06-16 Listed $64,900 Dayton MLS
- 2017-07-10 Listing Removed — Dayton MLS
- 2017-02-27 Sold (Public Records) $35,000 Public Records
- 2017-02-23 Contingent — Dayton MLS
- 2017-01-23 Listed $39,500 Dayton MLS
- 2016-10-27 Listing Removed — Dayton MLS
- 2016-05-02 Listed $42,500 Dayton MLS
- 2016-01-18 Listing Removed — Dayton MLS
- 2015-12-15 Price Changed $29,495 Dayton MLS
- 2015-11-05 Relisted — Dayton MLS
- 2015-10-07 Contingent — Dayton MLS
- 2015-09-29 Pending — Dayton MLS
- 2015-08-25 Contingent — Dayton MLS
- 2015-08-11 Price Changed $29,995 Dayton MLS
- 2015-08-11 Price Changed $27,000 Dayton MLS
- 2015-08-06 Price Changed $30,000 Dayton MLS
- 2015-06-03 Listed $30,500 Dayton MLS
- 1991-06-14 Sold (Public Records) $28,450 Public Records
- 1984-12-20 Sold (Public Records) $26,900 Public Records
- 1984-12-01 Sold (Public Records) $26,900 Public Records
Property tax history
-3.9%/yrLatest (2025): $998 · +2.3% YoY. Source: county tax records.
Cash-flow waterfall
monthlySold comps — $/sqft
last 12 mo · ≤1 miLoading sold comps…