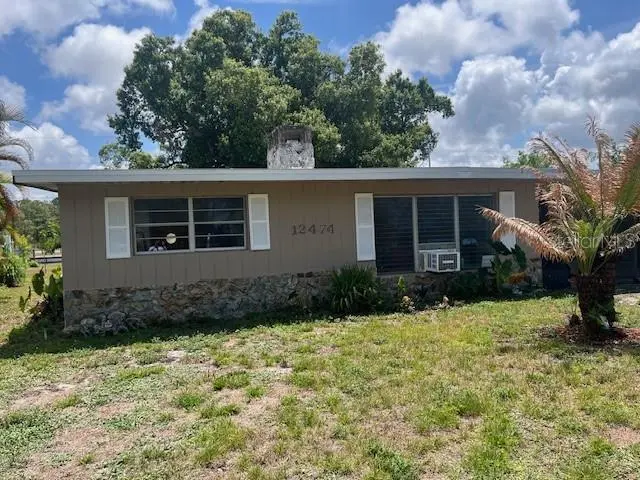
12474 Poem Ave · Punta Gorda, FL
Flood risk 1/10 · Minimal
- FEMA flood zone
- D
- Chance of flooding over 30 yrs
- 0.0%
- Est. flood insurance / yr
- $544 – $1,084
Fire risk 3/10 · Minor
- Est. fire insurance / yr
- $947 – $1,759
Heat risk 9/10 · Severe
- Hot days now (above 108°F)
- 6 days/yr
- Hot days in 30 yrs
- 24 days/yr
Wind risk 10/10 · Severe
- Chance of severe wind over 30 yrs
- 99.0%
Air-quality risk 2/10 · Minimal
- Unhealthy air days now
- 1 days/yr
- Unhealthy air days in 30 yrs
- 2 days/yr
Risk factors via First Street. Map © Google.
Why this score? — see what drove the B grade
The composite is a weighted blend of 9 inputs, each scored 0–100. Each bar is that input's sub-score; the figure is the points it added to the 100-point composite (weight × sub-score).
- Cash flow +30.0/30.0
- 1% rule +10.0/10.0
- DSCR +10.0/10.0
- ARV discount +7.5/15.0
- Schools +4.6/10.0
- Livability +3.8/5.0
- Rent growth +2.5/5.0
- Condition / age +2.5/5.0
- Appreciation +0.0/10.0
$149,000
🖨 Deal sheet (PDF) 📄 Offer letter ✓ Due diligence
Listing remarks
Nestled in the peaceful community of Tropical Gulf Acres, surrounded by native Florida trees and natural beauty, this delightful 4-bedroom plus den, 2-bath home offers comfort and space. Bright and inviting, the home features spacious living areas and a screened front porch. The guest bathroom includes a tub/shower combination, while the primary bathroom features a walk-in shower. Tile flooring runs throughout the home, adding both style and easy maintenance. Recent updates include a newer roof (2024), updated electrical panel (2019), three newer window A/C units with heating capabilities, and newer tile floors. Tucked away in a quiet neighborhood, yet conveniently located near shopping, di
Key facts
- Screened front porch
- Newer roof
- Tile flooring
Tags
Property features AI
Finance
- Other: Property zoned RSF3.5; Approximately 0.19 acres lot (about 753 m²)
- HOA & community: Community amenities include a basketball court and playground
Exterior
- Utilities: Well water; Septic tank; Broadband/high-speed internet available; Cable available; Electricity connected
- Home design: Single-family residence; One story; Faces west
- Construction: Block and stucco construction; Membrane and shingle roof; Block foundation; Built on one level
- Exterior features: Other exterior features; Asphalt road access
Interior
- Kitchen: Cooktop; Electric water heater
- Bedrooms: 3 bedrooms
- Flooring: Linoleum; Tile
- Bathrooms: 1 full bathroom
- Heating & cooling: Ductless heating; Wall/window air-conditioning units
- Interior features: Split-bedroom floor plan; Family room fireplace
- Laundry & utility: Washer hookup; Electric dryer hookup
Neighborhood map
What this means for you Summary
Snapshot
- This is a 3-bed/1.0-bath single-family listed at $149k.
Deal economics
- At list price, monthly cash flow is $808 ($10k/yr) — positive.
- The deal already cash-flows at list — no discount required.
- Meets the 1% rule at list price ($2k rent vs $149k).
- Recommended offer: $147k (1.5% below list) — sets the bar for market timing.
- Cap rate 12.8% vs local median 2.8% in Punta Gorda — top-decile yield for the area; either an underpriced asset or a hidden risk that comps aren't pricing in. Stress-test before assuming the spread holds.
Location & tenants
- Location reads 76/100 on livability (#225 in FL, #3,567 nationally) — a middle-class / working-renter tenant base. Strengths: crime A+, health & safety A+, housing B; Watch: cost of living D+, amenities D-, commute F.
- Charlotte (suburban): math 54% / reading 54% proficiency, ranked #22 of 73 in FL (top 30%) — acceptable for families but not a draw, mixed tenant base, ~2y average lease.
- Zoned schools: East Elementary School (math 67% / reading 68%, grade B+, #435 of 2,144 statewide, top 21%, 761 students, 52% FRL); Punta Gorda Middle School (math 54% / reading 52%, grade C+, #209 of 571 statewide, top 37%, 1,120 students, 41% FRL); Charlotte High School (math 44% / reading 46%, grade D-, #228 of 667 statewide, top 35%, 1,994 students, 41% FRL).
- Market conditions: 1490 active listings in the ZIP; 5 comparable units currently listed for rent nearby; rentals at typical pace (median 23d on market — plan ~3-4 weeks tenant-placement turnaround); solid renter incomes; 4,585 units permitted in Charlotte County in 2024 (703 in 5+ unit buildings).
Forward outlook
- Local home prices are declining (-3.0%/yr); year-one equity from $1k of loan paydown is wiped out by about $4k of value loss. Plan a longer hold.
- Charlotte County population projected at +24% by 2050 — long-run rental-demand tailwind backs the buy-and-hold thesis.
- At projected returns (-3.0% appreciation + 3.0% rent growth), your $42k cash investment doubles in ~6 years — after that, you're playing with house money.
Negotiation context
- It's been on market 25 days — a 2% lower offer ($147k) is reasonable based on typical stale-listing flexibility.
- 11 sale attempts since 15y ago with the ask held roughly flat each time — persistent listings suggest the price (not the market) is what's stuck; bring a comps-based counter.
- Current owner paid $85k; list at $149k implies a 75% gain — meaningful room to come down on a strong offer.
Risks & watch-outs
- Watch-outs: built in 1959 — expect roof / HVAC / electrical / plumbing capex.
- Climate carrying-cost: severe wind risk, 99% chance of damaging wind over 30y; extreme-heat days projected 6→24/yr by 2055 (HVAC capex compounding) — expect insurance premiums to compound above CPI over the hold.
Questions for the listing agent
- Built in 1959 — when were the roof, HVAC, electrical panel, plumbing, and water heater last replaced?
- Is there a deadline driving the sale (1031 exchange, divorce, estate, relocation)? That informs how much negotiation room exists.
- Schools are A-rated — typically a magnet for longer-tenancy family renters. What's the average tenant stay here, and is there a school-zone premium baked into asking?
- What's the average days-on-market for RENTAL listings here right now (not sales)? A rising rental-DOM trend means longer vacancies and softer asking-rent achievability than the comps imply.
- What's the recent tenant-quality profile in this submarket — average credit score on applications, eviction rate, late-payment / NSF rate, and stable-employment percentage? A property-management company in the area should have these aggregated.
- How much new for-sale + rental construction is in the pipeline within 1–3 miles? Heavy new supply typically softens prices + rents 12–24 months out; constrained supply supports both.
Investment metrics
- 1% rule
- 1.55% ✓
- Cap rate
- 12.80%
- Cash-on-cash
- 23.25%
- DSCR
- 2.03
- GRM
- 5.4
CMA / ARV
- ARV (on-the-fly)
- $376,500
- Comps found
- 2
Show comp detail 2 sales within ~0.75 mi
| Address | Dist | Beds/Ba | Sqft | Sold | Price | $/sf | Match |
|---|---|---|---|---|---|---|---|
| 28106 Chinquapin Dr | 0.28mi | 3/2.0 | 1,477 (-2%) | 21mo | $304,990 | $206 | 62 |
| 27207 Treadmill Dr | 0.65mi | 3/2.0 | 1,394 (-7%) | 2mo | $350,000 | $251 | 52 |
Match score weights: distance 35% · size 25% · config 20% · recency 20%. Top-matched comps best support the ARV.
Projected returns pro-forma
-3.0% appreciation · 3.0% rent growth · sell at horizon
- IRR
- 16.3%
- Equity multiple
- 1.66×
- Total profit
- $27,365
- Equity at exit
- $22,216
- IRR
- 24.9%
- Equity multiple
- 3.16×
- Total profit
- $90,236
- Equity at exit
- $12,883
Cash invested: $41,720 (down + closing). Projections, not guarantees.
Landlord ↔ Tenant lean methodology
- Overall (STATE)
- 87 Strongly Landlord-Friendly
- State Florida
- 87 Strongly Landlord-Friendly · R+3
- County
- — inherits STATE
- City
- — inherits STATE
ZIP-level market 33955
- Home prices YoY
- -24.5%
- Active inventory
- 1490
- Price-to-rent
- 5.4×
Monthly cashflow live
- Estimated rent
- $2,314 high interval (Pro) →
- Mortgage (P&I)
- −$781
- Tax from tax record
- −$177 /mo · $2,120/yr
- Insurance
- −$62
- HOA
- −$0
- Vacancy / Maint / Mgmt
- −$486
- Net cashflow
- $808
Break-even live
Sensitivity live
| Price | -10% $893 | -5% $850 | +0% $808 | +5% $766 | +10% $724 |
|---|---|---|---|---|---|
| Rent | -10% $625 | -5% $717 | +0% $808 | +5% $900 | +10% $991 |
| Rate | -1.0pp $883 | -0.5pp $846 | base $808 | +0.5pp $770 | +1.0pp $730 |
UW: 25.0% down · 7.5% · 30yr · 1.5% tax · 5.0% vac · 8.0% maint · 8.0% mgmt
Financing live
Cash to close
- Down payment
- $37,250
- Closing costs
- $4,470
- Reserves months
- —
- Total cash needed
- —
Loan-product check · same deal, 3 products live
Conventional
25% down · 7.5% · 30yr
- Down + closing
- —
- Monthly P&I
- —
- Monthly cashflow
- —
- DSCR
- —
- Eligible?
- —
Personal DTI + credit; lowest rate.
DSCR
20% down · 8.5% · 30yr
- Down + closing
- —
- Monthly P&I
- —
- Monthly cashflow
- —
- DSCR
- —
- Eligible?
- —
No personal income docs; deal must DSCR.
Hard money
10% down · 12.0% · 12mo
- Down + closing
- —
- Monthly P&I
- —
- Monthly cashflow
- —
- DSCR
- —
- Eligible?
- —
Short-term bridge; refi at stabilization.
Rent comps 5 comps
| Address | Beds | Baths | Sqft | Rent | $/sqft | DOM | Units | Dist |
|---|---|---|---|---|---|---|---|---|
| 12378 Paramount Dr Punta Gorda, FL | 4.0 | 3.0 | 1836 | $2,295 | $1.25 | 23d | 1 | 0.65mi |
| 13263 Valrico Ter Punta Gorda, FL | 3.0 | 2.0 | 1628 | $1,500 | $0.92 | 23d | 1 | 0.70mi |
| 11812 Cloverly Ln Punta Gorda, FL | 4.0 | 2.5 | 1875 | $2,150 | $1.15 | 23d | 1 | 1.11mi |
| 11795 Cloverly Ln Punta Gorda, FL | 4.0 | 2.5 | 2028 | $2,075 | $1.02 | 23d | 1 | 1.15mi |
| 13239 Turnleaf Blvd Punta Gorda, FL | 4.0 | 2.5 | 1874 | $2,300 | $1.23 | 15d | 1 | 1.24mi |
Listing history 44 events
-
2026-06-09days on market $149,000 Active 25 DOM
-
2026-06-08days on market $149,000 Active 24 DOM
-
2026-06-07days on market $149,000 Active 23 DOM
-
2026-06-05days on market $149,000 Active 20 DOM
-
2026-06-03days on market $149,000 Active 19 DOM
-
2026-06-02days on market $149,000 Active 18 DOM
-
2026-06-01days on market $149,000 Active 17 DOM
-
2026-05-31days on market $149,000 Active 16 DOM
-
2026-05-30days on market $149,000 Active 15 DOM
-
2026-05-15$149,000 Active
-
2026-05-07status Active
-
2026-05-07historical
-
2026-05-04status Pending
-
2026-04-23status Active
-
2026-04-17status Pending
-
2026-03-14price $149,000
-
2026-02-23status Active
-
2026-02-11status Pending
-
2026-01-06$159,000 Active
-
2025-12-05historical
-
2025-10-21status Active
-
2025-10-03status Pending
-
2025-09-30price $169,000
-
2025-09-25price $199,000
-
2025-08-31$169,000 Active
-
2025-08-10price $169,000
-
2025-07-17price $175,000
-
2025-06-07price $199,900
-
2025-05-16price $205,000
-
2025-03-19price $225,000
-
2025-02-04price $235,000
-
2024-09-07$245,000 Active
-
2021-01-19soldstatus $85,000
-
2020-12-17soldstatus $85,000 Sold
-
2020-12-03status Pending
-
2020-11-30price $85,000
-
2020-11-30status Active
-
2020-11-19status Pending
-
2020-11-02$95,000 Active
-
2011-05-12soldstatus $13,000
-
2011-03-02$13,000
-
2000-05-03soldstatus $58,000
-
1999-12-09soldstatus $34,000
-
1982-10-01soldstatus $33,000
ⓘ Source: listings_history table (triggers on properties + properties_extension) + one-shot
backfill from property_details.listing_events for pre-trigger history.
Tax reassessment forecast FL · Resets to sale price
- Current annual tax
- $2,120 · $177/mo
- Projected year-2 tax
- $2,120 · $177/mo
- Expected delta
- $0/yr ($0/mo · 0.0%)
ⓘ Screening estimate from a state-policy table — verify with the county assessor before closing.
Climate risk First Street
- Flood 1/10 Low FEMA zone D · 0% chance over 30 yrs
- Wildfire 3/10 Moderate
- Heat 9/10 Extreme 6 d/yr ≥108°F today · 24 d/yr by 30 yrs out
- Wind 10/10 Extreme 99% chance of damaging wind over 30 yrs
- Air quality 2/10 Low 1 unhealthy d/yr today · 2 by 30 yrs out
Nearby sold comps map
Loading sold comps map…
Walkable amenities ~0.75 mi
Loading nearby amenities…
Taxation est. · year 1
- Rental income
- $27,773
- − Mortgage interest
- −$8,346
- − Property taxes
- −$2,120
- − Insurance
- −$745
- − Repairs & maintenance
- −$2,222
- − Management
- −$2,222
- − Depreciation
- −$4,335
- Taxable income
- $7,784
- Est. tax owed @ 24.0%
- −$1,868
- After-tax cash flow
- $7,831/yr
For passive investors: Depreciation is non-cash, so a rental often shows a tax loss while cash-flowing — sheltering income. Rental losses are passive: they offset passive income freely, and up to $25,000/yr can offset ordinary (W-2) income if you actively participate and your MAGI is under $100k (phasing out to $0 by $150k); unused losses carry forward. On sale, claimed depreciation is recaptured at up to 25%, and gains may owe capital-gains tax (a 1031 exchange can defer both). Figures are a year-1 estimate at your 24.0% rate — not tax advice; consult a CPA.
Schools (NCES district)
- District
- Charlotte
- NCES district ID
- 1200240
- Math proficiency
- 54% ▼ -6.00%
- Reading proficiency
- 54% ▼ -1.00%
- Median HH income
- $44,864
- Composite
- 45.62/100
- National rank
- #2586
- State rank
- #22 of 73 in FL
Livability — Punta Gorda
- Score
- 76/100
- State rank
- #225
- US rank
- #3567
Category grades
Schools grade is shown separately in the Schools card above.
Census & demographics
- County
- Charlotte County · 196,994 people
- City population
- 68,831
- Metro
- Punta Gorda, FL
- Population (ZIP)
- 12,399
- Household income
- $76,943
- Rent vs Own
- Severe rent burden
- 226.0
Population outlook (Charlotte County) Hauer SSP2
- Today (2025)
- 198,646 people
- By 2030
- 210,507 · +6.0%
- By 2040
- 230,857 · +16.2%
- By 2050
- 247,148 · +24.4%
- By 2075
- 281,777 · +41.8%
- By 2100
- 293,609 · +47.8%
Race, ethnicity, and origin ACS 2023
- Neighborhood character
- Predominantly White (84%)
- Race & ethnicity
- White 84% Hispanic / Latino 10% Two or more races 9% Black 2%
- Hispanic origin (detail)
- Mexican 4% Puerto Rican 2% Cuban 4%
- Common ancestry
- Romanian 5% Italian 3% Serbian 3%
- Foreign-born
- 8% · Canada
- Languages at home
- 91% English-only · Spanish 5% Other Indo-European 1%
Political lean MEDSL · Charlotte
- 2024 margin
- Solid R (+34.0) · D 32.7% · R 66.7%
- 2008→2024 swing
- -26.7pp toward R · 2008: -7.2pp · 2024: -34.0pp
- All cycles
- 2024: R+34.0 2020: R+26.6 2016: R+27.8 2012: R+14.3 2008: R+7.2
Not yet ingested
- Civics
- —
Market trends
- HPI YoY
- ▼ -78.71%
- Current HPI
- 242.9043
- Rent YoY
- —
- Metro
- Punta Gorda, FL
- State GDP YoY
- ▲ 3.28%
- F500 in state
- 36
Industry mix (Fortune 500 HQ in FL)
| Industry | F500 HQs | Revenue |
|---|---|---|
| Industrial Technology | 2 | $29B |
|
||
| Insurance | 2 | $17B |
|
||
| Retail | 1 | $60B |
|
||
| Technology Distribution | 1 | $58B |
|
||
| Homebuilding | 1 | $35B |
|
||
| Technology Manufacturing | 1 | $35B |
|
||
Price history
+351.5% since first listed35 events — show timeline
- 2026-05-15 Listed $149,000 Stellar MLS as Distributed by MLS Grid
- 2026-05-07 Relisted — FORTMLS
- 2026-05-07 Listing Removed — FORTMLS
- 2026-05-04 Pending — FORTMLS
- 2026-04-23 Relisted — FORTMLS
- 2026-04-17 Pending — FORTMLS
- 2026-03-14 Price Changed $149,000 FORTMLS
- 2026-02-23 Relisted — FORTMLS
- 2026-02-11 Pending — FORTMLS
- 2026-01-06 Listed $159,000 FORTMLS
- 2025-12-05 Listing Removed — FORTMLS
- 2025-10-21 Relisted — FORTMLS
- 2025-10-03 Pending — FORTMLS
- 2025-09-30 Price Changed $169,000 FORTMLS
- 2025-09-25 Price Changed $199,000 FORTMLS
- 2025-08-31 Listed $169,000 Stellar MLS as Distributed by MLS Grid
- 2025-08-10 Price Changed $169,000 FORTMLS
- 2025-07-17 Price Changed $175,000 FORTMLS
- 2025-06-07 Price Changed $199,900 FORTMLS
- 2025-05-16 Price Changed $205,000 FORTMLS
- 2025-03-19 Price Changed $225,000 FORTMLS
- 2025-02-04 Price Changed $235,000 FORTMLS
- 2024-09-07 Listed $245,000 FORTMLS
- 2021-01-19 Sold (Public Records) $85,000 Public Records
- 2020-12-17 Sold (MLS) $85,000 Stellar MLS as Distributed by MLS Grid
- 2020-12-03 Pending — Stellar MLS as Distributed by MLS Grid
- 2020-11-30 Price Changed $85,000 Stellar MLS as Distributed by MLS Grid
- 2020-11-30 Relisted — Stellar MLS as Distributed by MLS Grid
- 2020-11-19 Pending — Stellar MLS as Distributed by MLS Grid
- 2020-11-02 Listed $95,000 Stellar MLS as Distributed by MLS Grid
- 2011-05-12 Sold (MLS) $13,000 Stellar MLS as Distributed by MLS Grid
- 2011-03-02 Listed $13,000 Stellar MLS as Distributed by MLS Grid
- 2000-05-03 Sold (Public Records) $58,000 Public Records
- 1999-12-09 Sold (Public Records) $34,000 Public Records
- 1982-10-01 Sold (Public Records) $33,000 Public Records
Property tax history
+8.7%/yrLatest (2025): $2,120 · +3.5% YoY. Source: county tax records.
Cash-flow waterfall
monthlySold comps — $/sqft
last 12 mo · ≤1 miLoading sold comps…