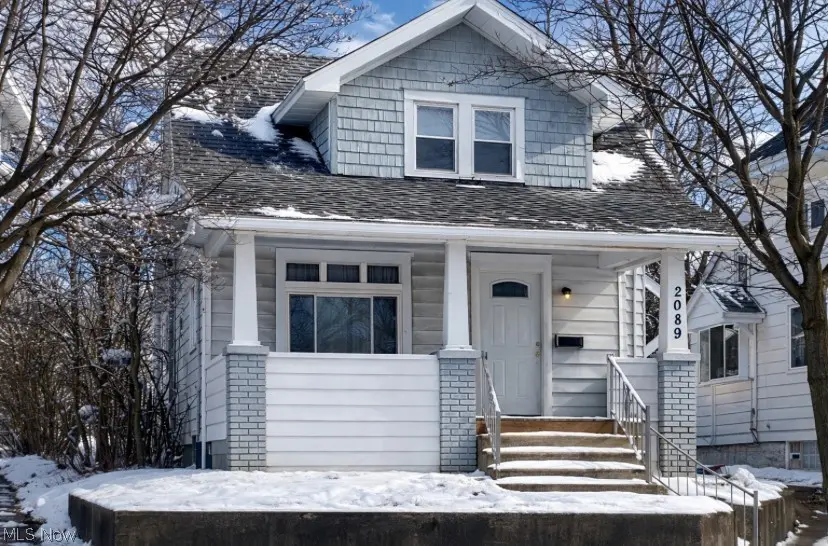
2089 13th St SW · Akron, OH
Flood risk 1/10 · Minimal
- FEMA flood zone
- X (unshaded)
- Chance of flooding over 30 yrs
- 0.0%
- Est. flood insurance / yr
- $473 – $860
Fire risk 1/10 · Minimal
- Est. fire insurance / yr
- $713 – $1,323
Heat risk 3/10 · Minor
- Hot days now (above 96°F)
- 7 days/yr
- Hot days in 30 yrs
- 17 days/yr
Wind risk 1/10 · Minimal
- Chance of severe wind over 30 yrs
- —
Air-quality risk 2/10 · Minimal
- Unhealthy air days now
- 0 days/yr
- Unhealthy air days in 30 yrs
- 1 days/yr
Risk factors via First Street. Map © Google.
Why this score? — see what drove the F grade
The composite is a weighted blend of 9 inputs, each scored 0–100. Each bar is that input's sub-score; the figure is the points it added to the 100-point composite (weight × sub-score).
- Cash flow +14.6/30.0
- DSCR +4.4/10.0
- Livability +4.0/5.0
- 1% rule +3.7/10.0
- Rent growth +3.5/5.0
- Condition / age +2.5/5.0
- Schools +2.1/10.0
- ARV discount +0.0/15.0
- Appreciation +0.0/10.0
$127,272
🖨 Deal sheet (PDF) 📄 Offer letter ✓ Due diligence
Listing remarks MLS
This charming home is located in the vibrant Kenmore-Akron neighborhood. The first floor features a spacious living room, dining room, kitchen, convenient half bathroom, and a cozy bedroom. Upstairs, you'll find two additional bedrooms and a full bathroom, providing ample space for a growing family. The living room and dining room have brand new flooring. The backyard is fully fenced, offering privacy and a perfect space for outdoor activities. A significant highlight of this property is its prime location directly across the street from the former Kenmore High School property, soon to become the new home of the combined Miller South School for the Visual and Performing Arts and Pfeiffer Elementary School. This exciting development is sure to enhance the neighborhood's appeal. Don't miss out on this exceptional home in a rapidly evolving community. Schedule a viewing today and see the potential for yourself!
Key facts
- Covered front porch
- Full basement
- Investment potential
Tags
Property features AI
Exterior
- Parking: Driveway; 2-car garage
- Utilities: Public water; Public sewer
- Home design: Aluminum siding; Asphalt and fiberglass roof
- Construction: Aluminum siding construction
- Exterior features: Lot recorded by assessor
Interior
- Bedrooms: 2 main-level bedrooms
- Bathrooms: 1 full bathroom; 1 half bathroom; 1 main-level bathroom
- Heating & cooling: Gas heating; Central air conditioning
- Interior features: Full basement; Total of 7 rooms
Neighborhood map
What this means for you Summary
Snapshot
- This is a 3-bed/1.5-bath single-family listed at $127k.
Deal economics
- At list price, monthly cash flow is $29 ($353/yr) — positive.
- The deal already cash-flows at list — no discount required.
- To meet the 1% rule (rent ≥ 1% of price), the offer needs to be $110k (13.4% below list).
- Recommended offer: $110k (13.4% below list) — sets the bar for 1% rule.
Location & tenants
- Location reads 81/100 on livability (#104 in OH, #1,591 nationally) — a professional / high-income tenant draw. Strengths: amenities A+, commute A+, cost of living A+; Watch: crime F, employment F.
- Akron City (urban): math 22% / reading 30% proficiency, ranked #602 of 656 in OH (top 92%) — low school quality limits family demand, transient renter base, plan for 1-2y turnover; 66% free/reduced lunch — lower-income household profile, screen leases tightly.
- Zoned schools: Pfeiffer Elementary School (math 24% / reading 27%, grade F, #1,211 of 1,584 statewide, top 76%, 210 students, 0% FRL); Innes Community Learning Center (math 8% / reading 15%, grade F, #641 of 654 statewide, top 98%, 641 students, 0% FRL); Akron Early College High School (math 62% / reading 98%, grade A, #34 of 781 statewide, top 4%, 377 students, 0% FRL) — zoned schools average 0% FRL vs 66% district-wide (66 pts lower); this property's tenant base skews higher-income than the district average.
- Zoned-school proficiency averages 39% at this address vs 26% district-wide (+13 pts) — the actual schools serving this property are materially stronger than the Akron City average implies; a family-tenant draw the district grade alone would hide.
- Market conditions: Rents rising (+3.9%/yr); 104 active listings in the ZIP; 23 comparable units currently listed for rent nearby; rentals at typical pace (median 26d on market — plan ~3-4 weeks tenant-placement turnaround); 1,114 units permitted in Summit County in 2024 (397 in 5+ unit buildings).
Forward outlook
- Local home prices are declining (-3.0%/yr); year-one equity from $880 of loan paydown is wiped out by about $4k of value loss. Plan a longer hold.
- Summit County population projected to shrink 6% by 2050 — rents likely to lag national; underwrite the cash flow, not the appreciation.
Negotiation context
- It's been on market 18 days — a 2% lower offer ($125k) is reasonable based on typical stale-listing flexibility.
- 5 sale attempts since 25y ago with the ask held roughly flat each time — persistent listings suggest the price (not the market) is what's stuck; bring a comps-based counter.
- Current owner paid $90k; 41% above their basis — modest negotiation headroom, anchor on the comps not their cost.
Risks & watch-outs
- Watch-outs: built in 1924 — expect roof / HVAC / electrical / plumbing capex.
Questions for the listing agent
- Built in 1924 — when were the roof, HVAC, electrical panel, plumbing, and water heater last replaced?
- Is there a deadline driving the sale (1031 exchange, divorce, estate, relocation)? That informs how much negotiation room exists.
- Crime grade is F in this area — have there been break-ins, vandalism, or insurance claims at this property in the last 3 years? What carrier currently insures it and at what premium?
- The area grade is low — what's the realistic commute time and amenity access for the typical tenant pool here? Any planned neighborhood developments (good or bad) we should know about?
- What's the average days-on-market for RENTAL listings here right now (not sales)? A rising rental-DOM trend means longer vacancies and softer asking-rent achievability than the comps imply.
- What's the recent tenant-quality profile in this submarket — average credit score on applications, eviction rate, late-payment / NSF rate, and stable-employment percentage? A property-management company in the area should have these aggregated.
- How much new for-sale + rental construction is in the pipeline within 1–3 miles? Heavy new supply typically softens prices + rents 12–24 months out; constrained supply supports both.
Investment metrics
- 1% rule
- 0.87% ✗
- Cap rate
- 6.57%
- Cash-on-cash
- 0.99%
- DSCR
- 1.04
- GRM
- 9.6
CMA / ARV
- ARV (on-the-fly)
- $85,560
- Comps found
- 12
Show comp detail 12 sales within ~0.75 mi
| Address | Dist | Beds/Ba | Sqft | Sold | Price | $/sf | Match |
|---|---|---|---|---|---|---|---|
| 2079 12th St SW | 0.07mi | 3/1.5 | 1,004 (+9%) | 3mo | $137,500 | $137 | 79 |
| 622 Polk Ave | 0.38mi | 3/2.0 | 928 (+1%) | 6mo | $115,000 | $124 | 74 |
| 2303 6th St SW | 0.56mi | 3/1.0 | 912 (-1%) | 7mo | $53,000 | $58 | 65 |
| 2001 13th St SW | 0.17mi | 2/1.0 (-1) | 1,016 (+10%) | 4mo | $94,900 | $93 | 64 |
| 1254 Leeser Ave | 0.75mi | 3/1.0 | 941 (+2%) | 1mo | $75,000 | $80 | 58 |
| 880 Jason Ave | 0.53mi | 3/1.0 | 988 (+7%) | 6mo | $61,000 | $62 | 56 |
| 636 Flora Ave | 0.72mi | 4/2.0 (+1) | 903 (-2%) | 1mo | $163,000 | $181 | 56 |
| 592 Sharon St | 0.46mi | 2/1.5 (-1) | 1,020 (+11%) | 6mo | $50,000 | $49 | 50 |
| 1882 16th St SW | 0.43mi | 2/1.0 (-1) | 818 (-11%) | 7mo | $86,000 | $105 | 49 |
| 2138 East Ave | 0.74mi | 3/1.0 | 990 (+8%) | 5mo | $51,000 | $52 | 47 |
| 940 Lakewood Blvd | 0.65mi | 2/1.0 (-1) | 996 (+8%) | 6mo | $96,000 | $96 | 44 |
| 1855 W 17th St SW | 0.49mi | 2/1.0 (-1) | 1,050 (+14%) | 5mo | $85,000 | $81 | 43 |
Match score weights: distance 35% · size 25% · config 20% · recency 20%. Top-matched comps best support the ARV.
Projected returns pro-forma
-3.0% appreciation · 3.91% rent growth · sell at horizon
- IRR
- -13.8%
- Equity multiple
- 0.50×
- Total profit
- $-17,741
- Equity at exit
- $18,977
- IRR
- -3.6%
- Equity multiple
- 0.75×
- Total profit
- $-8,810
- Equity at exit
- $11,004
Cash invested: $35,636 (down + closing). Projections, not guarantees.
Landlord ↔ Tenant lean methodology
- Overall (STATE)
- 73 Landlord-Friendly
- State Ohio
- 73 Landlord-Friendly · R+6
- County
- — inherits STATE
- City
- — inherits STATE
ZIP-level market 44314
- Rents YoY
- 3.9%
- Active inventory
- 104
- Price-to-rent
- 9.6×
Monthly cashflow live
- Estimated rent
- $1,102 high interval (Pro) →
- Mortgage (P&I)
- −$667
- Tax from tax record
- −$121 /mo · $1,451/yr
- Insurance
- −$53
- HOA
- −$0
- Lot rent
- −$0
- Vacancy / Maint / Mgmt
- −$231
- Net cashflow
- $29
Break-even live
Sensitivity live
| Price | -10% $101 | -5% $65 | +0% $29 | +5% $-7 | +10% $-43 |
|---|---|---|---|---|---|
| Rent | -10% $-58 | -5% $-14 | +0% $29 | +5% $73 | +10% $116 |
| Rate | -1.0pp $93 | -0.5pp $62 | base $29 | +0.5pp $-4 | +1.0pp $-37 |
UW: 25.0% down · 7.5% · 30yr · 1.5% tax · 5.0% vac · 8.0% maint · 8.0% mgmt
Financing live
Cash to close
- Down payment
- $31,818
- Closing costs
- $3,818
- Reserves months
- —
- Total cash needed
- —
Loan-product check · same deal, 3 products live
Conventional
25% down · 7.5% · 30yr
- Down + closing
- —
- Monthly P&I
- —
- Monthly cashflow
- —
- DSCR
- —
- Eligible?
- —
Personal DTI + credit; lowest rate.
DSCR
20% down · 8.5% · 30yr
- Down + closing
- —
- Monthly P&I
- —
- Monthly cashflow
- —
- DSCR
- —
- Eligible?
- —
No personal income docs; deal must DSCR.
Hard money
10% down · 12.0% · 12mo
- Down + closing
- —
- Monthly P&I
- —
- Monthly cashflow
- —
- DSCR
- —
- Eligible?
- —
Short-term bridge; refi at stabilization.
Rent comps 23 comps
| Address | Beds | Baths | Sqft | Rent | $/sqft | DOM | Units | Dist |
|---|---|---|---|---|---|---|---|---|
| 835 Kenmore Blvd Unit UP Akron, OH | 2.0 | 1.0 | 872 | $750 | $0.86 | 23d | 1 | 0.26mi |
| 2139 18th St SW Akron, OH | 2.0 | 1.0 | 992 | $1,100 | $1.11 | 46d | 1 | 0.30mi |
| 2047 20th St SW Akron, OH | 2.0 | 1.0 | 624 | $695 | $1.11 | 25d | 1 | 0.38mi |
| 720 Florida Ave Akron, OH | 4.0 | 1.0 | 1124 | $1,500 | $1.33 | 16d | 1 | 0.40mi |
| 1035 Chester Ave Unit 1 Akron, OH | 2.0 | 1.0 | 624 | $900 | $1.44 | 25d | 1 | 0.50mi |
| 1035 Chester Ave Akron, OH | 2.0 | 1.0 | 624 | $900 | $1.44 | 16d | 1 | 0.50mi |
| 2264 5th St SW Unit 2266 Akron, OH | 2.0 | 1.0 | 676 | $750 | $1.11 | 16d | 1 | 0.53mi |
| 847 Jason Ave Unit 1 Akron, OH | 2.0 | 1.0 | 798 | $825 | $1.03 | 25d | 1 | 0.53mi |
| 2266 5th St SW Akron, OH | 2.0 | 1.0 | 676 | $750 | $1.11 | 16d | 1 | 0.53mi |
| 960 Jason Ave Akron, OH | 3.0 | 1.5 | 935 | $1,095 | $1.17 | 23d | 1 | 0.55mi |
| 781 Saxon Ave Akron, OH | 2.0 | 1.0 | 800 | $900 | $1.12 | 46d | 1 | 0.59mi |
| 2138 East Ave Akron, OH | 3.0 | 1.0 | 990 | $1,100 | $1.11 | 25d | 1 | 0.76mi |
| 899 Rosamond Ave Akron, OH | 1.0–2.0 | 1.0 | 690 | $825 | $1.20 | 25d | 1 | 0.97mi |
| 1253 California Ave Akron, OH | 2.0 | 1.0 | 780 | $950 | $1.22 | 25d | 1 | 0.98mi |
| 1253 California Ave Akron, OH | 2.0 | 1.0 | 780 | $1,100 | $1.41 | 46d | 1 | 0.98mi |
| 1138 Kohler Ave Akron, OH | 3.0 | 1.0 | 1000 | $1,250 | $1.25 | 16d | 1 | 1.16mi |
| 685 Longview Ave Akron, OH | 3.0 | 1.0 | 1100 | $1,150 | $1.05 | 46d | 1 | 1.18mi |
| 1032 Andrew St Akron, OH | 3.0 | 1.0 | 960 | $1,097 | $1.14 | 46d | 1 | 1.19mi |
| 1455 Woodbirch Ave Akron, OH | 3.0 | 2.0 | 1008 | $1,500 | $1.49 | 23d | 1 | 1.22mi |
| 1453 Woodbirch Ave Akron, OH | 3.0 | 2.0 | 1008 | $1,500 | $1.49 | 46d | 1 | 1.22mi |
| 2569 Romig Rd Unit 2561-16 Akron, OH | 2.0 | 1.5 | 810 | $1,125 | $1.39 | 16d | 1 | 1.26mi |
| 1169 Weiser Ave Akron, OH | 2.0 | 1.0 | 768 | $950 | $1.24 | 46d | 1 | 1.31mi |
| 1069 Fess Ave Akron, OH | 2.0 | 1.0 | 940 | $1,095 | $1.16 | 46d | 1 | 1.34mi |
Listing history 13 events
-
2026-06-21days on market $127,272 Active 18 DOM
-
2026-06-18days on market $127,272 Active 15 DOM
-
2026-06-17days on market $127,272 Active 14 DOM
-
2026-06-16days on market $127,272 Active 13 DOM
-
2026-06-15days on market $127,272 Active 12 DOM
-
2026-06-14days on market $127,272 Active 10 DOM
-
2026-06-13days on market $127,272 Active 9 DOM
-
2026-06-10days on market $127,272 Active 7 DOM
-
2026-06-09days on market $127,272 Active 6 DOM
-
2026-06-08days on market $127,272 Active 5 DOM
-
2026-06-07days on market $127,272 Active 4 DOM
-
2026-06-03remarks 699-char remark
-
2026-06-03$127,272 Active 1 DOM
ⓘ Source: listings_history table (triggers on properties + properties_extension) + one-shot
backfill from property_details.listing_events for pre-trigger history.
Tax reassessment forecast OH · Partial reset (capped growth)
- Current annual tax
- $1,451 · $121/mo
- Projected year-2 tax
- $1,718 · $143/mo
- Expected delta
- +$267/yr (+$22/mo · 18.4%)
ⓘ Screening estimate from a state-policy table — verify with the county assessor before closing.
Climate risk First Street
- Flood 1/10 Low FEMA zone X (unshaded) · 0% chance over 30 yrs
- Wildfire 1/10 Low
- Heat 3/10 Moderate 7 d/yr ≥96°F today · 17 d/yr by 30 yrs out
- Wind 1/10 Low
- Air quality 2/10 Low 0 unhealthy d/yr today · 1 by 30 yrs out
Nearby sold comps map
Loading sold comps map…
Walkable amenities ~0.75 mi
Loading nearby amenities…
Taxation est. · year 1
- Rental income
- $13,227
- − Mortgage interest
- −$7,129
- − Property taxes
- −$1,451
- − Insurance
- −$636
- − Repairs & maintenance
- −$1,058
- − Management
- −$1,058
- − Depreciation
- −$3,702
- Taxable loss
- −$1,809
- Est. tax savings @ 24.0%
- +$434
- After-tax cash flow
- $787/yr
For passive investors: Depreciation is non-cash, so a rental often shows a tax loss while cash-flowing — sheltering income. Rental losses are passive: they offset passive income freely, and up to $25,000/yr can offset ordinary (W-2) income if you actively participate and your MAGI is under $100k (phasing out to $0 by $150k); unused losses carry forward. On sale, claimed depreciation is recaptured at up to 25%, and gains may owe capital-gains tax (a 1031 exchange can defer both). Figures are a year-1 estimate at your 24.0% rate — not tax advice; consult a CPA.
Schools (NCES district)
- District
- Akron City
- NCES district ID
- 3904348
- Math proficiency
- 22% ▼ -17.00%
- Reading proficiency
- 30% ▼ -12.00%
- Median HH income
- $33,811
- Composite
- 21.31/100
- National rank
- #8383
- State rank
- #602 of 656 in OH
Livability — Akron
- Score
- 81/100
- State rank
- #104
- US rank
- #1591
Category grades
Schools grade is shown separately in the Schools card above.
Census & demographics
- Census place
- Akron, OH
- County
- Summit County · 440,783 people
- City population
- 174,375
- Metro
- Akron, OH
- Population (ZIP)
- 17,885
- Household income
- $47,468
- Rent vs Own
- Severe rent burden
- 975.0
Population outlook (Summit County) Hauer SSP2
- Today (2025)
- 546,583 people
- By 2030
- 544,028 · -0.5%
- By 2040
- 531,363 · -2.8%
- By 2050
- 514,923 · -5.8%
- By 2075
- 481,765 · -11.9%
- By 2100
- 432,265 · -20.9%
Race, ethnicity, and origin ACS 2023
- Neighborhood character
- Predominantly White (69%)
- Race & ethnicity
- White 69% Black 16% Two or more races 12% Hispanic / Latino 3% Asian 3%
- Common ancestry
- Slovak 2% Romanian 2% Lithuanian 1%
- Foreign-born
- 3% · India, Canada, Philippines
- Languages at home
- 96% English-only · Chinese 2% Russian/Polish/Slavic 1% Spanish 1%
Political lean MEDSL · Summit
- 2024 margin
- Lean D (+7.0) · D 53.0% · R 46.0%
- 2008→2024 swing
- -9.6pp toward R · 2008: 16.6pp · 2024: 7.0pp
- All cycles
- 2024: D+7.0 2020: D+9.6 2016: D+8.2 2012: D+14.8 2008: D+16.6
Not yet ingested
- Civics
- —
Market trends
- HPI YoY
- ▼ -166.61%
- Current HPI
- 151.066
- Rent YoY
- ▲ 3.91%
- Metro
- Akron, OH
- State GDP YoY
- ▲ 1.98%
- F500 in state
- 48
Industry mix (Fortune 500 HQ in OH)
| Industry | F500 HQs | Revenue |
|---|---|---|
| Insurance | 3 | $145B |
|
||
| Industrial Machinery | 3 | $49B |
|
||
| Financial Services | 3 | $24B |
|
||
| Consumer Goods | 2 | $93B |
|
||
| Aerospace / Defense | 2 | $47B |
|
||
| Utilities | 2 | $33B |
|
||
Price history
+284.5% since first listed12 events — show timeline
- 2026-02-24 Listed $127,272 MLSNOW
- 2025-04-21 Listing Removed — MLSNOW
- 2025-03-07 Listed $110,000 MLSNOW
- 2024-10-09 Sold (Public Records) $90,000 Public Records
- 2024-10-09 Sold (MLS) $90,000 MLSNOW
- 2024-09-21 Pending — MLSNOW
- 2024-09-16 Relisted — MLSNOW
- 2024-08-17 Price Changed $87,500 MLSNOW
- 2024-07-20 Listed $85,000 MLSNOW
- 2001-05-30 Sold (Public Records) $60,000 Public Records
- 2001-01-08 Listed $69,900 MLSNOW
- 1987-05-18 Sold (Public Records) $33,100 Public Records
Property tax history
+0.1%/yrLatest (2025): $1,451 · -1.8% YoY. Source: county tax records.
Cash-flow waterfall
monthlySold comps — $/sqft
last 12 mo · ≤1 miLoading sold comps…