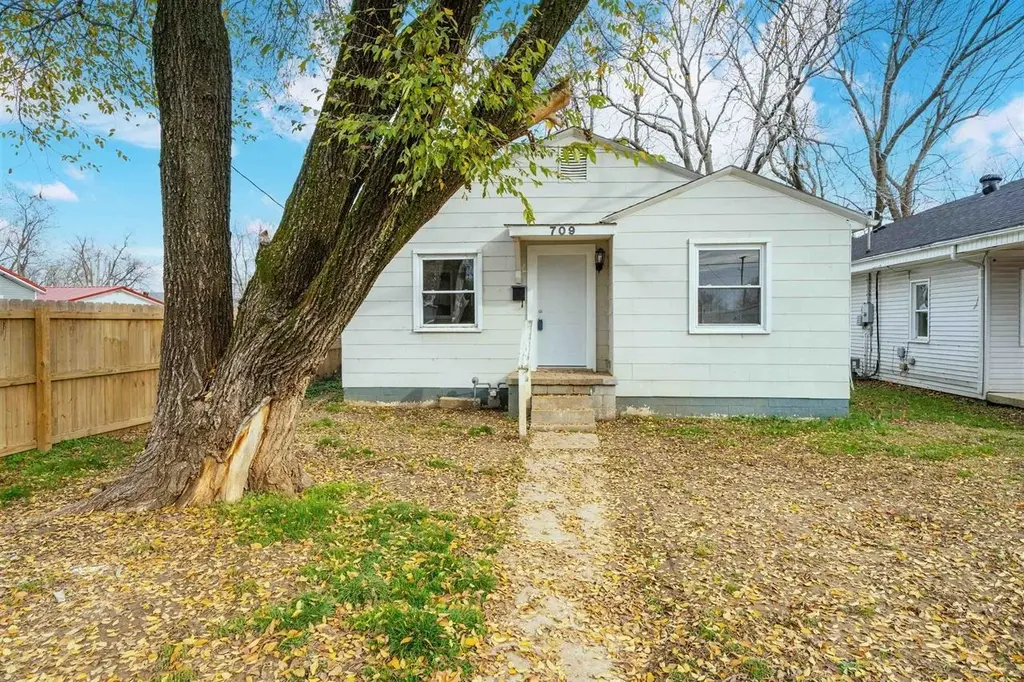
709 Poindexter St · Owensboro, KY
Flood risk 4/10 · Minor
- FEMA flood zone
- X (unshaded)
- Chance of flooding over 30 yrs
- 0.22%
- Est. flood insurance / yr
- $507 – $1,088
Fire risk 1/10 · Minimal
- Est. fire insurance / yr
- $839 – $1,559
Heat risk 5/10 · Moderate
- Hot days now (above 107°F)
- 7 days/yr
- Hot days in 30 yrs
- 19 days/yr
Wind risk 2/10 · Minimal
- Chance of severe wind over 30 yrs
- 3.0%
Air-quality risk 3/10 · Minor
- Unhealthy air days now
- 2 days/yr
- Unhealthy air days in 30 yrs
- 3 days/yr
Risk factors via First Street. Map © Google.
Why this score? — see what drove the C- grade
The composite is a weighted blend of 9 inputs, each scored 0–100. Each bar is that input's sub-score; the figure is the points it added to the 100-point composite (weight × sub-score).
- Cash flow +26.2/30.0
- DSCR +8.9/10.0
- 1% rule +5.6/10.0
- Livability +3.6/5.0
- Schools +2.6/10.0
- Rent growth +2.5/5.0
- Condition / age +2.5/5.0
- ARV discount +0.0/15.0
- Appreciation +0.0/10.0
$105,000
🖨 Deal sheet 📄 Offer letter ✓ Due diligence
Listing remarks MLS
Welcome to this move-in ready 2 bedroom, 1 bath home that’s waiting for its next owner! Enjoy the fenced in backyard and shed for all of your storage needs. Schedule your showing today!
Key facts
- Shed for storage
- Fenced in backyard
- 4,400 sq ft lot
Tags
Neighborhood map
What this means for you Summary
Snapshot
- This is a 2-bed/1.0-bath single-family listed at $105k.
Deal economics
- At list price, monthly cash flow is $268 ($3k/yr) — positive.
- The deal already cash-flows at list — no discount required.
- Meets the 1% rule at list price ($1k rent vs $105k).
- Cap rate 9.4% vs local median 3.1% in Owensboro — top-decile yield for the area; either an underpriced asset or a hidden risk that comps aren't pricing in. Stress-test before assuming the spread holds.
Location & tenants
- Location reads 71/100 on livability (#148 in KY) — a middle-class / working-renter tenant base. Strengths: cost of living A+, housing A+, health & safety B; Watch: employment D+, crime D-, amenities F.
- Owensboro Independent (urban): math 27% / reading 36% proficiency, ranked #100 of 165 in KY (top 61%) — families likely to look elsewhere, expect single-tenant / working-renter base with shorter leases; 63% free/reduced lunch — lower-income household profile, screen leases tightly.
- Market conditions: 297 active listings in the ZIP; 2 comparable units currently listed for rent nearby; 226 units permitted in Daviess County in 2024 (6 in 5+ unit buildings).
Forward outlook
- Local home prices are declining (-3.0%/yr); year-one equity from $726 of loan paydown is wiped out by about $3k of value loss. Plan a longer hold.
- Daviess County population projected at +6% by 2050 — modest demand growth; plan on rents tracking national, not racing it.
- At projected returns (-3.0% appreciation + 3.0% rent growth), your $29k cash investment doubles in ~10 years — after that, you're playing with house money.
Negotiation context
- Only 14 days on market — expect competitive offers; lowballing is unlikely to land.
- 4 sale attempts since 4y ago with the ask held roughly flat each time — persistent listings suggest the price (not the market) is what's stuck; bring a comps-based counter.
Risks & watch-outs
- Watch-outs: built in 1958 — expect roof / HVAC / electrical / plumbing capex.
- Climate carrying-cost: extreme-heat days projected 7→19/yr by 2055 (HVAC capex compounding) — expect insurance premiums to compound above CPI over the hold.
Questions for the listing agent
- Built in 1958 — when were the roof, HVAC, electrical panel, plumbing, and water heater last replaced?
- Is there a deadline driving the sale (1031 exchange, divorce, estate, relocation)? That informs how much negotiation room exists.
- Crime grade is D in this area — have there been break-ins, vandalism, or insurance claims at this property in the last 3 years? What carrier currently insures it and at what premium?
- What's the average days-on-market for RENTAL listings here right now (not sales)? A rising rental-DOM trend means longer vacancies and softer asking-rent achievability than the comps imply.
- What's the recent tenant-quality profile in this submarket — average credit score on applications, eviction rate, late-payment / NSF rate, and stable-employment percentage? A property-management company in the area should have these aggregated.
- How much new for-sale + rental construction is in the pipeline within 1–3 miles? Heavy new supply typically softens prices + rents 12–24 months out; constrained supply supports both.
Investment metrics
- 1% rule
- 1.06% ✓
- Cap rate
- 9.35%
- Cash-on-cash
- 10.93%
- DSCR
- 1.49
- GRM
- 7.8
CMA / ARV
- ARV (median comp)
- $73,000
- List price
- $105,000
- Delta
- 43.84%
- Verdict
- OVERPRICED
- Comps
- 20 within 1.0 mi
Show comp detail 12 sales within ~0.75 mi
| Address | Dist | Beds/Ba | Sqft | Sold | Price | $/sf | Match |
|---|---|---|---|---|---|---|---|
| 709 Poindexter St | 0.00mi | 2/1.0 | 808 (0%) | 0mo | $106,000 | $131 | 100 |
| 717 Poindexter St | 0.01mi | 2/1.0 | 864 (+7%) | 1mo | $103,000 | $119 | 88 |
| 2107 West 6th St | 0.22mi | 2/1.0 | 840 (+4%) | 2mo | $81,000 | $96 | 82 |
| 809 Poindexter St | 0.07mi | 2/1.0 | 728 (-10%) | 2mo | $71,000 | $98 | 78 |
| 1710 W 4th St | 0.27mi | 2/1.0 | 840 (+4%) | 5mo | $75,000 | $89 | 76 |
| 2514 Cravens Ave | 0.39mi | 2/1.0 | 756 (-6%) | 6mo | $120,000 | $159 | 66 |
| 1721 Lee Ct | 0.55mi | 2/1.0 | 788 (-2%) | 10mo | $115,000 | $146 | 62 |
| 511 Omega St | 0.37mi | 1/1.0 (-1) | 724 (-10%) | 1mo | $108,000 | $149 | 60 |
| 601 Jeff Pl | 0.53mi | 3/1.0 (+1) | 864 (+7%) | 3mo | $143,000 | $166 | 56 |
| 1012 W Third St | 0.71mi | 1/1.0 (-1) | 784 (-3%) | 4mo | $42,000 | $54 | 54 |
| 1403 Independence Ave | 0.44mi | 1/1.0 (-1) | 720 (-11%) | 6mo | $87,000 | $121 | 52 |
| 1532 W 3rd St | 0.41mi | 3/1.0 (+1) | 924 (+14%) | 7mo | $42,500 | $46 | 46 |
Match score weights: distance 35% · size 25% · config 20% · recency 20%. Top-matched comps best support the ARV.
Projected returns pro-forma
-3.0% appreciation · 3.0% rent growth · sell at horizon
- IRR
- -0.0%
- Equity multiple
- 1.00×
- Total profit
- $-3
- Equity at exit
- $15,656
- IRR
- 9.6%
- Equity multiple
- 1.74×
- Total profit
- $21,761
- Equity at exit
- $9,078
Cash invested: $29,400 (down + closing). Projections, not guarantees.
Landlord ↔ Tenant lean methodology
- Overall (STATE)
- 83 Strongly Landlord-Friendly
- State Kentucky
- 83 Strongly Landlord-Friendly · R+16
- County
- — inherits STATE
- City
- — inherits STATE
ZIP-level market 42301
- Home prices YoY
- -31.0%
- Active inventory
- 297
- Price-to-rent
- 7.8×
Monthly cashflow live
- Estimated rent
- $1,118 medium interval (Pro) →
- Mortgage (P&I)
- −$551
- Tax from tax record
- −$21 /mo · $252/yr
- Insurance
- −$44
- HOA
- −$0
- Vacancy / Maint / Mgmt
- −$235
- Net cashflow
- $268
Break-even live
UW: 25.0% down · 7.5% · 30yr · 1.5% tax · 5.0% vac · 8.0% maint · 8.0% mgmt
Financing live
Cash to close
- Down payment
- $26,250
- Closing costs
- $3,150
- Reserves months
- —
- Total cash needed
- —
Loan-product check · same deal, 3 products live
Conventional
25% down · 7.5% · 30yr
- Down + closing
- —
- Monthly P&I
- —
- Monthly cashflow
- —
- DSCR
- —
- Eligible?
- —
Personal DTI + credit; lowest rate.
DSCR
20% down · 8.5% · 30yr
- Down + closing
- —
- Monthly P&I
- —
- Monthly cashflow
- —
- DSCR
- —
- Eligible?
- —
No personal income docs; deal must DSCR.
Hard money
10% down · 12.0% · 12mo
- Down + closing
- —
- Monthly P&I
- —
- Monthly cashflow
- —
- DSCR
- —
- Eligible?
- —
Short-term bridge; refi at stabilization.
Rent comps 2 comps
| Address | Beds | Baths | Sqft | Rent | $/sqft | DOM | Units | Dist |
|---|---|---|---|---|---|---|---|---|
| 1202 Hutch Ln Unit A Owensboro, KY | 2.0 | 1.0 | 989 | $825 | $0.83 | 13d | 1 | 0.59mi |
| 1302 Daviess St Owensboro, KY | 3.0 | 1.0 | 1008 | $1,200 | $1.19 | 20d | 1 | 1.33mi |
Listing history 11 events
-
2026-05-04status Pending 191-char remark
Show marketing remark (191 chars)
Welcome to this move-in ready 2 bedroom, 1 bath home that’s waiting for its next owner! Enjoy the fenced in backyard and shed for all of your storage needs. Schedule your showing today!
-
2026-04-19status Active
-
2026-04-19price $105,000
-
2026-04-17$105,000 Active 191-char remark
Show marketing remark (191 chars)
Welcome to this move-in ready 2 bedroom, 1 bath home that’s waiting for its next owner! Enjoy the fenced in backyard and shed for all of your storage needs. Schedule your showing today!
-
2026-03-13price $114,000
-
2026-02-12price $119,000
-
2025-12-02price $124,000
-
2025-11-25$134,000 Active
-
2022-07-08soldstatus $160,000
-
2022-04-27soldstatus $55,000
-
2022-03-09$59,900
ⓘ Source: listings_history table (triggers on properties + properties_extension) + one-shot
backfill from property_details.listing_events for pre-trigger history.
Tax reassessment forecast KY · Resets to sale price
- Current annual tax
- $252 · $21/mo
- Projected year-2 tax
- $903 · $75/mo
- Expected delta
- +$651/yr (+$54/mo · 257.8%)
ⓘ Screening estimate from a state-policy table — verify with the county assessor before closing.
Climate risk First Street
- Flood 4/10 Moderate FEMA zone X (unshaded) · 22% chance over 30 yrs
- Wildfire 1/10 Low
- Heat 5/10 Major 7 d/yr ≥107°F today · 19 d/yr by 30 yrs out
- Wind 2/10 Low 3% chance of damaging wind over 30 yrs
- Air quality 3/10 Moderate 2 unhealthy d/yr today · 3 by 30 yrs out
Nearby sold comps map
Loading sold comps map…
Walkable amenities ~0.75 mi
Loading nearby amenities…
Taxation est. · year 1
- Rental income
- $13,417
- − Mortgage interest
- −$5,882
- − Property taxes
- −$252
- − Insurance
- −$525
- − Repairs & maintenance
- −$1,073
- − Management
- −$1,073
- − Depreciation
- −$3,055
- Taxable income
- $1,557
- Est. tax owed @ 24.0%
- −$374
- After-tax cash flow
- $2,841/yr
For passive investors: Depreciation is non-cash, so a rental often shows a tax loss while cash-flowing — sheltering income. Rental losses are passive: they offset passive income freely, and up to $25,000/yr can offset ordinary (W-2) income if you actively participate and your MAGI is under $100k (phasing out to $0 by $150k); unused losses carry forward. On sale, claimed depreciation is recaptured at up to 25%, and gains may owe capital-gains tax (a 1031 exchange can defer both). Figures are a year-1 estimate at your 24.0% rate — not tax advice; consult a CPA.
Schools (NCES district)
- District
- Owensboro Independent
- NCES district ID
- 2104590
- Math proficiency
- 27% ▼ -16.00%
- Reading proficiency
- 36% ▼ -14.00%
- Median HH income
- $33,020
- Composite
- 25.79/100
- National rank
- #7364
- State rank
- #100 of 165 in KY
Livability — Owensboro
- Score
- 71/100
- State rank
- #148
- US rank
- #7153
Category grades
Schools grade is shown separately in the Schools card above.
Census & demographics
- Census place
- Owensboro, KY
- County
- Daviess County · 87,564 people
- City population
- 87,564
- Metro
- Owensboro, KY
- Population (ZIP)
- 45,445
- Household income
- $66,885
- Rent vs Own
- Severe rent burden
- 1228.0
Population outlook (Daviess County) Hauer SSP2
- Today (2025)
- 103,810 people
- By 2030
- 105,722 · +1.8%
- By 2040
- 108,731 · +4.7%
- By 2050
- 110,295 · +6.2%
- By 2075
- 113,056 · +8.9%
- By 2100
- 106,257 · +2.4%
Race, ethnicity, and origin ACS 2023
- Neighborhood character
- Predominantly White (82%)
- Race & ethnicity
- White 82% Black 6% Two or more races 5% Hispanic / Latino 4% Asian 3%
- Common ancestry
- Slovak 3% Italian 1% Romanian 1%
- Foreign-born
- 5% · Canada, Philippines
- Languages at home
- 92% English-only · Spanish 4% Other Asian/Pacific 2%
Political lean MEDSL · Daviess
- 2024 margin
- Solid R (+31.9) · D 33.3% · R 65.2% · Other 1.5%
- 2008→2024 swing
- -21.8pp toward R · 2008: -10.1pp · 2024: -31.9pp
- All cycles
- 2024: R+31.9 2020: R+27.9 2016: R+32.2 2012: R+21.1 2008: R+10.1
Not yet ingested
- Civics
- —
Market trends
- HPI YoY
- ▼ -106.96%
- Current HPI
- 238.2395
- Rent YoY
- —
- Metro
- Owensboro, KY
- State GDP YoY
- ▲ 1.81%
- F500 in state
- 4
Industry mix (Fortune 500 HQ in KY)
| Industry | F500 HQs | Revenue |
|---|---|---|
| Healthcare | 1 | $118B |
|
||
| Food / Beverage | 1 | $7B |
|
||
Price history
+75.3% since first listed11 events — show timeline
- 2026-05-04 Pending — GORAMLS
- 2026-04-19 Relisted — GORAMLS
- 2026-04-19 Price Changed $105,000 GORAMLS
- 2026-04-17 Listed $105,000 GORAMLS
- 2026-03-13 Price Changed $114,000 GORAMLS
- 2026-02-12 Price Changed $119,000 GORAMLS
- 2025-12-02 Price Changed $124,000 GORAMLS
- 2025-11-25 Listed $134,000 GORAMLS
- 2022-07-08 Sold (Public Records) $160,000 Public Records
- 2022-04-27 Sold (MLS) $55,000 GORAMLS
- 2022-03-09 Listed $59,900 GORAMLS
Property tax history
-3.1%/yrLatest (2025): $252 · -3.3% YoY. Source: county tax records.
Cash-flow waterfall
monthlySold comps — $/sqft
last 12 mo · ≤1 miLoading sold comps…