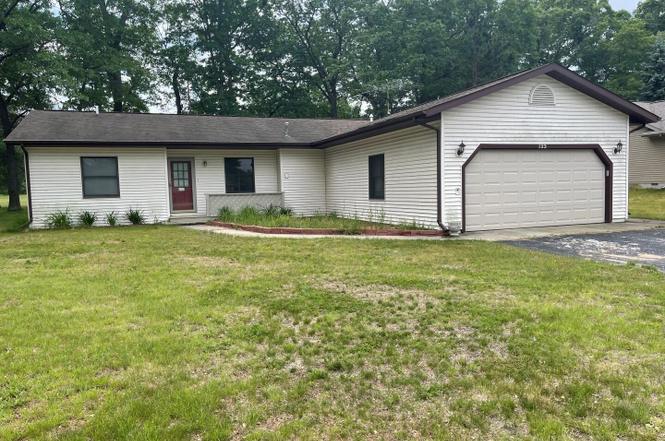
123 Bright Angel Dr · Denton, MI
Flood risk 1/10 · Minimal
- FEMA flood zone
- X (unshaded)
- Chance of flooding over 30 yrs
- 0.0%
- Est. flood insurance / yr
- $473 – $860
Fire risk 3/10 · Minor
- Est. fire insurance / yr
- $784 – $1,456
Heat risk 1/10 · Minimal
- Hot days now (above 93°F)
- 7 days/yr
- Hot days in 30 yrs
- 13 days/yr
Wind risk 1/10 · Minimal
- Chance of severe wind over 30 yrs
- —
Air-quality risk 2/10 · Minimal
- Unhealthy air days now
- 0 days/yr
- Unhealthy air days in 30 yrs
- 1 days/yr
Risk factors via First Street. Map © Google.
Why this score? — see what drove the C+ grade
The composite is a weighted blend of 9 inputs, each scored 0–100. Each bar is that input's sub-score; the figure is the points it added to the 100-point composite (weight × sub-score).
- Cash flow +25.6/30.0
- ARV discount +15.0/15.0
- DSCR +8.5/10.0
- 1% rule +6.2/10.0
- Rent growth +2.5/5.0
- Livability +2.5/5.0
- Condition / age +2.5/5.0
- Schools +2.2/10.0
- Appreciation +0.0/10.0
$169,000
🖨 Deal sheet (PDF) 📄 Offer letter ✓ Due diligence
Listing remarks MLS
LOCATION! LOCATION! LOCATION! If you love to golf, this could be the place for you. Spacious 3 bedroom, 2 full bath, nearly 1400 square foot home right next to the fairway. Ceramic tile foyer takes you to large living room. Arched doorways lead into the kitchen and separate dining room. Large master bedroom and on-suite bath are on the opposite end of the home as the other two bedrooms, creating privacy. Attached 2 car garage and bonus room. Partially furnished for your convenience. Very nice area of well cared for homes, close to everything.
Key facts
- 0.34 acre lot
- 2 garage spots
- Listed 88 days
Property features AI
Exterior
- Parking: Attached 2-car garage
- Utilities: Well water; Public sewer
- Home design: Single-family residence; Residential property
- Construction: Residential lot zoning; Lot dimensions approximately 100 x 150
- Exterior features: Deck; Paved road access
Interior
- Kitchen: Includes refrigerator, oven and range
- Bathrooms: Two full bathrooms
- Heating & cooling: Forced air heating; Natural gas heating
- Interior features: Refrigerator, Oven, Range; Crawl space basement
- Laundry & utility: Laundry on main level
Neighborhood map
What this means for you Summary
Snapshot
- This is a 3-bed/1.5-bath single-family listed at $169k.
Deal economics
- At list price, monthly cash flow is $399 ($5k/yr) — positive.
- The deal already cash-flows at list — no discount required.
- Meets the 1% rule at list price ($2k rent vs $169k).
- Recommended offer: $159k (6.0% below list) — sets the bar for market timing.
Location & tenants
- Location reads: area grade C — affects rentability + tenant quality, not the cash-flow math above.
- Houghton Lake Community Schools (rural): math 18% / reading 36% proficiency, ranked #410 of 540 in MI (top 76%) — low school quality limits family demand, transient renter base, plan for 1-2y turnover.
- Zoned schools: Collins Elementary School (math 21% / reading 35%, grade F, #918 of 1,397 statewide, top 66%, 555 students, 76% FRL); Houghton Lake Jrsr High School (math 17% / reading 37%, grade F, #462 of 713 statewide, top 66%, 511 students, 71% FRL) — zoned schools average 74% FRL vs 57% district-wide (17 pts higher); higher-poverty schools than district average — tighter screening recommended.
- Market conditions: 86 active listings in the ZIP; 73 units permitted in Roscommon County in 2024 (0 in 5+ unit buildings).
Forward outlook
- Local home prices are declining (-3.0%/yr); year-one equity from $1k of loan paydown is wiped out by about $5k of value loss. Plan a longer hold.
- Roscommon County population projected at -21% by 2050 — secular population decline; favor cash flow + early exit over multi-decade hold.
Negotiation context
- It's been on market 89 days — a 6% lower offer ($159k) is reasonable based on typical stale-listing flexibility.
- Current owner paid $79k; list at $169k implies a 114% gain — meaningful room to come down on a strong offer.
Questions for the listing agent
- It's been on market 89 days. Have you received any prior offers? Is the seller open to a 6% concession, seller financing, or rate buy-down credit?
- Why hasn't it sold? Are there any deal-killer items the seller is aware of (foundation, flood, title, zoning, code violations)?
- Is there a deadline driving the sale (1031 exchange, divorce, estate, relocation)? That informs how much negotiation room exists.
- What's the average days-on-market for RENTAL listings here right now (not sales)? A rising rental-DOM trend means longer vacancies and softer asking-rent achievability than the comps imply.
- What's the recent tenant-quality profile in this submarket — average credit score on applications, eviction rate, late-payment / NSF rate, and stable-employment percentage? A property-management company in the area should have these aggregated.
- How much new for-sale + rental construction is in the pipeline within 1–3 miles? Heavy new supply typically softens prices + rents 12–24 months out; constrained supply supports both.
Investment metrics
- 1% rule
- 1.12% ✓
- Cap rate
- 9.12%
- Cash-on-cash
- 10.11%
- DSCR
- 1.45
- GRM
- 7.5
CMA / ARV
- ARV (on-the-fly)
- $267,344
- Comps found
- 12
Show comp detail 12 sales within ~0.75 mi
| Address | Dist | Beds/Ba | Sqft | Sold | Price | $/sf | Match |
|---|---|---|---|---|---|---|---|
| 128 White Deer Trl | 0.42mi | 3/2.0 | 1,310 (-4%) | 10mo | $257,000 | $196 | 64 |
| 2580 W Nestel Rd | 0.36mi | 3/2.0 | 1,248 (-8%) | 4mo | $163,850 | $131 | 63 |
| 311 Iroquois Ave | 0.45mi | 2/2.0 (-1) | 1,288 (-6%) | 1mo | $236,000 | $183 | 62 |
| 308 Sullivan Ave | 0.60mi | 3/1.5 | 1,290 (-5%) | 1mo | $229,900 | $178 | 62 |
| 105 Ashwood Dr | 0.45mi | 3/2.0 | 1,300 (-5%) | 9mo | $225,000 | $173 | 61 |
| 308 Sullivan Ave | 0.57mi | 2/1.5 (-1) | 1,290 (-5%) | 1mo | $229,900 | $178 | 58 |
| 300 White Fawn Ct | 0.63mi | 3/3.0 | 1,360 (-0%) | 12mo | $325,000 | $239 | 54 |
| 458 Ottawa Ln | 0.73mi | 2/1.5 (-1) | 1,344 (-2%) | 10mo | $359,500 | $267 | 51 |
| 115 13th St | 0.33mi | 2/1.0 (-1) | 1,182 (-13%) | 8mo | $145,000 | $123 | 49 |
| 207 Dogwood Dr | 0.35mi | 4/1.5 (+1) | 1,215 (-11%) | 20mo | $241,000 | $198 | 44 |
| 114 Canal Dr | 0.74mi | 2/2.0 (-1) | 1,472 (+8%) | 8mo | $520,000 | $353 | 38 |
| 310 White Fawn Ct | 0.70mi | 3/2.0 | 1,552 (+14%) | 15mo | $309,900 | $200 | 30 |
Match score weights: distance 35% · size 25% · config 20% · recency 20%. Top-matched comps best support the ARV.
Projected returns pro-forma
-3.0% appreciation · 3.0% rent growth · sell at horizon
- IRR
- -1.1%
- Equity multiple
- 0.96×
- Total profit
- $-2,013
- Equity at exit
- $25,198
- IRR
- 8.5%
- Equity multiple
- 1.65×
- Total profit
- $30,865
- Equity at exit
- $14,612
Cash invested: $47,320 (down + closing). Projections, not guarantees.
Landlord ↔ Tenant lean methodology
- Overall (STATE)
- 62 Landlord-Friendly
- State Michigan
- 62 Landlord-Friendly · EVEN
- County
- — inherits STATE
- City
- — inherits STATE
ZIP-level market 48651
- Home prices YoY
- -25.6%
- Active inventory
- 86
- Price-to-rent
- 7.5×
Monthly cashflow live
- Estimated rent
- $1,885 medium interval (Pro) →
- Mortgage (P&I)
- −$886
- Tax from tax record
- −$134 /mo · $1,604/yr
- Insurance
- −$70
- HOA
- −$0
- Lot rent
- −$0
- Vacancy / Maint / Mgmt
- −$396
- Net cashflow
- $399
Break-even live
Sensitivity live
| Price | -10% $494 | -5% $447 | +0% $399 | +5% $351 | +10% $303 |
|---|---|---|---|---|---|
| Rent | -10% $250 | -5% $324 | +0% $399 | +5% $473 | +10% $548 |
| Rate | -1.0pp $484 | -0.5pp $442 | base $399 | +0.5pp $355 | +1.0pp $310 |
UW: 25.0% down · 7.5% · 30yr · 1.5% tax · 5.0% vac · 8.0% maint · 8.0% mgmt
Financing live
Cash to close
- Down payment
- $42,250
- Closing costs
- $5,070
- Reserves months
- —
- Total cash needed
- —
Loan-product check · same deal, 3 products live
Conventional
25% down · 7.5% · 30yr
- Down + closing
- —
- Monthly P&I
- —
- Monthly cashflow
- —
- DSCR
- —
- Eligible?
- —
Personal DTI + credit; lowest rate.
DSCR
20% down · 8.5% · 30yr
- Down + closing
- —
- Monthly P&I
- —
- Monthly cashflow
- —
- DSCR
- —
- Eligible?
- —
No personal income docs; deal must DSCR.
Hard money
10% down · 12.0% · 12mo
- Down + closing
- —
- Monthly P&I
- —
- Monthly cashflow
- —
- DSCR
- —
- Eligible?
- —
Short-term bridge; refi at stabilization.
Listing history 22 events
-
2026-06-22days on market $169,000 Active 89 DOM
-
2026-06-21days on market $169,000 Active 88 DOM
-
2026-06-21days on market $169,000 Active 87 DOM
-
2026-06-18days on market $169,000 Active 85 DOM
-
2026-06-17days on market $169,000 Active 84 DOM
-
2026-06-16days on market $169,000 Active 83 DOM
-
2026-06-15days on market $169,000 Active 82 DOM
-
2026-06-13days on market $169,000 Active 80 DOM
-
2026-06-12statusdays on market $169,000 Active 79 DOM
-
2026-06-09days on market $169,000 Active Under Contract 76 DOM
-
2026-06-08days on market $169,000 Active Under Contract 75 DOM
-
2026-06-07days on market $169,000 Active Under Contract 74 DOM
-
2026-06-07days on market $169,000 Active Under Contract 73 DOM
-
2026-06-04days on market $169,000 Active Under Contract 70 DOM
-
2026-06-02days on market $169,000 Active Under Contract 69 DOM
-
2026-06-01days on market $169,000 Active Under Contract 68 DOM
-
2026-05-31days on market $169,000 Active Under Contract 67 DOM
-
2026-05-31days on market $169,000 Active Under Contract 66 DOM
-
2026-04-19historical Active Under Contract
-
2026-03-24$169,000 Active
-
2014-11-04soldstatus $79,000
-
2014-10-30soldstatus $79,000 548-char remark
Show marketing remark (548 chars)
LOCATION! LOCATION! LOCATION! If you love to golf, this could be the place for you. Spacious 3 bedroom, 2 full bath, nearly 1400 square foot home right next to the fairway. Ceramic tile foyer takes you to large living room. Arched doorways lead into the kitchen and separate dining room. Large master bedroom and on-suite bath are on the opposite end of the home as the other two bedrooms, creating privacy. Attached 2 car garage and bonus room. Partially furnished for your convenience. Very nice area of well cared for homes, close to everything.
ⓘ Source: listings_history table (triggers on properties + properties_extension) + one-shot
backfill from property_details.listing_events for pre-trigger history.
Tax reassessment forecast MI · Partial reset (capped growth)
- Current annual tax
- $1,604 · $134/mo
- Projected year-2 tax
- $2,103 · $175/mo
- Expected delta
- +$499/yr (+$42/mo · 31.1%)
ⓘ Screening estimate from a state-policy table — verify with the county assessor before closing.
Climate risk First Street
- Flood 1/10 Low FEMA zone X (unshaded) · 0% chance over 30 yrs
- Wildfire 3/10 Moderate
- Heat 1/10 Low 7 d/yr ≥93°F today · 13 d/yr by 30 yrs out
- Wind 1/10 Low
- Air quality 2/10 Low 0 unhealthy d/yr today · 1 by 30 yrs out
Nearby sold comps map
Loading sold comps map…
Walkable amenities ~0.75 mi
Loading nearby amenities…
Taxation est. · year 1
- Rental income
- $22,618
- − Mortgage interest
- −$9,467
- − Property taxes
- −$1,604
- − Insurance
- −$845
- − Repairs & maintenance
- −$1,809
- − Management
- −$1,809
- − Depreciation
- −$4,916
- Taxable income
- $2,167
- Est. tax owed @ 24.0%
- −$520
- After-tax cash flow
- $4,264/yr
For passive investors: Depreciation is non-cash, so a rental often shows a tax loss while cash-flowing — sheltering income. Rental losses are passive: they offset passive income freely, and up to $25,000/yr can offset ordinary (W-2) income if you actively participate and your MAGI is under $100k (phasing out to $0 by $150k); unused losses carry forward. On sale, claimed depreciation is recaptured at up to 25%, and gains may owe capital-gains tax (a 1031 exchange can defer both). Figures are a year-1 estimate at your 24.0% rate — not tax advice; consult a CPA.
Schools (NCES district)
- District
- Houghton Lake Community Schools
- NCES district ID
- 2618600
- Math proficiency
- 18% ▼ -7.00%
- Reading proficiency
- 36% ▼ -3.00%
- Median HH income
- $34,744
- Composite
- 22.19/100
- National rank
- #8158
- State rank
- #410 of 540 in MI
Livability — Denton
No livability data for this city. (Only ~50 U.S. cities are tracked.)
Census & demographics
- Census place
- Prudenville, MI
- Population (ZIP)
- 4,331
Population outlook (Roscommon County) Hauer SSP2
- Today (2025)
- 22,249 people
- By 2030
- 21,206 · -4.7%
- By 2040
- 19,070 · -14.3%
- By 2050
- 17,564 · -21.1%
- By 2075
- 15,420 · -30.7%
- By 2100
- 13,168 · -40.8%
Race, ethnicity, and origin ACS 2023
- Neighborhood character
- Predominantly White (94%)
- Race & ethnicity
- White 94% Two or more races 4% Hispanic / Latino 1%
- Common ancestry
- Romanian 9% Slovak 4% Iranian 4%
- Foreign-born
- 2%
- Languages at home
- 98% English-only · Spanish 1%
Political lean MEDSL · Roscommon
- 2024 margin
- Solid R (+32.9) · D 32.9% · R 65.9% · Other 1.2%
- 2008→2024 swing
- -35.5pp toward R · 2008: 2.5pp · 2024: -32.9pp
- All cycles
- 2024: R+32.9 2020: R+30.0 2016: R+29.6 2012: R+3.9 2008: D+2.5
Not yet ingested
- Civics
- —
Market trends
- HPI YoY
- ▼ -87.27%
- Current HPI
- 252.9662
- Rent YoY
- —
- Metro
- —
- State GDP YoY
- ▲ 1.37%
- F500 in state
- 28
Industry mix (Fortune 500 HQ in MI)
| Industry | F500 HQs | Revenue |
|---|---|---|
| Automotive Parts | 3 | $48B |
|
||
| Automotive | 2 | $372B |
|
||
| Chemicals | 1 | $45B |
|
||
| Automotive Retail | 1 | $29B |
|
||
| Healthcare / Medical Devices | 1 | $23B |
|
||
| Automotive Technology | 1 | $20B |
|
||
Price history
+113.9% since first listed4 events — show timeline
- 2026-04-19 Contingent — WWMLS
- 2026-03-24 Listed $169,000 WWMLS
- 2014-11-04 Sold (Public Records) $79,000 Public Records
- 2014-10-30 Sold (MLS) $79,000 WWMLS
Property tax history
-1.9%/yrLatest (2025): $1,604 · +2.7% YoY. Source: county tax records.
Cash-flow waterfall
monthlySold comps — $/sqft
last 12 mo · ≤1 miLoading sold comps…