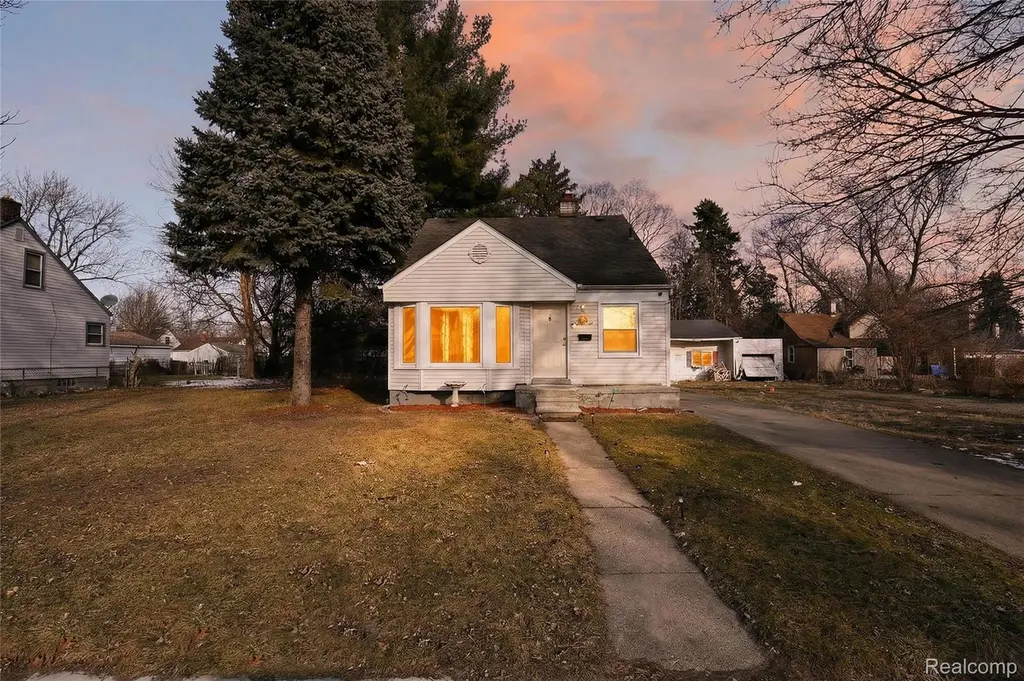
7296 Dacosta · Detroit, MI
Flood risk 1/10 · Minimal
- FEMA flood zone
- X (unshaded)
- Chance of flooding over 30 yrs
- 0.0%
- Est. flood insurance / yr
- $473 – $860
Fire risk 1/10 · Minimal
- Est. fire insurance / yr
- $784 – $1,456
Heat risk 3/10 · Minor
- Hot days now (above 99°F)
- 7 days/yr
- Hot days in 30 yrs
- 15 days/yr
Wind risk 2/10 · Minimal
- Chance of severe wind over 30 yrs
- —
Air-quality risk 2/10 · Minimal
- Unhealthy air days now
- 1 days/yr
- Unhealthy air days in 30 yrs
- 2 days/yr
Risk factors via First Street. Map © Google.
Why this score? — see what drove the C- grade
The composite is a weighted blend of 9 inputs, each scored 0–100. Each bar is that input's sub-score; the figure is the points it added to the 100-point composite (weight × sub-score).
- Cash flow +26.4/30.0
- DSCR +9.0/10.0
- 1% rule +8.6/10.0
- Livability +3.7/5.0
- Rent growth +3.3/5.0
- Condition / age +2.5/5.0
- Schools +1.3/10.0
- ARV discount +0.0/15.0
- Appreciation +0.0/10.0
$114,900
🖨 Deal sheet 📄 Offer letter ✓ Due diligence
Listing remarks MLS
Turnkey, income-producing bungalow in Detroit with a long-term tenant paying $1,400 per month. Tenant is currently month-to-month with a solid payment history and takes excellent care of the property. Immediate cash flow from day one. This well-maintained home features beautiful hardwood floors, a spacious living room filled with natural light, an updated kitchen with ample cabinet space, a dedicated dining area, and generously sized bedrooms. The upper level offers additional living space perfect for a primary suite, office, or flex area. Clean, functional bathroom and solid mechanicals. Exterior highlights include a large yard, private driveway, and rear deck. Great layout, strong rental appeal, and consistent tenant performance make this an ideal addition to any rental portfolio. Property is subject to tenant rights. Showings available with notice. Do not approach tenant.
Key facts
- Private driveway
- Large yard
- Updated kitchen
Tags
Neighborhood map
What this means for you Summary
Snapshot
- This is a 3-bed/1.0-bath single-family listed at $115k.
Deal economics
- At list price, monthly cash flow is $302 ($4k/yr) — positive.
- The deal already cash-flows at list — no discount required.
- Meets the 1% rule at list price ($2k rent vs $115k).
- Recommended offer: $105k (9.0% below list) — sets the bar for market timing.
Location & tenants
- Location reads 73/100 on livability (#218 in MI) — a middle-class / working-renter tenant base. Strengths: amenities A+, commute A+, cost of living A+; Watch: schools F, crime F, employment F.
- Detroit Public Schools Community District (urban): math 10% / reading 24% proficiency, ranked #499 of 540 in MI (top 92%) — low school quality limits family demand, transient renter base, plan for 1-2y turnover; 90% free/reduced lunch — lower-income household profile, screen leases tightly.
- Market conditions: Rents rising (+3.2%/yr); 188 active listings in the ZIP; 19 comparable units currently listed for rent nearby; rentals at typical pace (median 18d on market — plan ~3-4 weeks tenant-placement turnaround); 42% of comp listings sitting > 30 days — soft ceiling on asking rent; 2,639 units permitted in Wayne County in 2024 (1,216 in 5+ unit buildings).
Forward outlook
- Local home prices are declining (-3.0%/yr); year-one equity from $794 of loan paydown is wiped out by about $3k of value loss. Plan a longer hold.
- Wayne County population projected at -17% by 2050 — secular population decline; favor cash flow + early exit over multi-decade hold.
- At projected returns (-3.0% appreciation + 3.2% rent growth), your $32k cash investment doubles in ~10 years — after that, you're playing with house money.
Negotiation context
- It's been on market 110 days — a 9% lower offer ($105k) is reasonable based on typical stale-listing flexibility.
- 8 sale attempts since 27y ago; this cycle's ask has dropped $10k (8%) from the opening price — seller is motivated, your offer sets the floor, not the list.
Risks & watch-outs
- Watch-outs: property tax is 3.0% of price; built in 1954 — expect roof / HVAC / electrical / plumbing capex.
Questions for the listing agent
- It's been on market 110 days. Have you received any prior offers? Is the seller open to a 9% concession, seller financing, or rate buy-down credit?
- Built in 1954 — when were the roof, HVAC, electrical panel, plumbing, and water heater last replaced?
- Property tax is high relative to price — has the assessment been appealed recently, and will the sale trigger a re-assessment?
- Why hasn't it sold? Are there any deal-killer items the seller is aware of (foundation, flood, title, zoning, code violations)?
- Is there a deadline driving the sale (1031 exchange, divorce, estate, relocation)? That informs how much negotiation room exists.
- Schools are F-rated, which usually means shorter tenancies and higher turnover. Who's the typical renter profile here, and what's been the actual vacancy rate?
- Crime grade is F in this area — have there been break-ins, vandalism, or insurance claims at this property in the last 3 years? What carrier currently insures it and at what premium?
- What's the average days-on-market for RENTAL listings here right now (not sales)? A rising rental-DOM trend means longer vacancies and softer asking-rent achievability than the comps imply.
- What's the recent tenant-quality profile in this submarket — average credit score on applications, eviction rate, late-payment / NSF rate, and stable-employment percentage? A property-management company in the area should have these aggregated.
- How much new for-sale + rental construction is in the pipeline within 1–3 miles? Heavy new supply typically softens prices + rents 12–24 months out; constrained supply supports both.
Investment metrics
- 1% rule
- 1.36% ✓
- Cap rate
- 9.45%
- Cash-on-cash
- 11.26%
- DSCR
- 1.50
- GRM
- 6.1
CMA / ARV
- ARV (median comp)
- $83,717
- List price
- $114,900
- Delta
- 37.25%
- Verdict
- OVERPRICED
- Comps
- 20 within 1.0 mi
Show comp detail 12 sales within ~0.75 mi
| Address | Dist | Beds/Ba | Sqft | Sold | Price | $/sf | Match |
|---|---|---|---|---|---|---|---|
| 7267 Rockdale | 0.10mi | 3/2.0 | 1,028 (-0%) | 3mo | $85,000 | $83 | 88 |
| 7483 Dacosta | 0.15mi | 3/1.5 | 1,010 (-2%) | 10mo | $120,000 | $119 | 79 |
| 6622 Dolphin | 0.41mi | 3/1.0 | 1,057 (+2%) | 2mo | $170,000 | $161 | 75 |
| 7311 Chatham | 0.15mi | 3/1.0 | 1,150 (+12%) | 7mo | $85,000 | $74 | 68 |
| 7611 Parkland | 0.29mi | 2/1.0 (-1) | 990 (-4%) | 12mo | $46,000 | $46 | 65 |
| 7568 Hazelton St | 0.43mi | 3/1.0 | 960 (-7%) | 5mo | $141,000 | $147 | 64 |
| 8109 Beaverland St | 0.60mi | 3/1.0 | 1,082 (+5%) | 1mo | $105,000 | $97 | 63 |
| 8218 Beaverland St | 0.69mi | 3/1.0 | 1,058 (+3%) | 3mo | $160,000 | $151 | 61 |
| 7845 Parkland | 0.39mi | 4/2.0 (+1) | 949 (-8%) | 5mo | $128,000 | $135 | 56 |
| 7701 Dacosta | 0.33mi | 3/1.5 | 1,150 (+12%) | 11mo | $154,400 | $134 | 54 |
| 8275 Beaverland St | 0.75mi | 3/2.0 | 1,158 (+12%) | 2mo | $159,900 | $138 | 39 |
| 8156 Grayfield St | 0.72mi | 2/1.0 (-1) | 1,172 (+14%) | 11mo | $197,000 | $168 | 29 |
Match score weights: distance 35% · size 25% · config 20% · recency 20%. Top-matched comps best support the ARV.
Projected returns pro-forma
-3.0% appreciation · 3.25% rent growth · sell at horizon
- IRR
- 0.9%
- Equity multiple
- 1.03×
- Total profit
- $1,117
- Equity at exit
- $17,132
- IRR
- 10.9%
- Equity multiple
- 1.86×
- Total profit
- $27,809
- Equity at exit
- $9,934
Cash invested: $32,172 (down + closing). Projections, not guarantees.
Landlord ↔ Tenant lean methodology
- Overall (STATE)
- 62 Landlord-Friendly
- State Michigan
- 62 Landlord-Friendly · EVEN
- County
- — inherits STATE
- City
- — inherits STATE
ZIP-level market 48239
- Rents YoY
- 3.2%
- Active inventory
- 188
- Price-to-rent
- 6.1×
Monthly cashflow live
- Estimated rent
- $1,565 high interval (Pro) →
- Mortgage (P&I)
- −$603
- Tax from tax record
- −$284 /mo · $3,406/yr
- Insurance
- −$48
- HOA
- −$0
- Vacancy / Maint / Mgmt
- −$329
- Net cashflow
- $302
Break-even live
UW: 25.0% down · 7.5% · 30yr · 1.5% tax · 5.0% vac · 8.0% maint · 8.0% mgmt
Financing live
Cash to close
- Down payment
- $28,725
- Closing costs
- $3,447
- Reserves months
- —
- Total cash needed
- —
Loan-product check · same deal, 3 products live
Conventional
25% down · 7.5% · 30yr
- Down + closing
- —
- Monthly P&I
- —
- Monthly cashflow
- —
- DSCR
- —
- Eligible?
- —
Personal DTI + credit; lowest rate.
DSCR
20% down · 8.5% · 30yr
- Down + closing
- —
- Monthly P&I
- —
- Monthly cashflow
- —
- DSCR
- —
- Eligible?
- —
No personal income docs; deal must DSCR.
Hard money
10% down · 12.0% · 12mo
- Down + closing
- —
- Monthly P&I
- —
- Monthly cashflow
- —
- DSCR
- —
- Eligible?
- —
Short-term bridge; refi at stabilization.
Rent comps 19 comps
| Address | Beds | Baths | Sqft | Rent | $/sqft | DOM | Units | Dist |
|---|---|---|---|---|---|---|---|---|
| 22330 W Warren Ave Redford Charter Twp, MI | 2.0 | 1.0 | 750 | $1,200 | $1.60 | 43d | 1 | 0.08mi |
| 7618 Hazelton St Dearborn Heights, MI | 3.0 | 1.0 | 1310 | $1,700 | $1.30 | 17d | 1 | 0.47mi |
| 8254 W Parkway St Redford, MI | 3.0 | 1.0 | 1220 | $1,350 | $1.11 | 12d | 1 | 0.76mi |
| 7265 Braile St Detroit, MI | 3.0 | 1.0 | 1200 | $1,499 | $1.25 | 24d | 1 | 0.78mi |
| 6874 Country Ln Dearborn Heights, MI | 2.0 | 1.5 | 1400 | $1,500 | $1.07 | 43d | 1 | 0.86mi |
| 8270 Trinity St Detroit, MI | 3.0 | 1.0 | 806 | $1,528 | $1.90 | 43d | 1 | 0.88mi |
| 6978 Mayburn St Dearborn Heights, MI | 3.0 | 2.0 | 1250 | $1,800 | $1.44 | 43d | 1 | 0.89mi |
| 7411 Stout St Detroit, MI | 3.0 | 1.0 | 888 | $1,428 | $1.61 | 12d | 1 | 0.93mi |
| 20571 Brooklawn Dr Dearborn Heights, MI | 3.0 | 2.0 | 1254 | $1,850 | $1.48 | 43d | 1 | 0.94mi |
| 7420 Drexel St Dearborn Heights, MI | 2.0 | 1.0 | 1080 | $1,700 | $1.57 | 17d | 1 | 0.94mi |
| 7420 Drexel St Dearborn Heights, MI | 2.0 | 1.0 | 1080 | $1,600 | $1.48 | 4d | 1 | 0.94mi |
| 7420 Drexel St Dearborn Heights, MI | 2.0 | 1.0 | 1080 | $1,700 | $1.57 | 43d | 1 | 0.94mi |
| 20431 Tireman St Detroit, MI | 3.0 | 1.0 | 1020 | $1,350 | $1.32 | 17d | 1 | 1.00mi |
| 7462 N Vernon St Dearborn Heights, MI | 4.0 | 1.0 | 1113 | $1,900 | $1.71 | 1d | 1 | 1.01mi |
| 7794 Vaughan St Detroit, MI | 3.0 | 1.0 | 1000 | $1,450 | $1.45 | 16d | 1 | 1.14mi |
| 8187 Lenore St Dearborn Heights, MI | 2.0 | 1.0 | 768 | $1,550 | $2.02 | 43d | 1 | 1.21mi |
| 8283 Vaughan St Detroit, MI | 3.0 | 1.0 | 1058 | $1,294 | $1.22 | 5d | 1 | 1.24mi |
| 9059 Burt Rd Detroit, MI | 3.0 | 1.0 | 980 | $1,400 | $1.43 | 43d | 1 | 1.31mi |
| 5965 Evergreen Rd Dearborn Heights, MI | 1.0–2.0 | 1.0 | 825 | $1,350 | $1.64 | 5d | 1 | 1.36mi |
Listing history 35 events
-
2026-06-18days on market $114,900 Active 110 DOM
-
2026-06-17days on market $114,900 Active 109 DOM
-
2026-06-15days on market $114,900 Active 107 DOM
-
2026-06-13days on market $114,900 Active 105 DOM
-
2026-06-13days on market $114,900 Active 104 DOM
-
2026-06-09days on market $114,900 Active 101 DOM
-
2026-06-08days on market $114,900 Active 100 DOM
-
2026-06-07days on market $114,900 Active 99 DOM
-
2026-06-04days on market $114,900 Active 96 DOM
-
2026-06-03days on market $114,900 Active 95 DOM
-
2026-06-01days on market $114,900 Active 93 DOM
-
2026-05-31days on market $114,900 Active 92 DOM
-
2026-05-18price $114,900 887-char remark
Show marketing remark (887 chars)
Turnkey, income-producing bungalow in Detroit with a long-term tenant paying $1,400 per month. Tenant is currently month-to-month with a solid payment history and takes excellent care of the property. Immediate cash flow from day one. This well-maintained home features beautiful hardwood floors, a spacious living room filled with natural light, an updated kitchen with ample cabinet space, a dedicated dining area, and generously sized bedrooms. The upper level offers additional living space perfect for a primary suite, office, or flex area. Clean, functional bathroom and solid mechanicals. Exterior highlights include a large yard, private driveway, and rear deck. Great layout, strong rental appeal, and consistent tenant performance make this an ideal addition to any rental portfolio. Property is subject to tenant rights. Showings available with notice. Do not approach tenant.
-
2026-02-27$125,000 Active 887-char remark
Show marketing remark (887 chars)
Turnkey, income-producing bungalow in Detroit with a long-term tenant paying $1,400 per month. Tenant is currently month-to-month with a solid payment history and takes excellent care of the property. Immediate cash flow from day one. This well-maintained home features beautiful hardwood floors, a spacious living room filled with natural light, an updated kitchen with ample cabinet space, a dedicated dining area, and generously sized bedrooms. The upper level offers additional living space perfect for a primary suite, office, or flex area. Clean, functional bathroom and solid mechanicals. Exterior highlights include a large yard, private driveway, and rear deck. Great layout, strong rental appeal, and consistent tenant performance make this an ideal addition to any rental portfolio. Property is subject to tenant rights. Showings available with notice. Do not approach tenant.
-
2024-03-18soldstatus $105,000
-
2024-03-05soldstatus $105,000 Sold
-
2024-03-05soldstatus $105,000 Closed
-
2024-02-27status Pending
-
2024-02-27status Pending
-
2024-02-14price $109,900
-
2024-02-13price $109,900
-
2024-01-13$119,900 Active
-
2024-01-13$119,900 Active
-
2008-12-22soldstatus $12,250
-
2008-12-22soldstatus $12,250
-
2008-11-13historical
-
2008-10-17$17,900
-
2008-10-17$17,900
-
2007-11-30historical
-
2007-05-29$110,000
-
2002-05-13soldstatus $102,820
-
1999-06-11soldstatus $77,000
-
1999-04-13$83,000
ⓘ Source: listings_history table (triggers on properties + properties_extension) + one-shot
backfill from property_details.listing_events for pre-trigger history.
Tax reassessment forecast MI · Partial reset (capped growth)
- Current annual tax
- $3,406 · $284/mo
- Projected year-2 tax
- $3,406 · $284/mo
- Expected delta
- $0/yr ($0/mo · 0.0%)
ⓘ Screening estimate from a state-policy table — verify with the county assessor before closing.
Climate risk First Street
- Flood 1/10 Low FEMA zone X (unshaded) · 0% chance over 30 yrs
- Wildfire 1/10 Low
- Heat 3/10 Moderate 7 d/yr ≥99°F today · 15 d/yr by 30 yrs out
- Wind 2/10 Low
- Air quality 2/10 Low 1 unhealthy d/yr today · 2 by 30 yrs out
Nearby sold comps map
Loading sold comps map…
Walkable amenities ~0.75 mi
Loading nearby amenities…
Taxation est. · year 1
- Rental income
- $18,777
- − Mortgage interest
- −$6,436
- − Property taxes
- −$3,406
- − Insurance
- −$574
- − Repairs & maintenance
- −$1,502
- − Management
- −$1,502
- − Depreciation
- −$3,343
- Taxable income
- $2,014
- Est. tax owed @ 24.0%
- −$483
- After-tax cash flow
- $3,140/yr
For passive investors: Depreciation is non-cash, so a rental often shows a tax loss while cash-flowing — sheltering income. Rental losses are passive: they offset passive income freely, and up to $25,000/yr can offset ordinary (W-2) income if you actively participate and your MAGI is under $100k (phasing out to $0 by $150k); unused losses carry forward. On sale, claimed depreciation is recaptured at up to 25%, and gains may owe capital-gains tax (a 1031 exchange can defer both). Figures are a year-1 estimate at your 24.0% rate — not tax advice; consult a CPA.
Schools (NCES district)
- District
- Detroit Public Schools Community District
- NCES district ID
- 2601103
- Math proficiency
- 10% ▼ -2.00%
- Reading proficiency
- 24% ▲ 6.00%
- Median HH income
- $25,815
- Composite
- 13.06/100
- National rank
- #9564
- State rank
- #499 of 540 in MI
Livability — Detroit
- Score
- 73/100
- State rank
- #218
- US rank
- #5427
Category grades
Schools grade is shown separately in the Schools card above.
Census & demographics
- Census place
- Detroit, MI
- County
- Wayne County · 1,562,939 people
- City population
- 572,865
- Metro
- Detroit-Warren-Dearborn, MI
- Population (ZIP)
- 36,976
- Household income
- $71,151
- Rent vs Own
- Severe rent burden
- 1052.0
Population outlook (Wayne County) Hauer SSP2
- Today (2025)
- 1,675,273 people
- By 2030
- 1,620,300 · -3.3%
- By 2040
- 1,502,341 · -10.3%
- By 2050
- 1,384,039 · -17.4%
- By 2075
- 1,124,592 · -32.9%
- By 2100
- 881,193 · -47.4%
Race, ethnicity, and origin ACS 2023
- Neighborhood character
- Majority Black (58%)
- Race & ethnicity
- Black 58% White 34% Hispanic / Latino 4% Two or more races 4%
- Common ancestry
- Romanian 7% Slovak 2% Lithuanian 2%
- Foreign-born
- 2% · Canada
- Languages at home
- 96% English-only · Spanish 1% Other Indo-European 1% Arabic 1%
Political lean MEDSL · Wayne
- 2024 margin
- Strong D (+29.0) · D 62.7% · R 33.7% · Other 3.6%
- 2008→2024 swing
- -20.5pp toward R · 2008: 49.5pp · 2024: 29.0pp
- All cycles
- 2024: D+29.0 2020: D+38.1 2016: D+37.3 2012: D+46.9 2008: D+49.5
Not yet ingested
- Civics
- —
Market trends
- HPI YoY
- ▼ -202.97%
- Current HPI
- 236.1136
- Rent YoY
- ▲ 3.25%
- Metro
- Detroit-Warren-Dearborn, MI
- State GDP YoY
- ▲ 1.37%
- F500 in state
- 28
Industry mix (Fortune 500 HQ in MI)
| Industry | F500 HQs | Revenue |
|---|---|---|
| Automotive Parts | 3 | $48B |
|
||
| Automotive | 2 | $372B |
|
||
| Chemicals | 1 | $45B |
|
||
| Automotive Retail | 1 | $29B |
|
||
| Healthcare / Medical Devices | 1 | $23B |
|
||
| Automotive Technology | 1 | $20B |
|
||
Price history
+38.4% since first listed23 events — show timeline
- 2026-05-18 Price Changed $114,900 MiRealSource-MiMLS
- 2026-05-18 Price Changed $114,900 REALCOMP
- 2026-02-27 Listed $125,000 REALCOMP
- 2026-02-27 Listed $125,000 MiRealSource-MiMLS
- 2024-03-18 Sold (Public Records) $105,000 Public Records
- 2024-03-05 Sold (MLS) $105,000 MiRealSource-MiMLS
- 2024-03-05 Sold (MLS) $105,000 REALCOMP
- 2024-02-27 Pending — MiRealSource-MiMLS
- 2024-02-27 Pending — REALCOMP
- 2024-02-14 Price Changed $109,900 MiRealSource-MiMLS
- 2024-02-13 Price Changed $109,900 REALCOMP
- 2024-01-13 Listed $119,900 MiRealSource-MiMLS
- 2024-01-13 Listed $119,900 REALCOMP
- 2008-12-22 Sold (MLS) $12,250 REALCOMP
- 2008-12-22 Sold (MLS) $12,250 MiRealSource-MiMLS
- 2008-11-13 Listing Removed — MiRealSource-MiMLS
- 2008-10-17 Listed $17,900 REALCOMP
- 2008-10-17 Listed $17,900 MiRealSource-MiMLS
- 2007-11-30 Listing Removed — REALCOMP
- 2007-05-29 Listed $110,000 REALCOMP
- 2002-05-13 Sold (Public Records) $102,820 Public Records
- 1999-06-11 Sold (MLS) $77,000 REALCOMP
- 1999-04-13 Listed $83,000 REALCOMP
Property tax history
+6.0%/yrLatest (2025): $3,406 · +56.8% YoY. Source: county tax records.
Cash-flow waterfall
monthlySold comps — $/sqft
last 12 mo · ≤1 miLoading sold comps…