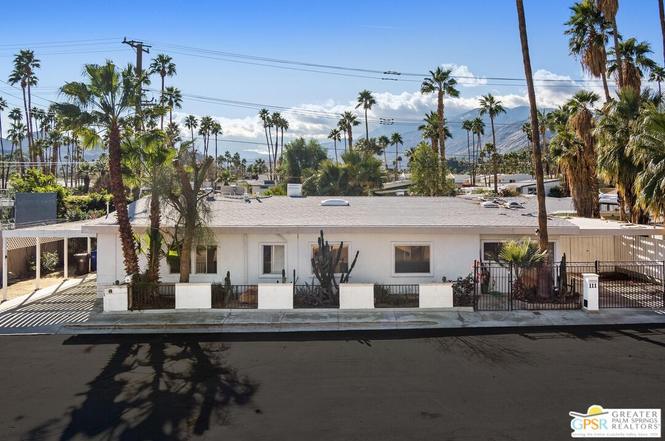
111 Canyon Rock Rd · Palm Springs, CA
Flood risk 1/10 · Minimal
- FEMA flood zone
- X (shaded)
- Chance of flooding over 30 yrs
- 0.0%
- Est. flood insurance / yr
- $507 – $1,088
Fire risk 5/10 · Moderate
- Est. fire insurance / yr
- $659 – $1,223
Heat risk 9/10 · Severe
- Hot days now (above 110°F)
- 9 days/yr
- Hot days in 30 yrs
- 27 days/yr
Wind risk 1/10 · Minimal
- Chance of severe wind over 30 yrs
- —
Air-quality risk 5/10 · Moderate
- Unhealthy air days now
- 6 days/yr
- Unhealthy air days in 30 yrs
- 8 days/yr
Risk factors via First Street. Map © Google.
Why this score? — see what drove the D grade
The composite is a weighted blend of 9 inputs, each scored 0–100. Each bar is that input's sub-score; the figure is the points it added to the 100-point composite (weight × sub-score).
- Cash flow +16.6/30.0
- ARV discount +7.5/15.0
- DSCR +5.1/10.0
- 1% rule +3.3/10.0
- Livability +3.3/5.0
- Schools +2.7/10.0
- Condition / age +2.5/5.0
- Rent growth +2.4/5.0
- Appreciation +0.0/10.0
$649,000
🖨 Deal sheet (PDF) 📄 Offer letter ✓ Due diligence
Listing remarks MLS
Duplex, unique property. First unit (111) has 3 bedrooms, Second unit (115) has one bedroom. County records may not show correct square footage. Property needs some TLC. South end location. Pool at Unit 111. Buyer to verify permits.
Key facts
- Private pool
- Spa
- Prime location
Tags
Neighborhood map
What this means for you Summary
Snapshot
- This is a 3-bed/2.0-bath single-family listed at $649k.
Deal economics
- At list price, monthly cash flow is $387 ($5k/yr) — positive.
- The deal already cash-flows at list — no discount required.
- To meet the 1% rule (rent ≥ 1% of price), the offer needs to be $536k (17.4% below list).
- Recommended offer: $536k (17.4% below list) — sets the bar for 1% rule.
- Cap rate 7.0% vs local median 2.7% in Palm Springs — top-decile yield for the area; either an underpriced asset or a hidden risk that comps aren't pricing in. Stress-test before assuming the spread holds.
Location & tenants
- Location reads 66/100 on livability (#348 in CA) — a middle-class / working-renter tenant base. Strengths: amenities A+, commute A+; Watch: crime F, cost of living F, health & safety F.
- Palm Springs Unified (suburban): math 21% / reading 42% proficiency, ranked #328 of 517 in CA (top 63%) — families likely to look elsewhere, expect single-tenant / working-renter base with shorter leases; 73% free/reduced lunch — lower-income household profile, screen leases tightly.
- Zoned schools: Cahuilla Elementary (421 students, 93% FRL); Raymond Cree Middle (708 students, 98% FRL); Palm Springs High (math 30% / reading 51%, grade F, #508 of 1,170 statewide, top 44%, 1,584 students, 97% FRL) — zoned schools average 96% FRL vs 73% district-wide (22 pts higher); higher-poverty schools than district average — tighter screening recommended.
- Market conditions: Rents soft (-0.4%/yr); 498 active listings in the ZIP; 29 comparable units currently listed for rent nearby; rentals lingering (median 46d on market — plan ~5-8 weeks vacancy on turnover, expect pricing pressure); 52% of comp listings sitting > 30 days — soft ceiling on asking rent; solid renter incomes; 9,195 units permitted in Riverside County in 2024 (1,512 in 5+ unit buildings).
- At $5,360/mo this rent would consume 83% of the median local household income ($78k/yr) (locally 1215% of renters already pay >50% of income on rent) — very limited rent-growth headroom before tenants either downsize or default.
Forward outlook
- Local home prices are declining (-3.0%/yr); year-one equity from $4k of loan paydown is wiped out by about $19k of value loss. Plan a longer hold.
- Riverside County population projected at +22% by 2050 — long-run rental-demand tailwind backs the buy-and-hold thesis.
Negotiation context
- It's been on market 85 days — a 6% lower offer ($610k) is reasonable based on typical stale-listing flexibility.
- 6 sale attempts since 27y ago; this cycle's ask has dropped $90k (12%) from the opening price — seller is motivated, your offer sets the floor, not the list.
- Current owner paid $147k; list at $649k implies a 341% gain — meaningful room to come down on a strong offer.
Risks & watch-outs
- Watch-outs: built in 1951 — expect roof / HVAC / electrical / plumbing capex.
- Climate carrying-cost: moderate wildfire risk; extreme-heat days projected 9→27/yr by 2055 (HVAC capex compounding) — expect insurance premiums to compound above CPI over the hold.
Questions for the listing agent
- It's been on market 85 days. Have you received any prior offers? Is the seller open to a 17% concession, seller financing, or rate buy-down credit?
- Built in 1951 — when were the roof, HVAC, electrical panel, plumbing, and water heater last replaced?
- Why hasn't it sold? Are there any deal-killer items the seller is aware of (foundation, flood, title, zoning, code violations)?
- Is there a deadline driving the sale (1031 exchange, divorce, estate, relocation)? That informs how much negotiation room exists.
- Crime grade is F in this area — have there been break-ins, vandalism, or insurance claims at this property in the last 3 years? What carrier currently insures it and at what premium?
- The area grade is low — what's the realistic commute time and amenity access for the typical tenant pool here? Any planned neighborhood developments (good or bad) we should know about?
- What's the average days-on-market for RENTAL listings here right now (not sales)? A rising rental-DOM trend means longer vacancies and softer asking-rent achievability than the comps imply.
- What's the recent tenant-quality profile in this submarket — average credit score on applications, eviction rate, late-payment / NSF rate, and stable-employment percentage? A property-management company in the area should have these aggregated.
- How much new for-sale + rental construction is in the pipeline within 1–3 miles? Heavy new supply typically softens prices + rents 12–24 months out; constrained supply supports both.
Investment metrics
- 1% rule
- 0.83% ✗
- Cap rate
- 7.01%
- Cash-on-cash
- 2.55%
- DSCR
- 1.11
- GRM
- 10.1
CMA / ARV
- ARV (on-the-fly)
- $1,500,736
- Comps found
- 12
Show comp detail 12 sales within ~0.75 mi
| Address | Dist | Beds/Ba | Sqft | Sold | Price | $/sf | Match |
|---|---|---|---|---|---|---|---|
| 2030 S Joshua Tree Pl | 0.45mi | 3/2.5 | 2,100 (+0%) | 0mo | $1,210,000 | $576 | 77 |
| 1755 S Mesa Dr | 0.19mi | 2/3.5 (-1) | 2,152 (+3%) | 2mo | $1,500,000 | $697 | 74 |
| 279 W Overlook Rd | 0.25mi | 4/3.5 (+1) | 1,995 (-5%) | 1mo | $1,600,000 | $802 | 69 |
| 176 W Crestview | 0.16mi | 3/3.0 | 1,853 (-12%) | 2mo | $1,658,337 | $895 | 67 |
| 1450 S Via Soledad | 0.39mi | 3/3.0 | 1,975 (-6%) | 3mo | $1,300,000 | $658 | 66 |
| 743 E Twin Palms Dr | 0.21mi | 3/2.0 | 1,793 (-14%) | 1mo | $935,000 | $521 | 66 |
| 168 E Morongo Rd | 0.51mi | 3/3.0 | 2,009 (-4%) | 0mo | $1,745,000 | $869 | 65 |
| 922 E Anza Dr | 0.48mi | 4/3.0 (+1) | 2,212 (+6%) | 1mo | $2,250,000 | $1,017 | 58 |
| 1231 Surrey Ln | 0.44mi | 2/2.5 (-1) | 1,896 (-10%) | 1mo | $1,075,000 | $567 | 56 |
| 1560 S Calle Palo Fierro | 0.37mi | 4/4.0 (+1) | 1,931 (-8%) | 2mo | $1,850,000 | $958 | 56 |
| 1530 Palm Colony | 0.51mi | 3/4.0 | 2,269 (+8%) | 2mo | $1,625,000 | $716 | 53 |
| 1241 Primavera Dr N | 0.73mi | 2/2.0 (-1) | 1,847 (-12%) | 3mo | $755,500 | $409 | 39 |
Match score weights: distance 35% · size 25% · config 20% · recency 20%. Top-matched comps best support the ARV.
Projected returns pro-forma
-3.0% appreciation · 0.0% rent growth · sell at horizon
- IRR
- -15.3%
- Equity multiple
- 0.47×
- Total profit
- $-96,553
- Equity at exit
- $96,768
- IRR
- -12.0%
- Equity multiple
- 0.37×
- Total profit
- $-114,326
- Equity at exit
- $56,114
Cash invested: $181,720 (down + closing). Projections, not guarantees.
Landlord ↔ Tenant lean methodology
- Overall (STATE)
- 18 Strongly Tenant-Friendly
- State California
- 18 Strongly Tenant-Friendly · D+13
- County
- — inherits STATE
- City
- — inherits STATE
ZIP-level market 92264
- Rents YoY
- -0.4%
- Active inventory
- 498
- Price-to-rent
- 10.1×
Monthly cashflow live
- Estimated rent
- $5,360 high interval (Pro) →
- Mortgage (P&I)
- −$3,403
- Tax from tax record
- −$174 /mo · $2,084/yr
- Insurance
- −$270
- HOA
- −$0
- Vacancy / Maint / Mgmt
- −$1,126
- Net cashflow
- $387
Break-even live
Sensitivity live
| Price | -10% $754 | -5% $570 | +0% $387 | +5% $203 | +10% $19 |
|---|---|---|---|---|---|
| Rent | -10% $-37 | -5% $175 | +0% $387 | +5% $598 | +10% $810 |
| Rate | -1.0pp $714 | -0.5pp $552 | base $387 | +0.5pp $219 | +1.0pp $47 |
UW: 25.0% down · 7.5% · 30yr · 1.5% tax · 5.0% vac · 8.0% maint · 8.0% mgmt
Financing live
Cash to close
- Down payment
- $162,250
- Closing costs
- $19,470
- Reserves months
- —
- Total cash needed
- —
Loan-product check · same deal, 3 products live
Conventional
25% down · 7.5% · 30yr
- Down + closing
- —
- Monthly P&I
- —
- Monthly cashflow
- —
- DSCR
- —
- Eligible?
- —
Personal DTI + credit; lowest rate.
DSCR
20% down · 8.5% · 30yr
- Down + closing
- —
- Monthly P&I
- —
- Monthly cashflow
- —
- DSCR
- —
- Eligible?
- —
No personal income docs; deal must DSCR.
Hard money
10% down · 12.0% · 12mo
- Down + closing
- —
- Monthly P&I
- —
- Monthly cashflow
- —
- DSCR
- —
- Eligible?
- —
Short-term bridge; refi at stabilization.
Rent comps 29 comps
| Address | Beds | Baths | Sqft | Rent | $/sqft | DOM | Units | Dist |
|---|---|---|---|---|---|---|---|---|
| 157 Calle Bravo Palm Springs, CA | 2.0 | 3.0 | 1694 | $2,950 | $1.74 | 1d | 1 | 0.21mi |
| 500 Paseo Soleado Unit 497 Palm Springs, CA | 3.0 | 2.5 | 1812 | $3,000 | $1.66 | 45d | 1 | 0.25mi |
| 500 Paseo Soleado Unit 485 Palm Springs, CA | 2.0 | 2.5 | 1712 | $2,800 | $1.64 | 45d | 1 | 0.25mi |
| 791 E Twin Palms Dr Palm Springs, CA | 3.0 | 2.0 | 1793 | $9,700 | $5.41 | 45d | 1 | 0.26mi |
| 965 E Twin Palms Dr Palm Springs, CA | 3.0 | 2.0 | 1600 | $15,000 | $9.38 | 45d | 1 | 0.36mi |
| 1947 S Joshua Tree Pl Palm Springs, CA | 3.0 | 2.5 | 1928 | $6,000 | $3.11 | 25d | 1 | 0.36mi |
| 1970 S Joshua Tree Pl Palm Springs, CA | 3.0 | 2.0 | 1957 | $8,175 | $4.18 | 45d | 1 | 0.41mi |
| 1970 S Joshua Tree Pl Palm Springs, CA | 3.0 | 2.0 | 1957 | $8,175 | $4.18 | 16d | 1 | 0.41mi |
| 1201 Surrey Ln Palm Springs, CA | 2.0 | 2.5 | 1896 | $5,500 | $2.90 | 45d | 1 | 0.43mi |
| 1155 E Mesquite Ave Palm Springs, CA | 3.0 | 3.0 | 2700 | $9,500 | $3.52 | 45d | 1 | 0.82mi |
| 1155 E Mesquite Ave Palm Springs, CA | 3.0 | 3.0 | 2700 | $13,000 | $4.81 | 26d | 1 | 0.82mi |
| 3000 Cahuilla Hills Dr Palm Springs, CA | 3.0 | 3.0 | 2120 | $7,000 | $3.30 | 45d | 1 | 0.83mi |
| 17 Cahuilla Hills Dr Palm Springs, CA | 2.0 | 2.0 | 1965 | $10,500 | $5.34 | 45d | 1 | 0.84mi |
| 1595 S Calle Rolph Palm Springs, CA | 3.0 | 3.5 | 2509 | $8,500 | $3.39 | 45d | 1 | 0.85mi |
| 1592 S Calle Rolph Palm Springs, CA | 2.0 | 3.0 | 2612 | $6,000 | $2.30 | 45d | 1 | 0.87mi |
| 2040 S Chico Dr Palm Springs, CA | 4.0 | 3.5 | 2994 | $7,500 | $2.51 | 16d | 1 | 0.88mi |
| 2560 S Camino Real Palm Springs, CA | 3.0 | 2.0 | 2421 | $25,000 | $10.33 | 45d | 1 | 0.98mi |
| 344 Big Canyon Dr S Palm Springs, CA | 4.0 | 4.0 | 2565 | $9,000 | $3.51 | 20d | 1 | 1.00mi |
| 1331 S Sunrise Way Palm Springs, CA | 3.0 | 3.0 | 2160 | $7,000 | $3.24 | 45d | 1 | 1.01mi |
| 1423 E San Lorenzo Rd Palm Springs, CA | 4.0 | 2.0 | 1824 | $4,200 | $2.30 | 26d | 1 | 1.02mi |
| 1533 E Canyon Estates Dr Palm Springs, CA | 2.0 | 2.5 | 2593 | $2,500 | $0.96 | 45d | 1 | 1.02mi |
| 2727 S Sierra Madre #5 Palm Springs, CA | 2.0 | 2.5 | 1616 | $3,100 | $1.92 | 45d | 1 | 1.13mi |
| 520 E Murray Canyon Dr Palm Springs, CA | 1.0–3.0 | 2.0–2.5 | 1885 | $3,295 | $1.75 | 0d | 1 | 1.26mi |
| 453 Village Square E Palm Springs, CA | 2.0 | 2.0 | 1400 | $3,000 | $2.14 | 18d | 1 | 1.29mi |
| 874 Village Square N Palm Springs, CA | 2.0 | 2.0 | 1680 | $3,000 | $1.79 | 20d | 1 | 1.32mi |
| 211 Canyon Cir N Palm Springs, CA | 2.0 | 2.0 | 1678 | $3,900 | $2.32 | 18d | 1 | 1.32mi |
| 211 Canyon Cir N Palm Springs, CA | 2.0 | 2.0 | 1678 | $3,900 | $2.32 | 4d | 1 | 1.32mi |
| 998 Village Square N Palm Springs, CA | 2.0 | 2.0 | 1588 | $3,000 | $1.89 | 26d | 1 | 1.33mi |
| 555 S Sunrise Way Palm Springs, CA | 3.0 | 4.0 | 2274 | $8,000 | $3.52 | 26d | 1 | 1.37mi |
Listing history 26 events
-
2026-04-10status Pending
-
2026-03-23historical Backup Offers Accepted
-
2026-03-18price $649,000
-
2026-03-12price $699,000
-
2026-02-28price $735,000
-
2026-01-14$739,000 Active
-
2025-12-17historical
-
2025-12-16status Active
-
2025-11-12status Pending
-
2025-10-31price $749,000
-
2025-10-24price $765,000
-
2025-10-07$789,000 Active
-
2025-10-03historical
-
2011-11-02soldstatus $147,000 Closed 232-char remark
Show marketing remark (232 chars)
Duplex, unique property. First unit (111) has 3 bedrooms, Second unit (115) has one bedroom. County records may not show correct square footage. Property needs some TLC. South end location. Pool at Unit 111. Buyer to verify permits.
-
2011-10-13historical 232-char remark
Show marketing remark (232 chars)
Duplex, unique property. First unit (111) has 3 bedrooms, Second unit (115) has one bedroom. County records may not show correct square footage. Property needs some TLC. South end location. Pool at Unit 111. Buyer to verify permits.
-
2011-09-28historical Contingent 232-char remark
Show marketing remark (232 chars)
Duplex, unique property. First unit (111) has 3 bedrooms, Second unit (115) has one bedroom. County records may not show correct square footage. Property needs some TLC. South end location. Pool at Unit 111. Buyer to verify permits.
-
2011-09-28$147,000 Active 232-char remark
Show marketing remark (232 chars)
Duplex, unique property. First unit (111) has 3 bedrooms, Second unit (115) has one bedroom. County records may not show correct square footage. Property needs some TLC. South end location. Pool at Unit 111. Buyer to verify permits.
-
2004-03-12soldstatus $390,000
-
2002-04-16historical
-
2001-10-25
-
1999-12-29soldstatus $159,000
-
1999-12-29soldstatus $159,000
-
1999-11-30historical
-
1999-09-09$169,000
-
1990-09-27soldstatus $80,000
ⓘ Source: listings_history table (triggers on properties + properties_extension) + one-shot
backfill from property_details.listing_events for pre-trigger history.
Tax reassessment forecast CA · Resets to sale price
- Current annual tax
- $2,084 · $174/mo
- Projected year-2 tax
- $4,932 · $411/mo
- Expected delta
- +$2,848/yr (+$237/mo · 136.6%)
ⓘ Screening estimate from a state-policy table — verify with the county assessor before closing.
Climate risk First Street
- Flood 1/10 Low FEMA zone X (shaded) · 0% chance over 30 yrs
- Wildfire 5/10 Major
- Heat 9/10 Extreme 9 d/yr ≥110°F today · 27 d/yr by 30 yrs out
- Wind 1/10 Low
- Air quality 5/10 Major 6 unhealthy d/yr today · 8 by 30 yrs out
Nearby sold comps map
Loading sold comps map…
Walkable amenities ~0.75 mi
Loading nearby amenities…
Taxation est. · year 1
- Rental income
- $64,318
- − Mortgage interest
- −$36,354
- − Property taxes
- −$2,084
- − Insurance
- −$3,245
- − Repairs & maintenance
- −$5,145
- − Management
- −$5,145
- − Depreciation
- −$18,880
- Taxable loss
- −$6,536
- Est. tax savings @ 24.0%
- +$1,569
- After-tax cash flow
- $6,210/yr
For passive investors: Depreciation is non-cash, so a rental often shows a tax loss while cash-flowing — sheltering income. Rental losses are passive: they offset passive income freely, and up to $25,000/yr can offset ordinary (W-2) income if you actively participate and your MAGI is under $100k (phasing out to $0 by $150k); unused losses carry forward. On sale, claimed depreciation is recaptured at up to 25%, and gains may owe capital-gains tax (a 1031 exchange can defer both). Figures are a year-1 estimate at your 24.0% rate — not tax advice; consult a CPA.
Schools (NCES district)
- District
- Palm Springs Unified
- NCES district ID
- 0629550
- Math proficiency
- 21% ▼ -7.00%
- Reading proficiency
- 42% ▬ 0.00%
- Median HH income
- $43,638
- Composite
- 26.76/100
- National rank
- #7131
- State rank
- #328 of 517 in CA
Livability — Palm Springs
- Score
- 66/100
- State rank
- #348
- US rank
- #11850
Category grades
Schools grade is shown separately in the Schools card above.
Census & demographics
- Census place
- Palm Springs, CA
- County
- Riverside County · 2,287,001 people
- City population
- 46,786
- Metro
- Riverside-San Bernardino-Ontario, CA
- Population (ZIP)
- 19,899
- Household income
- $77,688
- Rent vs Own
- Severe rent burden
- 1215.0
Population outlook (Riverside County) Hauer SSP2
- Today (2025)
- 2,664,475 people
- By 2030
- 2,802,692 · +5.2%
- By 2040
- 3,050,904 · +14.5%
- By 2050
- 3,256,783 · +22.2%
- By 2075
- 3,655,058 · +37.2%
- By 2100
- 3,766,594 · +41.4%
Race, ethnicity, and origin ACS 2023
- Neighborhood character
- Predominantly White (68%)
- Race & ethnicity
- White 68% Hispanic / Latino 20% Two or more races 12% Asian 6% Black 2% Native American 1%
- Hispanic origin (detail)
- Mexican 16%
- Common ancestry
- Lithuanian 4% Romanian 3% Slovak 3%
- Foreign-born
- 16% · Canada, China, South Korea
- Languages at home
- 81% English-only · Spanish 13% Tagalog/Filipino 2% Other Asian/Pacific 1%
Political lean MEDSL · Riverside
- 2024 margin
- Toss-up / Even · D 48.0% · R 49.3% · Other 2.6%
- 2008→2024 swing
- -3.6pp toward R · 2008: 2.3pp · 2024: -1.3pp
- All cycles
- 2024: R+1.3 2020: D+8.0 2016: D+4.3 2012: R+0.4 2008: D+2.3
Not yet ingested
- Civics
- —
Market trends
- HPI YoY
- ▼ -489.04%
- Current HPI
- 357.0969
- Rent YoY
- ▼ -0.43%
- Metro
- Riverside-San Bernardino-Ontario, CA
- State GDP YoY
- ▲ 3.21%
- F500 in state
- 116
Industry mix (Fortune 500 HQ in CA)
| Industry | F500 HQs | Revenue |
|---|---|---|
| Technology | 27 | $1,492B |
|
||
| Financial Services | 3 | $174B |
|
||
| Retail | 3 | $44B |
|
||
| Insurance | 3 | $26B |
|
||
| Media / Entertainment | 2 | $115B |
|
||
| Pharmaceuticals / Biotech | 2 | $62B |
|
||
Price history
+711.2% since first listed26 events — show timeline
- 2026-04-10 Pending — TheMLS
- 2026-03-23 Contingent — TheMLS
- 2026-03-18 Price Changed $649,000 TheMLS
- 2026-03-12 Price Changed $699,000 TheMLS
- 2026-02-28 Price Changed $735,000 TheMLS
- 2026-01-14 Listed $739,000 TheMLS
- 2025-12-17 Listing Removed — GPSMLS
- 2025-12-16 Relisted — GPSMLS
- 2025-11-12 Pending — GPSMLS
- 2025-10-31 Price Changed $749,000 GPSMLS
- 2025-10-24 Price Changed $765,000 GPSMLS
- 2025-10-07 Listed $789,000 GPSMLS
- 2025-10-03 Coming Soon — GPSMLS
- 2011-11-02 Sold (MLS) $147,000 GPSMLS
- 2011-11-02 Sold (MLS) $147,000 GPSMLS
- 2011-10-13 Listing Removed — GPSMLS
- 2011-09-28 Contingent — GPSMLS
- 2011-09-28 Listed $147,000 GPSMLS
- 2004-03-12 Sold (Public Records) $390,000 Public Records
- 2002-04-16 Delisted — PALM
- 2001-10-25 Listed — PALM
- 1999-12-29 Sold (Public Records) $159,000 Public Records
- 1999-12-29 Sold (MLS) $159,000 PALM
- 1999-11-30 Delisted — PALM
- 1999-09-09 Listed $169,000 PALM
- 1990-09-27 Sold (Public Records) $80,000 Public Records
Property tax history
-5.2%/yrLatest (2025): $2,084 · -2.6% YoY. Source: county tax records.
Cash-flow waterfall
monthlySold comps — $/sqft
last 12 mo · ≤1 miLoading sold comps…