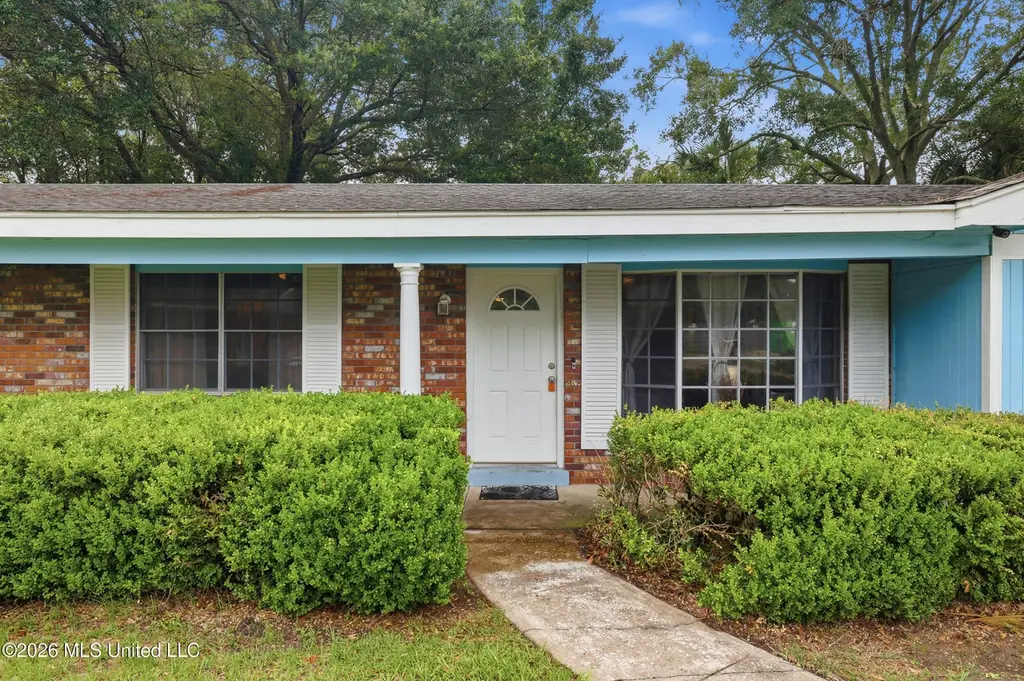
1884 Schencks St · Biloxi, MS
Flood risk No data
- FEMA flood zone
- —
- Chance of flooding over 30 yrs
- —
- Est. flood insurance / yr
- —
Fire risk No data
- Est. fire insurance / yr
- —
Heat risk 10/10 · Severe
- Hot days now (above threshold)
- 7 days/yr
- Hot days in 30 yrs
- 24 days/yr
Wind risk No data
- Chance of severe wind over 30 yrs
- —
Air-quality risk 3/10 · Minor
- Unhealthy air days now
- 2 days/yr
- Unhealthy air days in 30 yrs
- 3 days/yr
Risk factors via First Street. Map © Google.
Why this score? — see what drove the C- grade
The composite is a weighted blend of 9 inputs, each scored 0–100. Each bar is that input's sub-score; the figure is the points it added to the 100-point composite (weight × sub-score).
- Cash flow +21.1/30.0
- ARV discount +7.8/15.0
- DSCR +6.7/10.0
- 1% rule +4.9/10.0
- Schools +4.5/10.0
- Livability +4.0/5.0
- Rent growth +2.5/5.0
- Condition / age +2.5/5.0
- Appreciation +0.0/10.0
$210,000
🖨 Deal sheet (PDF) 📄 Offer letter ✓ Due diligence
Listing remarks MLS
LOCATION!!! Wake up each morning with 26 miles of Coastal Mississippi beachfront at your fingertips... Proximity to Beach Blvd. gives you quick and easy access to the entertainment districts of Biloxi, casinos, local shopping, and Keesler Air Force Base, and I-10. Home features include additional living space perfect for a den or playroom, fenced in yard, interior laundry room, ceramic tile through out, and large windows let in natural light, plus two stained glass windows showcase the den. Each of the 3 bedrooms have large closets. This close to the water at this price is a DEAL, don't miss out! NO flood insurance required! Call today to set up a showing!
Key facts
- 0.23 acre lot
- 2 garage spots
- Community pool
Tags
Property features AI
Finance
- HOA & community: Community amenities include boating, pool, and nearby entertainment
Exterior
- Parking: 2-car garage; Driveway (concrete)
- Utilities: Public water; Public sewer; Cable connected; Electricity connected; Natural gas connected; Sewer connected; Water connected
- Home design: Single family residence; House; One level
- Construction: Built with brick veneer and wood siding; Slab foundation; Asphalt shingle roof; Year built (public records)
- Exterior features: Private yard; Back yard fencing with gate; Few trees; Level lot; Near beach; Rectangular lot; Beach access; Gulf access; Water view
Interior
- Kitchen: Dishwasher; Microwave; Oven; Refrigerator
- Flooring: Ceramic tile
- Bathrooms: 3 full bathrooms
- Heating & cooling: Central heating; Electric heating; Heat pump; Central air conditioning; Electric cooling
- Interior features: French doors; Sliding doors
- Laundry & utility: Washer; Dryer
Neighborhood map
What this means for you Summary
Snapshot
- This is a 3-bed/1.0-bath single-family listed at $210k.
Deal economics
- At list price, monthly cash flow is $300 ($4k/yr) — positive.
- The deal already cash-flows at list — no discount required.
- To meet the 1% rule (rent ≥ 1% of price), the offer needs to be $208k (0.8% below list).
- Recommended offer: $207k (1.5% below list) — sets the bar for market timing.
- Cap rate 8.0% vs local median 3.5% in Biloxi — top-decile yield for the area; either an underpriced asset or a hidden risk that comps aren't pricing in. Stress-test before assuming the spread holds.
Location & tenants
- Location reads 79/100 on livability (#6 in MS, #2,141 nationally) — a middle-class / working-renter tenant base. Strengths: crime A+, cost of living A+, housing A+; Watch: commute D+, amenities F, employment D-.
- Biloxi Public School District (urban): math 60% / reading 48% proficiency, ranked #7 of 130 in MS (top 5%) — acceptable for families but not a draw, mixed tenant base, ~2y average lease.
- Zoned schools: Back Bay Elementary School (math 51% / reading 50%, grade D+, #59 of 375 statewide, top 16%, 535 students, 99% FRL); Biloxi Junior High (math 60% / reading 43%, grade C, #27 of 179 statewide, top 16%, 881 students, 100% FRL); Biloxi High School (math 65% / reading 53%, grade C+, #7 of 197 statewide, top 3%, 1,728 students, 100% FRL) — zoned schools average 100% FRL vs 59% district-wide (40 pts higher); higher-poverty schools than district average — tighter screening recommended.
- Market conditions: Rents flat; 201 active listings in the ZIP; 7 comparable units currently listed for rent nearby; rentals at typical pace (median 23d on market — plan ~3-4 weeks tenant-placement turnaround); 43% of comp listings sitting > 30 days — soft ceiling on asking rent; 2,194 units permitted in Harrison County in 2024 (0 in 5+ unit buildings).
- At $2,083/mo this rent would consume 46% of the median local household income ($54k/yr) (locally 1110% of renters already pay >50% of income on rent) — very limited rent-growth headroom before tenants either downsize or default.
Forward outlook
- Local home prices are declining (-3.0%/yr); year-one equity from $1k of loan paydown is wiped out by about $6k of value loss. Plan a longer hold.
- Harrison County population projected at +27% by 2050 — long-run rental-demand tailwind backs the buy-and-hold thesis.
Negotiation context
- It's been on market 17 days — a 2% lower offer ($207k) is reasonable based on typical stale-listing flexibility.
- 3 sale attempts since 10y ago with the ask held roughly flat each time — persistent listings suggest the price (not the market) is what's stuck; bring a comps-based counter.
- Current owner paid $95k; list at $210k implies a 121% gain — meaningful room to come down on a strong offer.
Risks & watch-outs
- Climate carrying-cost: extreme-heat days projected 7→24/yr by 2055 (HVAC capex compounding) — expect insurance premiums to compound above CPI over the hold.
Questions for the listing agent
- Built in 1964 — when were the roof, HVAC, electrical panel, plumbing, and water heater last replaced?
- Is there a deadline driving the sale (1031 exchange, divorce, estate, relocation)? That informs how much negotiation room exists.
- What's the average days-on-market for RENTAL listings here right now (not sales)? A rising rental-DOM trend means longer vacancies and softer asking-rent achievability than the comps imply.
- What's the recent tenant-quality profile in this submarket — average credit score on applications, eviction rate, late-payment / NSF rate, and stable-employment percentage? A property-management company in the area should have these aggregated.
- How much new for-sale + rental construction is in the pipeline within 1–3 miles? Heavy new supply typically softens prices + rents 12–24 months out; constrained supply supports both.
Investment metrics
- 1% rule
- 0.99% ✗
- Cap rate
- 8.01%
- Cash-on-cash
- 6.11%
- DSCR
- 1.27
- GRM
- 8.4
CMA / ARV
- ARV (on-the-fly)
- $211,595
- Comps found
- 1
Show comp detail 1 sale within ~0.75 mi
| Address | Dist | Beds/Ba | Sqft | Sold | Price | $/sf | Match |
|---|---|---|---|---|---|---|---|
| 274 Bleuer Dr | 0.65mi | 4/3.0 (+1) | 2,361 (+13%) | 13mo | $239,000 | $101 | 24 |
Match score weights: distance 35% · size 25% · config 20% · recency 20%. Top-matched comps best support the ARV.
Projected returns pro-forma
-3.0% appreciation · 0.05% rent growth · sell at horizon
- IRR
- -10.1%
- Equity multiple
- 0.64×
- Total profit
- $-20,984
- Equity at exit
- $31,312
- IRR
- -5.1%
- Equity multiple
- 0.71×
- Total profit
- $-17,064
- Equity at exit
- $18,157
Cash invested: $58,800 (down + closing). Projections, not guarantees.
Landlord ↔ Tenant lean methodology
- Overall (STATE)
- 90 Strongly Landlord-Friendly
- State Mississippi
- 90 Strongly Landlord-Friendly · R+11
- County
- — inherits STATE
- City
- — inherits STATE
ZIP-level market 39531
- Home prices YoY
- -13.0%
- Rents YoY
- 0.1%
- Active inventory
- 201
- Price-to-rent
- 8.4×
Monthly cashflow live
- Estimated rent
- $2,083 high interval (Pro) →
- Mortgage (P&I)
- −$1,101
- Tax from tax record
- −$157 /mo · $1,883/yr
- Insurance
- −$88
- HOA
- −$0
- Vacancy / Maint / Mgmt
- −$437
- Net cashflow
- $300
Break-even live
Sensitivity live
| Price | -10% $419 | -5% $359 | +0% $300 | +5% $240 | +10% $181 |
|---|---|---|---|---|---|
| Rent | -10% $135 | -5% $217 | +0% $300 | +5% $382 | +10% $464 |
| Rate | -1.0pp $405 | -0.5pp $353 | base $300 | +0.5pp $245 | +1.0pp $190 |
UW: 25.0% down · 7.5% · 30yr · 1.5% tax · 5.0% vac · 8.0% maint · 8.0% mgmt
Financing live
Cash to close
- Down payment
- $52,500
- Closing costs
- $6,300
- Reserves months
- —
- Total cash needed
- —
Loan-product check · same deal, 3 products live
Conventional
25% down · 7.5% · 30yr
- Down + closing
- —
- Monthly P&I
- —
- Monthly cashflow
- —
- DSCR
- —
- Eligible?
- —
Personal DTI + credit; lowest rate.
DSCR
20% down · 8.5% · 30yr
- Down + closing
- —
- Monthly P&I
- —
- Monthly cashflow
- —
- DSCR
- —
- Eligible?
- —
No personal income docs; deal must DSCR.
Hard money
10% down · 12.0% · 12mo
- Down + closing
- —
- Monthly P&I
- —
- Monthly cashflow
- —
- DSCR
- —
- Eligible?
- —
Short-term bridge; refi at stabilization.
Rent comps 7 comps
| Address | Beds | Baths | Sqft | Rent | $/sqft | DOM | Units | Dist |
|---|---|---|---|---|---|---|---|---|
| 1805 Irish Hill Dr #4 Biloxi, MS | 3.0 | 2.0 | 1600 | $2,400 | $1.50 | 45d | 1 | 0.34mi |
| 2060 Beach Blvd #604 Biloxi, MS | 2.0 | 2.0 | 1670 | $2,849 | $1.71 | 15d | 1 | 0.54mi |
| 340 Hiller Dr Biloxi, MS | 3.0 | 2.0 | 1447 | $1,749 | $1.21 | 22d | 1 | 0.74mi |
| 187 Bilmarsan Dr Biloxi, MS | 3.0 | 2.0 | 1850 | $2,670 | $1.44 | 45d | 1 | 0.90mi |
| 2611 Heidi LN Biloxi, MS | 3.0 | 2.5 | 1550 | $1,775 | $1.15 | 22d | 1 | 1.25mi |
| 391 Rodeo Dr Biloxi, MS | 4.0 | 2.0 | 2362 | $1,900 | $0.80 | 45d | 1 | 1.40mi |
| 391 Rodeo Dr Biloxi, MS | 4.0 | 2.0 | 2362 | $1,700 | $0.72 | 22d | 1 | 1.40mi |
Listing history 12 events
-
2026-06-21days on market $210,000 Active 17 DOM
-
2026-06-18days on market $210,000 Active 14 DOM
-
2026-06-17days on market $210,000 Active 13 DOM
-
2026-06-16days on market $210,000 Active 12 DOM
-
2026-06-15days on market $210,000 Active 11 DOM
-
2026-06-14days on market $210,000 Active 9 DOM
-
2026-06-13days on market $210,000 Active 8 DOM
-
2026-06-09days on market $210,000 Active 5 DOM
-
2026-06-08days on market $210,000 Active 4 DOM
-
2026-06-07days on market $210,000 Active 3 DOM
-
2026-06-05remarks 693-char remark
-
2026-06-05$210,000 Active 1 DOM
ⓘ Source: listings_history table (triggers on properties + properties_extension) + one-shot
backfill from property_details.listing_events for pre-trigger history.
Tax reassessment forecast MS · Resets to sale price
- Current annual tax
- $1,883 · $157/mo
- Projected year-2 tax
- $1,883 · $157/mo
- Expected delta
- $0/yr ($0/mo · 0.0%)
ⓘ Screening estimate from a state-policy table — verify with the county assessor before closing.
Climate risk First Street
- Heat 10/10 Extreme
- Air quality 3/10 Moderate 2 unhealthy d/yr today · 3 by 30 yrs out
Nearby sold comps map
Loading sold comps map…
Walkable amenities ~0.75 mi
Loading nearby amenities…
Taxation est. · year 1
- Rental income
- $24,993
- − Mortgage interest
- −$11,763
- − Property taxes
- −$1,883
- − Insurance
- −$1,050
- − Repairs & maintenance
- −$1,999
- − Management
- −$1,999
- − Depreciation
- −$6,109
- Taxable income
- $188
- Est. tax owed @ 24.0%
- −$45
- After-tax cash flow
- $3,550/yr
For passive investors: Depreciation is non-cash, so a rental often shows a tax loss while cash-flowing — sheltering income. Rental losses are passive: they offset passive income freely, and up to $25,000/yr can offset ordinary (W-2) income if you actively participate and your MAGI is under $100k (phasing out to $0 by $150k); unused losses carry forward. On sale, claimed depreciation is recaptured at up to 25%, and gains may owe capital-gains tax (a 1031 exchange can defer both). Figures are a year-1 estimate at your 24.0% rate — not tax advice; consult a CPA.
Schools (NCES district)
- District
- Biloxi Public School District
- NCES district ID
- 2800630
- Math proficiency
- 60% ▼ -7.00%
- Reading proficiency
- 48% ▼ -3.00%
- Median HH income
- $40,608
- Composite
- 45.26/100
- National rank
- #2657
- State rank
- #7 of 130 in MS
Livability — Biloxi
- Score
- 79/100
- State rank
- #6
- US rank
- #2141
Category grades
Schools grade is shown separately in the Schools card above.
Census & demographics
- Census place
- Biloxi, MS
- County
- Harrison County · 178,171 people
- City population
- 63,281
- Metro
- Gulfport-Biloxi, MS
- Population (ZIP)
- 18,918
- Household income
- $54,218
- Rent vs Own
- Severe rent burden
- 1110.0
Population outlook (Harrison County) Hauer SSP2
- Today (2025)
- 228,444 people
- By 2030
- 241,942 · +5.9%
- By 2040
- 267,531 · +17.1%
- By 2050
- 291,062 · +27.4%
- By 2075
- 346,711 · +51.8%
- By 2100
- 378,165 · +65.5%
Race, ethnicity, and origin ACS 2023
- Neighborhood character
- Diverse neighborhood (Simpson 0.60)
- Race & ethnicity
- White 60% Black 18% Two or more races 12% Hispanic / Latino 11% Asian 2%
- Hispanic origin (detail)
- Mexican 5%
- Common ancestry
- Lithuanian 6% Slovak 2% Serbian 1%
- Foreign-born
- 8% · Canada, Vietnam
- Languages at home
- 89% English-only · Spanish 6% Arabic 1% Other Indo-European 1%
Political lean MEDSL · Harrison
- 2024 margin
- Strong R (+28.9) · D 35.0% · R 63.9% · Other 1.1%
- 2008→2024 swing
- -2.9pp toward R · 2008: -26.0pp · 2024: -28.9pp
- All cycles
- 2024: R+28.9 2020: R+25.2 2016: R+30.7 2012: R+26.6 2008: R+26.0
Not yet ingested
- Civics
- —
Market trends
- HPI YoY
- ▼ -28.97%
- Current HPI
- 193.4018
- Rent YoY
- ▬ 0.05%
- Metro
- Gulfport-Biloxi, MS
- State GDP YoY
- —
- F500 in state
- 0
Price history
+75.1% since first listed7 events — show timeline
- 2026-06-04 Listed $210,000 MLSU
- 2020-03-23 Sold (Public Records) — Public Records
- 2020-03-18 Sold (MLS) — MLSU
- 2019-12-10 Listed $117,000 MLSU
- 2017-07-07 Sold (Public Records) $95,000 Public Records
- 2017-02-22 Sold (MLS) — MLSU
- 2016-11-28 Listed $119,900 MLSU
Property tax history
+46.6%/yrLatest (2025): $1,883 · +32.1% YoY. Source: county tax records.
Cash-flow waterfall
monthlySold comps — $/sqft
last 12 mo · ≤1 miLoading sold comps…