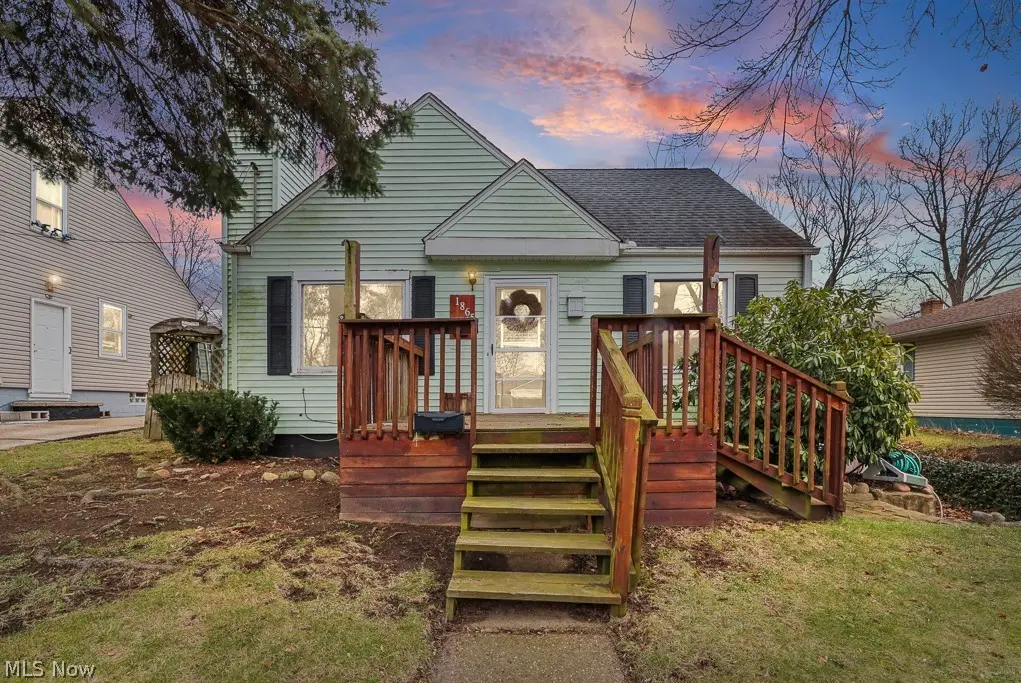
1865 9th St SW · Akron, OH
Flood risk 1/10 · Minimal
- FEMA flood zone
- X (unshaded)
- Chance of flooding over 30 yrs
- 0.0%
- Est. flood insurance / yr
- $473 – $860
Fire risk 1/10 · Minimal
- Est. fire insurance / yr
- $713 – $1,323
Heat risk 3/10 · Minor
- Hot days now (above 96°F)
- 7 days/yr
- Hot days in 30 yrs
- 16 days/yr
Wind risk 1/10 · Minimal
- Chance of severe wind over 30 yrs
- —
Air-quality risk 2/10 · Minimal
- Unhealthy air days now
- 1 days/yr
- Unhealthy air days in 30 yrs
- 2 days/yr
Risk factors via First Street. Map © Google.
Why this score? — see what drove the B- grade
The composite is a weighted blend of 9 inputs, each scored 0–100. Each bar is that input's sub-score; the figure is the points it added to the 100-point composite (weight × sub-score).
- Cash flow +26.1/30.0
- ARV discount +15.0/15.0
- DSCR +8.8/10.0
- 1% rule +7.4/10.0
- Livability +4.0/5.0
- Rent growth +3.5/5.0
- Condition / age +2.5/5.0
- Schools +2.1/10.0
- Appreciation +0.0/10.0
$87,500
🖨 Deal sheet (PDF) 📄 Offer letter ✓ Due diligence
Listing remarks
Welcome to this Cape Cod located on 9th Street in Akron’s Kenmore neighborhood. The home has received updates in recent years while still offering opportunities for finishing and personalization. Improvements completed between 2021–2023 include select new windows, updated flooring on the main and upper levels, interior paint, an updated main-level bedroom, a renovated first-floor full bathroom, kitchen updates including sliding doors, and a newer water heater. The main level offers a bedroom and full bathroom. The upper level provides a spacious area that can function as a bedroom, office, or flexible living space, with the primary bedroom located upstairs. The full basement inc
Key facts
- 5,248 sq ft lot
- Parking
- Built 1947
Property features AI
Exterior
- Parking: Driveway
- Utilities: Public water; Public sewer
- Home design: Two-story home; Above-grade finished living area reported as 941; Below-grade finished living area reported as 672
- Construction: Vinyl siding; Asphalt/fiberglass roof
- Exterior features: Lot approximately 0.12 acres
Interior
- Bedrooms: One main-level bedroom
- Bathrooms: Two full bathrooms; One main-level bathroom
- Heating & cooling: Central air conditioning; Forced-air gas heating
- Interior features: Full basement with walk-out access; One fireplace
Neighborhood map
What this means for you Summary
Snapshot
- This is a 3-bed/2.0-bath single-family listed at $88k.
Deal economics
- At list price, monthly cash flow is $220 ($3k/yr) — positive.
- The deal already cash-flows at list — no discount required.
- Meets the 1% rule at list price ($1k rent vs $88k).
- Cap rate 9.3% vs local median 6.6% in Akron — top-decile yield for the area; either an underpriced asset or a hidden risk that comps aren't pricing in. Stress-test before assuming the spread holds.
Location & tenants
- Location reads 81/100 on livability (#104 in OH, #1,591 nationally) — a professional / high-income tenant draw. Strengths: amenities A+, commute A+, cost of living A+; Watch: crime F, employment F.
- Akron City (urban): math 22% / reading 30% proficiency, ranked #602 of 656 in OH (top 92%) — low school quality limits family demand, transient renter base, plan for 1-2y turnover; 66% free/reduced lunch — lower-income household profile, screen leases tightly.
- Zoned schools: Pfeiffer Elementary School (math 24% / reading 27%, grade F, #1,211 of 1,584 statewide, top 76%, 210 students, 0% FRL); Innes Community Learning Center (math 8% / reading 15%, grade F, #641 of 654 statewide, top 98%, 641 students, 0% FRL); Akron Early College High School (math 62% / reading 98%, grade A, #34 of 781 statewide, top 4%, 377 students, 0% FRL) — zoned schools average 0% FRL vs 66% district-wide (66 pts lower); this property's tenant base skews higher-income than the district average.
- Zoned-school proficiency averages 39% at this address vs 26% district-wide (+13 pts) — the actual schools serving this property are materially stronger than the Akron City average implies; a family-tenant draw the district grade alone would hide.
- Market conditions: Rents rising (+3.9%/yr); 104 active listings in the ZIP; 23 comparable units currently listed for rent nearby; rentals at typical pace (median 25d on market — plan ~3-4 weeks tenant-placement turnaround); 48% of comp listings sitting > 30 days — soft ceiling on asking rent; 1,114 units permitted in Summit County in 2024 (397 in 5+ unit buildings).
Forward outlook
- Local home prices are declining (-3.0%/yr); year-one equity from $605 of loan paydown is wiped out by about $3k of value loss. Plan a longer hold.
- Summit County population projected to shrink 6% by 2050 — rents likely to lag national; underwrite the cash flow, not the appreciation.
- At projected returns (-3.0% appreciation + 3.9% rent growth), your $24k cash investment doubles in ~10 years — after that, you're playing with house money.
Negotiation context
- Only 10 days on market — expect competitive offers; lowballing is unlikely to land.
- 13 sale attempts since 32y ago with the ask held roughly flat each time — persistent listings suggest the price (not the market) is what's stuck; bring a comps-based counter.
- Current owner paid $58k; list at $88k implies a 51% gain — meaningful room to come down on a strong offer.
Risks & watch-outs
- Watch-outs: built in 1947 — expect roof / HVAC / electrical / plumbing capex.
Questions for the listing agent
- Built in 1947 — when were the roof, HVAC, electrical panel, plumbing, and water heater last replaced?
- Is there a deadline driving the sale (1031 exchange, divorce, estate, relocation)? That informs how much negotiation room exists.
- Crime grade is F in this area — have there been break-ins, vandalism, or insurance claims at this property in the last 3 years? What carrier currently insures it and at what premium?
- What's the average days-on-market for RENTAL listings here right now (not sales)? A rising rental-DOM trend means longer vacancies and softer asking-rent achievability than the comps imply.
- What's the recent tenant-quality profile in this submarket — average credit score on applications, eviction rate, late-payment / NSF rate, and stable-employment percentage? A property-management company in the area should have these aggregated.
- How much new for-sale + rental construction is in the pipeline within 1–3 miles? Heavy new supply typically softens prices + rents 12–24 months out; constrained supply supports both.
Investment metrics
- 1% rule
- 1.24% ✓
- Cap rate
- 9.31%
- Cash-on-cash
- 10.76%
- DSCR
- 1.48
- GRM
- 6.7
CMA / ARV
- ARV (median comp)
- $126,799
- List price
- $87,500
- Delta
- -30.99%
- Verdict
- UNDERPRICED
- Comps
- 20 within 1.0 mi
Show comp detail 12 sales within ~0.75 mi
| Address | Dist | Beds/Ba | Sqft | Sold | Price | $/sf | Match |
|---|---|---|---|---|---|---|---|
| 646 Chester Ave | 0.25mi | 3/1.0 | 941 (0%) | 7mo | $134,000 | $142 | 78 |
| 622 Polk Ave | 0.37mi | 3/2.0 | 928 (-1%) | 6mo | $115,000 | $124 | 75 |
| 880 Jason Ave | 0.28mi | 3/1.0 | 988 (+5%) | 6mo | $61,000 | $62 | 70 |
| 2009 6th St SW | 0.33mi | 2/1.0 (-1) | 951 (+1%) | 7mo | $94,000 | $99 | 68 |
| 2079 12th St SW | 0.42mi | 3/1.5 | 1,004 (+7%) | 3mo | $137,500 | $137 | 65 |
| 2001 13th St SW | 0.33mi | 2/1.0 (-1) | 1,016 (+8%) | 4mo | $94,900 | $93 | 59 |
| 2031 Verde Ave | 0.34mi | 3/1.5 | 1,072 (+14%) | 0mo | $143,000 | $133 | 59 |
| 940 Lakewood Blvd | 0.42mi | 2/1.0 (-1) | 996 (+6%) | 6mo | $96,000 | $96 | 56 |
| 592 Sharon St | 0.50mi | 2/1.5 (-1) | 1,020 (+8%) | 6mo | $50,000 | $49 | 51 |
| 1855 W 17th St SW | 0.40mi | 2/1.0 (-1) | 1,050 (+12%) | 5mo | $85,000 | $81 | 49 |
| 1882 16th St SW | 0.38mi | 2/1.0 (-1) | 818 (-13%) | 7mo | $86,000 | $105 | 46 |
| 989 Harrison Ave | 0.59mi | 2/1.0 (-1) | 840 (-11%) | 8mo | $63,000 | $75 | 39 |
Match score weights: distance 35% · size 25% · config 20% · recency 20%. Top-matched comps best support the ARV.
Projected returns pro-forma
-3.0% appreciation · 3.91% rent growth · sell at horizon
- IRR
- 0.9%
- Equity multiple
- 1.03×
- Total profit
- $855
- Equity at exit
- $13,047
- IRR
- 11.5%
- Equity multiple
- 1.94×
- Total profit
- $23,103
- Equity at exit
- $7,565
Cash invested: $24,500 (down + closing). Projections, not guarantees.
Landlord ↔ Tenant lean methodology
- Overall (STATE)
- 73 Landlord-Friendly
- State Ohio
- 73 Landlord-Friendly · R+6
- County
- — inherits STATE
- City
- — inherits STATE
ZIP-level market 44314
- Rents YoY
- 3.9%
- Active inventory
- 104
- Price-to-rent
- 6.7×
Monthly cashflow live
- Estimated rent
- $1,085 high interval (Pro) →
- Mortgage (P&I)
- −$459
- Tax from tax record
- −$142 /mo · $1,705/yr
- Insurance
- −$36
- HOA
- −$0
- Vacancy / Maint / Mgmt
- −$228
- Net cashflow
- $220
Break-even live
Sensitivity live
| Price | -10% $269 | -5% $244 | +0% $220 | +5% $195 | +10% $170 |
|---|---|---|---|---|---|
| Rent | -10% $134 | -5% $177 | +0% $220 | +5% $263 | +10% $305 |
| Rate | -1.0pp $264 | -0.5pp $242 | base $220 | +0.5pp $197 | +1.0pp $174 |
UW: 25.0% down · 7.5% · 30yr · 1.5% tax · 5.0% vac · 8.0% maint · 8.0% mgmt
Financing live
Cash to close
- Down payment
- $21,875
- Closing costs
- $2,625
- Reserves months
- —
- Total cash needed
- —
Loan-product check · same deal, 3 products live
Conventional
25% down · 7.5% · 30yr
- Down + closing
- —
- Monthly P&I
- —
- Monthly cashflow
- —
- DSCR
- —
- Eligible?
- —
Personal DTI + credit; lowest rate.
DSCR
20% down · 8.5% · 30yr
- Down + closing
- —
- Monthly P&I
- —
- Monthly cashflow
- —
- DSCR
- —
- Eligible?
- —
No personal income docs; deal must DSCR.
Hard money
10% down · 12.0% · 12mo
- Down + closing
- —
- Monthly P&I
- —
- Monthly cashflow
- —
- DSCR
- —
- Eligible?
- —
Short-term bridge; refi at stabilization.
Rent comps 23 comps
| Address | Beds | Baths | Sqft | Rent | $/sqft | DOM | Units | Dist |
|---|---|---|---|---|---|---|---|---|
| 781 Saxon Ave Akron, OH | 2.0 | 1.0 | 800 | $900 | $1.12 | 45d | 1 | 0.18mi |
| 847 Jason Ave Unit 1 Akron, OH | 2.0 | 1.0 | 798 | $825 | $1.03 | 25d | 1 | 0.24mi |
| 960 Jason Ave Akron, OH | 3.0 | 1.5 | 935 | $1,095 | $1.17 | 22d | 1 | 0.43mi |
| 835 Kenmore Blvd Unit UP Akron, OH | 2.0 | 1.0 | 872 | $750 | $0.86 | 22d | 1 | 0.62mi |
| 899 Rosamond Ave Akron, OH | 1.0–2.0 | 1.0 | 690 | $825 | $1.20 | 25d | 1 | 0.67mi |
| 2047 20th St SW Akron, OH | 2.0 | 1.0 | 624 | $695 | $1.11 | 25d | 1 | 0.68mi |
| 1035 Chester Ave Unit 1 Akron, OH | 2.0 | 1.0 | 624 | $900 | $1.44 | 25d | 1 | 0.70mi |
| 1035 Chester Ave Akron, OH | 2.0 | 1.0 | 624 | $900 | $1.44 | 15d | 1 | 0.70mi |
| 2139 18th St SW Akron, OH | 2.0 | 1.0 | 992 | $1,100 | $1.11 | 45d | 1 | 0.71mi |
| 685 Longview Ave Akron, OH | 3.0 | 1.0 | 1100 | $1,150 | $1.05 | 45d | 1 | 0.73mi |
| 720 Florida Ave Akron, OH | 4.0 | 1.0 | 1124 | $1,500 | $1.33 | 15d | 1 | 0.76mi |
| 2264 5th St SW Unit 2266 Akron, OH | 2.0 | 1.0 | 676 | $750 | $1.11 | 15d | 1 | 0.79mi |
| 2266 5th St SW Akron, OH | 2.0 | 1.0 | 676 | $750 | $1.11 | 15d | 1 | 0.79mi |
| 1032 Andrew St Akron, OH | 3.0 | 1.0 | 960 | $1,097 | $1.14 | 45d | 1 | 0.94mi |
| 1069 Fess Ave Akron, OH | 2.0 | 1.0 | 940 | $1,095 | $1.16 | 45d | 1 | 1.06mi |
| 2138 East Ave Akron, OH | 3.0 | 1.0 | 990 | $1,100 | $1.11 | 25d | 1 | 1.09mi |
| 783 Leonard St Akron, OH | 3.0 | 1.0 | 1040 | $1,250 | $1.20 | 45d | 1 | 1.17mi |
| 1494 Diagonal Rd Akron, OH | 3.0 | 1.0 | 1064 | $1,495 | $1.41 | 45d | 1 | 1.26mi |
| 384 W Bartges St Akron, OH | 2.0 | 1.0 | 1024 | $1,100 | $1.07 | 45d | 1 | 1.38mi |
| 1253 California Ave Akron, OH | 2.0 | 1.0 | 780 | $950 | $1.22 | 25d | 1 | 1.40mi |
| 1253 California Ave Akron, OH | 2.0 | 1.0 | 780 | $1,100 | $1.41 | 46d | 1 | 1.40mi |
| 45 E Emerling Ave Unit F Akron, OH | 2.0 | 1.0 | 850 | $795 | $0.94 | 45d | 1 | 1.44mi |
| 46 Brighton Dr Akron, OH | 2.0 | 1.0 | 850 | $1,100 | $1.29 | 45d | 1 | 1.47mi |
Listing history 30 events
-
2026-05-15status Pending 1240-char remark
-
2026-05-05$87,500 Active 1240-char remark
-
2026-05-05historical
-
2026-04-08price $90,000
-
2026-03-24$92,500 Active
-
2026-02-09status Pending
-
2026-02-08historical
-
2026-01-21$95,000 Active
-
2026-01-21historical
-
2026-01-15$95,000 Active
-
2025-10-15historical
-
2025-10-14status Active
-
2025-09-28status Pending
-
2025-08-02status Active
-
2025-07-28status Pending
-
2025-07-08$99,990 Active
-
2025-07-08historical
-
2025-04-18$119,000 Active
-
2024-04-25$119,777 Active
-
2021-04-14soldstatus $58,000 Closed
-
2021-04-01status Pending
-
2021-03-11historical Contingent
-
2021-02-24$59,900 Active
-
2008-08-22soldstatus $65,000
-
1995-03-14soldstatus $51,500
-
1995-03-14soldstatus $51,500
-
1994-10-15historical
-
1994-10-13$55,900
-
1994-10-12$55,900
-
1994-04-07$52,900
ⓘ Source: listings_history table (triggers on properties + properties_extension) + one-shot
backfill from property_details.listing_events for pre-trigger history.
Tax reassessment forecast OH · Partial reset (capped growth)
- Current annual tax
- $1,705 · $142/mo
- Projected year-2 tax
- $1,705 · $142/mo
- Expected delta
- $0/yr ($0/mo · 0.0%)
ⓘ Screening estimate from a state-policy table — verify with the county assessor before closing.
Climate risk First Street
- Flood 1/10 Low FEMA zone X (unshaded) · 0% chance over 30 yrs
- Wildfire 1/10 Low
- Heat 3/10 Moderate 7 d/yr ≥96°F today · 16 d/yr by 30 yrs out
- Wind 1/10 Low
- Air quality 2/10 Low 1 unhealthy d/yr today · 2 by 30 yrs out
Nearby sold comps map
Loading sold comps map…
Walkable amenities ~0.75 mi
Loading nearby amenities…
Taxation est. · year 1
- Rental income
- $13,020
- − Mortgage interest
- −$4,901
- − Property taxes
- −$1,705
- − Insurance
- −$438
- − Repairs & maintenance
- −$1,042
- − Management
- −$1,042
- − Depreciation
- −$2,545
- Taxable income
- $1,347
- Est. tax owed @ 24.0%
- −$323
- After-tax cash flow
- $2,313/yr
For passive investors: Depreciation is non-cash, so a rental often shows a tax loss while cash-flowing — sheltering income. Rental losses are passive: they offset passive income freely, and up to $25,000/yr can offset ordinary (W-2) income if you actively participate and your MAGI is under $100k (phasing out to $0 by $150k); unused losses carry forward. On sale, claimed depreciation is recaptured at up to 25%, and gains may owe capital-gains tax (a 1031 exchange can defer both). Figures are a year-1 estimate at your 24.0% rate — not tax advice; consult a CPA.
Schools (NCES district)
- District
- Akron City
- NCES district ID
- 3904348
- Math proficiency
- 22% ▼ -17.00%
- Reading proficiency
- 30% ▼ -12.00%
- Median HH income
- $33,811
- Composite
- 21.31/100
- National rank
- #8383
- State rank
- #602 of 656 in OH
Livability — Akron
- Score
- 81/100
- State rank
- #104
- US rank
- #1591
Category grades
Schools grade is shown separately in the Schools card above.
Census & demographics
- Census place
- Akron, OH
- County
- Summit County · 440,783 people
- City population
- 174,375
- Metro
- Akron, OH
- Population (ZIP)
- 17,885
- Household income
- $47,468
- Rent vs Own
- Severe rent burden
- 975.0
Population outlook (Summit County) Hauer SSP2
- Today (2025)
- 546,583 people
- By 2030
- 544,028 · -0.5%
- By 2040
- 531,363 · -2.8%
- By 2050
- 514,923 · -5.8%
- By 2075
- 481,765 · -11.9%
- By 2100
- 432,265 · -20.9%
Race, ethnicity, and origin ACS 2023
- Neighborhood character
- Predominantly White (69%)
- Race & ethnicity
- White 69% Black 16% Two or more races 12% Hispanic / Latino 3% Asian 3%
- Common ancestry
- Slovak 2% Romanian 2% Lithuanian 1%
- Foreign-born
- 3% · India, Canada, Philippines
- Languages at home
- 96% English-only · Chinese 2% Russian/Polish/Slavic 1% Spanish 1%
Political lean MEDSL · Summit
- 2024 margin
- Lean D (+7.0) · D 53.0% · R 46.0%
- 2008→2024 swing
- -9.6pp toward R · 2008: 16.6pp · 2024: 7.0pp
- All cycles
- 2024: D+7.0 2020: D+9.6 2016: D+8.2 2012: D+14.8 2008: D+16.6
Not yet ingested
- Civics
- —
Market trends
- HPI YoY
- ▼ -166.61%
- Current HPI
- 151.066
- Rent YoY
- ▲ 3.91%
- Metro
- Akron, OH
- State GDP YoY
- ▲ 1.98%
- F500 in state
- 48
Industry mix (Fortune 500 HQ in OH)
| Industry | F500 HQs | Revenue |
|---|---|---|
| Insurance | 3 | $145B |
|
||
| Industrial Machinery | 3 | $49B |
|
||
| Financial Services | 3 | $24B |
|
||
| Consumer Goods | 2 | $93B |
|
||
| Aerospace / Defense | 2 | $47B |
|
||
| Utilities | 2 | $33B |
|
||
Price history
+65.4% since first listed30 events — show timeline
- 2026-05-15 Pending — MLSNOW
- 2026-05-05 Listing Removed — MLSNOW
- 2026-05-05 Listed $87,500 MLSNOW
- 2026-04-08 Price Changed $90,000 MLSNOW
- 2026-03-24 Listed $92,500 MLSNOW
- 2026-02-09 Pending — MLSNOW
- 2026-02-08 Listing Removed — MLSNOW
- 2026-01-21 Listing Removed — MLSNOW
- 2026-01-21 Listed $95,000 MLSNOW
- 2026-01-15 Listed $95,000 MLSNOW
- 2025-10-15 Listing Removed — MLSNOW
- 2025-10-14 Relisted — MLSNOW
- 2025-09-28 Pending — MLSNOW
- 2025-08-02 Relisted — MLSNOW
- 2025-07-28 Pending — MLSNOW
- 2025-07-08 Listing Removed — MLSNOW
- 2025-07-08 Listed $99,990 MLSNOW
- 2025-04-18 Listed $119,000 MLSNOW
- 2024-04-25 Listed $119,777 MLSNOW
- 2021-04-14 Sold (MLS) $58,000 MLSNOW
- 2021-04-01 Pending — MLSNOW
- 2021-03-11 Contingent — MLSNOW
- 2021-02-24 Listed $59,900 MLSNOW
- 2008-08-22 Sold (Public Records) $65,000 Public Records
- 1995-03-14 Sold (Public Records) $51,500 Public Records
- 1995-03-14 Sold (MLS) $51,500 MLSNOW
- 1994-10-15 Listing Removed — MLSNOW
- 1994-10-13 Listed $55,900 MLSNOW
- 1994-10-12 Listed $55,900 MLSNOW
- 1994-04-07 Listed $52,900 MLSNOW
Property tax history
+2.4%/yrLatest (2025): $1,705 · +0.2% YoY. Source: county tax records.
Cash-flow waterfall
monthlySold comps — $/sqft
last 12 mo · ≤1 miLoading sold comps…