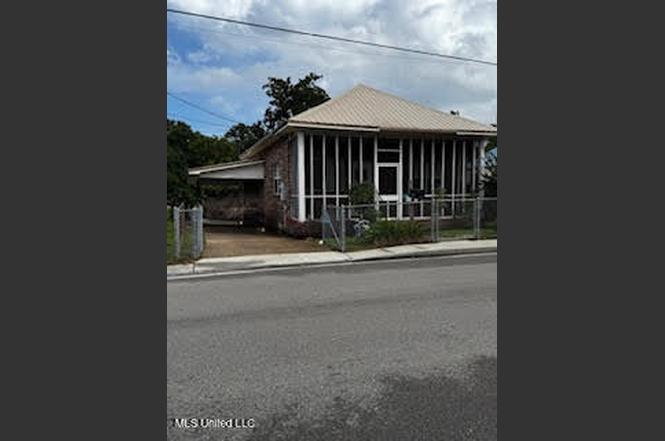
322 Main St · Biloxi, MS
Flood risk 8/10 · Major
- FEMA flood zone
- AE
- Chance of flooding over 30 yrs
- 0.97%
- Est. flood insurance / yr
- $1,737 – $8,500
Fire risk 1/10 · Minimal
- Est. fire insurance / yr
- $1,241 – $2,305
Heat risk 10/10 · Severe
- Hot days now (above 106°F)
- 7 days/yr
- Hot days in 30 yrs
- 22 days/yr
Wind risk 9/10 · Severe
- Chance of severe wind over 30 yrs
- 99.0%
Air-quality risk 2/10 · Minimal
- Unhealthy air days now
- 1 days/yr
- Unhealthy air days in 30 yrs
- 2 days/yr
Risk factors via First Street. Map © Google.
Why this score? — see what drove the B+ grade
The composite is a weighted blend of 9 inputs, each scored 0–100. Each bar is that input's sub-score; the figure is the points it added to the 100-point composite (weight × sub-score).
- Cash flow +30.0/30.0
- ARV discount +15.0/15.0
- 1% rule +10.0/10.0
- DSCR +10.0/10.0
- Schools +4.5/10.0
- Livability +4.0/5.0
- Rent growth +2.5/5.0
- Condition / age +2.5/5.0
- Appreciation +0.0/10.0
$99,900
🖨 Deal sheet (PDF) 📄 Offer letter ✓ Due diligence
Listing remarks
Back on the market. Charming home in the heart of Biloxi. Interior features 2 bedrooms with one and a half bath, screened in front porch, ceiling fans, window treatments, washer & dryer, wood cabinetry with stove, microwave, dishwasher and refrigerator. Exterior features driveway access from 2 streets, fenced yard, shed and awning for cars. Property being sold as is, with no repairs being made by seller.
Key facts
- Awning for cars
- Shed
- Fenced yard
Tags
Property features AI
Exterior
- Parking: Carport (2 spaces)
- Utilities: Public water; Public sewer; Cable available; Natural gas connected; Sewer connected; Water connected
- Home design: Single family residence (house); One level
- Construction: Brick veneer construction; Metal roof; Foundation: see remarks; Built (year source: public records)
- Exterior features: Back yard fencing
Interior
- Kitchen: Dishwasher; Free-standing range; Microwave; Refrigerator
- Bathrooms: 1 full bathroom; 1 half bathroom (1.5 total)
- Heating & cooling: Electric heating; Central air conditioning
- Interior features: Dishwasher; Free-standing range; Microwave; Refrigerator; Gas water heater; Washer and dryer
- Laundry & utility: Washer and dryer; Gas water heater
Neighborhood map
What this means for you Summary
Snapshot
- This is a 2-bed/1.0-bath single-family listed at $100k.
Deal economics
- At list price, monthly cash flow is $177 ($2k/yr) — positive.
- The deal already cash-flows at list — no discount required.
- Meets the 1% rule at list price ($2k rent vs $100k).
- Recommended offer: $94k (6.0% below list) — sets the bar for market timing.
- Cap rate 13.5% vs local median 3.5% in Biloxi — top-decile yield for the area; either an underpriced asset or a hidden risk that comps aren't pricing in. Stress-test before assuming the spread holds.
Location & tenants
- Location reads 79/100 on livability (#6 in MS, #2,141 nationally) — a middle-class / working-renter tenant base. Strengths: crime A+, cost of living A+, housing A+; Watch: commute D+, amenities F, employment D-.
- Biloxi Public School District (urban): math 60% / reading 48% proficiency, ranked #7 of 130 in MS (top 5%) — acceptable for families but not a draw, mixed tenant base, ~2y average lease.
- Zoned schools: Gorenflo Elementary School (math 42% / reading 37%, grade F, #122 of 375 statewide, top 34%, 350 students, 99% FRL); Biloxi Junior High (math 60% / reading 43%, grade C, #27 of 179 statewide, top 16%, 881 students, 100% FRL); Biloxi High School (math 65% / reading 53%, grade C+, #7 of 197 statewide, top 3%, 1,728 students, 100% FRL) — zoned schools average 100% FRL vs 59% district-wide (40 pts higher); higher-poverty schools than district average — tighter screening recommended.
- Market conditions: 167 active listings in the ZIP; 16 comparable units currently listed for rent nearby; rentals lingering (median 46d on market — plan ~5-8 weeks vacancy on turnover, expect pricing pressure); 75% of comp listings sitting > 30 days — soft ceiling on asking rent; lower-income renter base — watch delinquency; 2,194 units permitted in Harrison County in 2024 (0 in 5+ unit buildings).
- At $1,638/mo this rent would consume 48% of the median local household income ($41k/yr) (locally 329% of renters already pay >50% of income on rent) — very limited rent-growth headroom before tenants either downsize or default.
Forward outlook
- Local home prices are declining (-3.0%/yr); year-one equity from $691 of loan paydown is wiped out by about $3k of value loss. Plan a longer hold.
- Harrison County population projected at +27% by 2050 — long-run rental-demand tailwind backs the buy-and-hold thesis.
Negotiation context
- It's been on market 76 days — a 6% lower offer ($94k) is reasonable based on typical stale-listing flexibility.
- 2 sale attempts with the ask held roughly flat each time — persistent listings suggest the price (not the market) is what's stuck; bring a comps-based counter.
Risks & watch-outs
- Watch-outs: flood insurance adds $427/mo; built in 1930 — expect roof / HVAC / electrical / plumbing capex.
- Climate carrying-cost: in FEMA flood zone AE (mandatory federal flood insurance); severe wind risk, 99% chance of damaging wind over 30y; extreme-heat days projected 7→22/yr by 2055 (HVAC capex compounding) — expect insurance premiums to compound above CPI over the hold.
Questions for the listing agent
- It's been on market 76 days. Have you received any prior offers? Is the seller open to a 6% concession, seller financing, or rate buy-down credit?
- Built in 1930 — when were the roof, HVAC, electrical panel, plumbing, and water heater last replaced?
- What's the actual annual flood-insurance premium (NFIP or private), and is the property in a SFHA with mandatory coverage?
- Why hasn't it sold? Are there any deal-killer items the seller is aware of (foundation, flood, title, zoning, code violations)?
- Is there a deadline driving the sale (1031 exchange, divorce, estate, relocation)? That informs how much negotiation room exists.
- What's the average days-on-market for RENTAL listings here right now (not sales)? A rising rental-DOM trend means longer vacancies and softer asking-rent achievability than the comps imply.
- What's the recent tenant-quality profile in this submarket — average credit score on applications, eviction rate, late-payment / NSF rate, and stable-employment percentage? A property-management company in the area should have these aggregated.
- How much new for-sale + rental construction is in the pipeline within 1–3 miles? Heavy new supply typically softens prices + rents 12–24 months out; constrained supply supports both.
Investment metrics
- 1% rule
- 1.64% ✓
- Cap rate
- 13.55%
- Cash-on-cash
- 25.91%
- DSCR
- 2.15
- GRM
- 5.1
CMA / ARV
- ARV (on-the-fly)
- $125,856
- Comps found
- 12
Show comp detail 12 sales within ~0.75 mi
| Address | Dist | Beds/Ba | Sqft | Sold | Price | $/sf | Match |
|---|---|---|---|---|---|---|---|
| 617 Roy St | 0.18mi | 2/1.0 | 991 (-10%) | 3mo | $125,000 | $126 | 72 |
| 252 Seal Ave | 0.73mi | 2/1.0 | 1,100 (-0%) | 3mo | $130,000 | $118 | 63 |
| 415 Dacey St | 0.33mi | 2/1.0 | 1,009 (-9%) | 9mo | $90,000 | $89 | 62 |
| 326 Strangi Ave | 0.68mi | 2/1.0 | 1,181 (+7%) | 1mo | $135,000 | $114 | 56 |
| 620 Murray St | 0.26mi | 3/1.5 (+1) | 1,222 (+11%) | 9mo | $139,900 | $114 | 56 |
| 324 Haise St | 0.13mi | 3/2.0 (+1) | 1,269 (+15%) | 10mo | $139,900 | $110 | 52 |
| 202 Lee St | 0.50mi | 2/1.0 | 1,008 (-9%) | 13mo | $100,800 | $100 | 52 |
| 188 Bellman St | 0.48mi | 3/3.0 (+1) | 1,070 (-3%) | 11mo | $20,000 | $19 | 50 |
| 229 Holley St | 0.59mi | 2/2.0 | 1,222 (+11%) | 1mo | $139,000 | $114 | 50 |
| 183 Lee St | 0.55mi | 2/1.0 | 1,000 (-9%) | 11mo | $149,000 | $149 | 49 |
| 545 Esters Blvd | 0.55mi | 2/1.0 | 979 (-11%) | 11mo | $110,000 | $112 | 46 |
| 639 Howard Ave | 0.62mi | 2/1.5 | 1,200 (+9%) | 10mo | $295,000 | $246 | 46 |
Match score weights: distance 35% · size 25% · config 20% · recency 20%. Top-matched comps best support the ARV.
Projected returns pro-forma
-3.0% appreciation · 3.0% rent growth · sell at horizon
- IRR
- -4.4%
- Equity multiple
- 0.84×
- Total profit
- $-4,601
- Equity at exit
- $14,895
- IRR
- 5.6%
- Equity multiple
- 1.42×
- Total profit
- $11,711
- Equity at exit
- $8,638
Cash invested: $27,972 (down + closing). Projections, not guarantees.
Landlord ↔ Tenant lean methodology
- Overall (STATE)
- 90 Strongly Landlord-Friendly
- State Mississippi
- 90 Strongly Landlord-Friendly · R+11
- County
- — inherits STATE
- City
- — inherits STATE
ZIP-level market 39530
- Active inventory
- 167
- Price-to-rent
- 5.1×
Monthly cashflow live
- Estimated rent
- $1,638 high interval (Pro) →
- Mortgage (P&I)
- −$524
- Tax est. 1.5%
- −$125 /mo · $1,498/yr
- Insurance
- −$42
- Flood insurance flood zone
- −$427 /mo · $5,118/yr
- HOA
- −$0
- Vacancy / Maint / Mgmt
- −$344
- Net cashflow
- $177
Break-even live
Sensitivity live
| Price | -10% $246 | -5% $212 | +0% $177 | +5% $143 | +10% $108 |
|---|---|---|---|---|---|
| Rent | -10% $48 | -5% $113 | +0% $177 | +5% $242 | +10% $307 |
| Rate | -1.0pp $228 | -0.5pp $203 | base $177 | +0.5pp $152 | +1.0pp $125 |
UW: 25.0% down · 7.5% · 30yr · 1.5% tax · 5.0% vac · 8.0% maint · 8.0% mgmt
Financing live
Cash to close
- Down payment
- $24,975
- Closing costs
- $2,997
- Reserves months
- —
- Total cash needed
- —
Loan-product check · same deal, 3 products live
Conventional
25% down · 7.5% · 30yr
- Down + closing
- —
- Monthly P&I
- —
- Monthly cashflow
- —
- DSCR
- —
- Eligible?
- —
Personal DTI + credit; lowest rate.
DSCR
20% down · 8.5% · 30yr
- Down + closing
- —
- Monthly P&I
- —
- Monthly cashflow
- —
- DSCR
- —
- Eligible?
- —
No personal income docs; deal must DSCR.
Hard money
10% down · 12.0% · 12mo
- Down + closing
- —
- Monthly P&I
- —
- Monthly cashflow
- —
- DSCR
- —
- Eligible?
- —
Short-term bridge; refi at stabilization.
Rent comps 16 comps
| Address | Beds | Baths | Sqft | Rent | $/sqft | DOM | Units | Dist |
|---|---|---|---|---|---|---|---|---|
| 271 Ebony Ln Biloxi, MS | 3.0 | 2.0 | 1498 | $1,600 | $1.07 | 15d | 1 | 0.29mi |
| 620 Murray St Biloxi, MS | 3.0 | 1.5 | 1300 | $1,600 | $1.23 | 45d | 1 | 0.30mi |
| 270 Bohn St Biloxi, MS | 2.0 | 1.0 | 1050 | $1,200 | $1.14 | 46d | 1 | 0.51mi |
| 962 Thelma St Biloxi, MS | 3.0 | 2.0 | 1200 | $1,649 | $1.37 | 45d | 1 | 0.64mi |
| 902 Howard Ave Biloxi, MS | 1.0 | 1.0 | 850 | $1,300 | $1.53 | 45d | 1 | 0.64mi |
| 309 Seal Ave Biloxi, MS | 2.0 | 1.0 | 1100 | $1,400 | $1.27 | 23d | 1 | 0.69mi |
| 129 Fayard St Biloxi, MS | 1.0 | 1.0 | 800 | $1,300 | $1.62 | 23d | 1 | 0.72mi |
| 133 Hopkins Blvd Biloxi, MS | 2.0 | 1.0 | 800 | $2,400 | $3.00 | 45d | 1 | 0.84mi |
| 269 Benachi Ave Biloxi, MS | 2.0 | 1.5 | 1017 | $2,250 | $2.21 | 45d | 1 | 0.88mi |
| 265 Benachi Ave Biloxi, MS | 2.0 | 1.5 | 1015 | $2,000 | $1.97 | 45d | 1 | 0.88mi |
| 259 Benachi Ave Biloxi, MS | 2.0 | 1.5 | 1100 | $1,900 | $1.73 | 45d | 1 | 0.89mi |
| 255 Benachi Ave Biloxi, MS | 2.0 | 1.5 | 1008 | $2,000 | $1.98 | 45d | 1 | 0.89mi |
| 520 Beach Blvd Biloxi, MS | 2.0 | 2.0 | 1089 | $2,950 | $2.71 | 45d | 1 | 0.89mi |
| 420 Richmond Dr Biloxi, MS | 3.0 | 2.0 | 1020 | $1,600 | $1.57 | 45d | 1 | 0.93mi |
| 306 4th St Biloxi, MS | 2.0 | 1.0 | 1000 | $1,500 | $1.50 | 45d | 1 | 1.14mi |
| 1135 Judge Sekul Ave Biloxi, MS | 1.0–2.0 | 1.0 | 880 | $899 | $1.02 | 15d | 3 | 1.18mi |
Listing history 9 events
-
2026-04-25status Pending
-
2026-04-01price $99,900
-
2026-03-23price $102,900
-
2026-02-27price $104,900
-
2026-02-27status Active
-
2026-01-05status Pending
-
2025-12-15$99,900 Active
-
2012-12-28soldstatus
-
2010-07-30soldstatus
ⓘ Source: listings_history table (triggers on properties + properties_extension) + one-shot
backfill from property_details.listing_events for pre-trigger history.
Climate risk First Street
- Flood 8/10 Severe FEMA zone AE · 97% chance over 30 yrs
- Wildfire 1/10 Low
- Heat 10/10 Extreme 7 d/yr ≥106°F today · 22 d/yr by 30 yrs out
- Wind 9/10 Extreme 99% chance of damaging wind over 30 yrs
- Air quality 2/10 Low 1 unhealthy d/yr today · 2 by 30 yrs out
Nearby sold comps map
Loading sold comps map…
Walkable amenities ~0.75 mi
Loading nearby amenities…
Taxation est. · year 1
- Rental income
- $19,661
- − Mortgage interest
- −$5,596
- − Property taxes
- −$1,498
- − Insurance
- −$5,618
- − Repairs & maintenance
- −$1,573
- − Management
- −$1,573
- − Depreciation
- −$2,906
- Taxable income
- $897
- Est. tax owed @ 24.0%
- −$215
- After-tax cash flow
- $1,914/yr
For passive investors: Depreciation is non-cash, so a rental often shows a tax loss while cash-flowing — sheltering income. Rental losses are passive: they offset passive income freely, and up to $25,000/yr can offset ordinary (W-2) income if you actively participate and your MAGI is under $100k (phasing out to $0 by $150k); unused losses carry forward. On sale, claimed depreciation is recaptured at up to 25%, and gains may owe capital-gains tax (a 1031 exchange can defer both). Figures are a year-1 estimate at your 24.0% rate — not tax advice; consult a CPA.
Schools (NCES district)
- District
- Biloxi Public School District
- NCES district ID
- 2800630
- Math proficiency
- 60% ▼ -7.00%
- Reading proficiency
- 48% ▼ -3.00%
- Median HH income
- $40,608
- Composite
- 45.26/100
- National rank
- #2657
- State rank
- #7 of 130 in MS
Livability — Biloxi
- Score
- 79/100
- State rank
- #6
- US rank
- #2141
Category grades
Schools grade is shown separately in the Schools card above.
Census & demographics
- Census place
- Biloxi, MS
- County
- Harrison County · 178,171 people
- City population
- 63,281
- Metro
- Gulfport-Biloxi, MS
- Population (ZIP)
- 7,701
- Household income
- $41,117
- Rent vs Own
- Severe rent burden
- 329.0
Population outlook (Harrison County) Hauer SSP2
- Today (2025)
- 228,444 people
- By 2030
- 241,942 · +5.9%
- By 2040
- 267,531 · +17.1%
- By 2050
- 291,062 · +27.4%
- By 2075
- 346,711 · +51.8%
- By 2100
- 378,165 · +65.5%
Race, ethnicity, and origin ACS 2023
- Neighborhood character
- Diverse neighborhood (Simpson 0.66)
- Race & ethnicity
- White 48% Black 28% Hispanic / Latino 15% Two or more races 5% Asian 4% Native American 3%
- Hispanic origin (detail)
- Mexican 6%
- Common ancestry
- Lithuanian 9% Slovak 2% Italian 1%
- Foreign-born
- 13% · Canada, Vietnam
- Languages at home
- 82% English-only · Spanish 14% Vietnamese 2% Other Indo-European 1%
Political lean MEDSL · Harrison
- 2024 margin
- Strong R (+28.9) · D 35.0% · R 63.9% · Other 1.1%
- 2008→2024 swing
- -2.9pp toward R · 2008: -26.0pp · 2024: -28.9pp
- All cycles
- 2024: R+28.9 2020: R+25.2 2016: R+30.7 2012: R+26.6 2008: R+26.0
Not yet ingested
- Civics
- —
Market trends
- HPI YoY
- ▼ -108.19%
- Current HPI
- 181.0603
- Rent YoY
- —
- Metro
- Gulfport-Biloxi, MS
- State GDP YoY
- —
- F500 in state
- 0
Price history
+0.0% since first listed9 events — show timeline
- 2026-04-25 Pending — MLSU
- 2026-04-01 Price Changed $99,900 MLSU
- 2026-03-23 Price Changed $102,900 MLSU
- 2026-02-27 Price Changed $104,900 MLSU
- 2026-02-27 Relisted — MLSU
- 2026-01-05 Pending — MLSU
- 2025-12-15 Listed $99,900 MLSU
- 2012-12-28 Sold (Public Records) — Public Records
- 2010-07-30 Sold (Public Records) — Public Records
Cash-flow waterfall
monthlySold comps — $/sqft
last 12 mo · ≤1 miLoading sold comps…