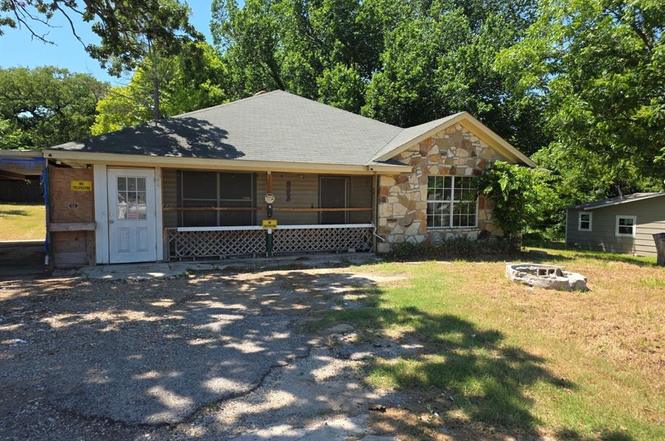
609 Bryan St · Weatherford, TX
Flood risk 1/10 · Minimal
- FEMA flood zone
- X (unshaded)
- Chance of flooding over 30 yrs
- 0.0%
- Est. flood insurance / yr
- $507 – $1,088
Fire risk 6/10 · Moderate
- Est. fire insurance / yr
- $1,222 – $2,270
Heat risk 7/10 · Major
- Hot days now (above 107°F)
- 7 days/yr
- Hot days in 30 yrs
- 21 days/yr
Wind risk 4/10 · Minor
- Chance of severe wind over 30 yrs
- 20.0%
Air-quality risk 2/10 · Minimal
- Unhealthy air days now
- 1 days/yr
- Unhealthy air days in 30 yrs
- 2 days/yr
Risk factors via First Street. Map © Google.
Why this score? — see what drove the C+ grade
The composite is a weighted blend of 9 inputs, each scored 0–100. Each bar is that input's sub-score; the figure is the points it added to the 100-point composite (weight × sub-score).
- Cash flow +22.6/30.0
- ARV discount +15.0/15.0
- 1% rule +8.1/10.0
- DSCR +7.3/10.0
- Schools +3.6/10.0
- Livability +3.6/5.0
- Condition / age +2.5/5.0
- Rent growth +2.3/5.0
- Appreciation +0.0/10.0
$150,000
🖨 Deal sheet (PDF) 📄 Offer letter ✓ Due diligence
Listing remarks MLS
Move in ready home near Weatherford's Downtown Square and shopping! This spacious home offers 1730 sqft of living space with 3 bedrooms, 2 baths, large living area, utility room, open dining and kitchen with a new stove, and oversized pantry. The house sits on a large peaceful lot with scattered trees and covered parking. This home has a lot to offer and a must see.
Key facts
- 9,017 sq ft lot
- 2 parking spots
- Built 1998
Property features AI
Finance
- Other: Property subtype: Single Family Residence; Lot is less than 0.5 acre (approximately 0.207 acres); Parcel/PPN: R000019326; Restrictions: Unknown encumbrance(s)
- Financial info: Listing terms include cash and conventional; Special listing condition: Real Estate Owned
- HOA & community: No association; Community features: Other
Exterior
- Parking: Covered parking; 2 carport spaces; 2 covered spaces; No garage
- Utilities: City water; City sewer; Cable available; Asphalt access
- Home design: Single-family residence; Residential property; One story; Preowned (built in 1998)
- Construction: Brick, wood and other construction materials; Composition roof; Built in 1998
- Exterior features: Covered patio/porch; Grassed yard; Interior lot
Interior
- Kitchen: Appliances: Other
- Bedrooms: 3 bedrooms (all on main level); Primary bedroom on main level
- Bathrooms: 2 full bathrooms; 1 half bathroom (on main level)
- Heating & cooling: Central heating; Central air conditioning
- Interior features: Cable TV available; 7 total rooms; One-level layout; 1 living area; 1 dining area
- Laundry & utility: Full-size washer/dryer area
Neighborhood map
What this means for you Summary
Snapshot
- This is a 3-bed/2.5-bath single-family listed at $150k.
Deal economics
- At list price, monthly cash flow is $256 ($3k/yr) — positive.
- The deal already cash-flows at list — no discount required.
- Meets the 1% rule at list price ($2k rent vs $150k).
- Cap rate 8.3% vs local median 2.7% in Weatherford — top-decile yield for the area; either an underpriced asset or a hidden risk that comps aren't pricing in. Stress-test before assuming the spread holds.
Location & tenants
- Location reads 71/100 on livability (#289 in TX) — a middle-class / working-renter tenant base. Strengths: cost of living A+, housing A+, crime B+; Watch: health & safety D+, amenities F, commute F.
- Weatherford ISD (town): math 39% / reading 44% proficiency, ranked #321 of 826 in TX (top 39%) — families likely to look elsewhere, expect single-tenant / working-renter base with shorter leases.
- Zoned schools: Curtis El (math 43% / reading 43%, grade F, #1,283 of 4,322 statewide, top 30%, 644 students, 51% FRL); Hall Middle (math 43% / reading 45%, grade D, #512 of 1,662 statewide, top 32%, 973 students, 47% FRL); Weatherford H S (math 33% / reading 53%, grade F, #713 of 1,632 statewide, top 44%, 2,525 students, 40% FRL) — zoned schools at 46% FRL track the district average.
- Market conditions: Rents soft (-0.9%/yr); 165 active listings in the ZIP; 24 comparable units currently listed for rent nearby; rentals at typical pace (median 27d on market — plan ~3-4 weeks tenant-placement turnaround); 437 units permitted in Parker County in 2024 (0 in 5+ unit buildings).
- This rent runs 39% of the median local income ($61k/yr) — at the standard rent-burdened threshold; future hikes will face affordability resistance.
Forward outlook
- Local home prices are declining (-3.0%/yr); year-one equity from $1k of loan paydown is wiped out by about $4k of value loss. Plan a longer hold.
- Parker County population projected at +32% by 2050 — long-run rental-demand tailwind backs the buy-and-hold thesis.
Negotiation context
- Only 6 days on market — expect competitive offers; lowballing is unlikely to land.
- 2 sale attempts since 5y ago with the ask held roughly flat each time — persistent listings suggest the price (not the market) is what's stuck; bring a comps-based counter.
Risks & watch-outs
- Watch-outs: property tax is 3.6% of price.
- Climate carrying-cost: major wildfire risk; extreme-heat days projected 7→21/yr by 2055 (HVAC capex compounding) — expect insurance premiums to compound above CPI over the hold.
Questions for the listing agent
- Property tax is high relative to price — has the assessment been appealed recently, and will the sale trigger a re-assessment?
- Is there a deadline driving the sale (1031 exchange, divorce, estate, relocation)? That informs how much negotiation room exists.
- Schools are D-rated, which usually means shorter tenancies and higher turnover. Who's the typical renter profile here, and what's been the actual vacancy rate?
- What's the average days-on-market for RENTAL listings here right now (not sales)? A rising rental-DOM trend means longer vacancies and softer asking-rent achievability than the comps imply.
- What's the recent tenant-quality profile in this submarket — average credit score on applications, eviction rate, late-payment / NSF rate, and stable-employment percentage? A property-management company in the area should have these aggregated.
- How much new for-sale + rental construction is in the pipeline within 1–3 miles? Heavy new supply typically softens prices + rents 12–24 months out; constrained supply supports both.
Investment metrics
- 1% rule
- 1.31% ✓
- Cap rate
- 8.34%
- Cash-on-cash
- 7.31%
- DSCR
- 1.33
- GRM
- 6.4
CMA / ARV
- ARV (on-the-fly)
- $280,260
- Comps found
- 12
Show comp detail 12 sales within ~0.75 mi
| Address | Dist | Beds/Ba | Sqft | Sold | Price | $/sf | Match |
|---|---|---|---|---|---|---|---|
| 427 W Ball St | 0.19mi | 3/2.0 | 1,691 (-2%) | 6mo | $259,900 | $154 | 80 |
| 307 Bryan St | 0.29mi | 3/2.0 | 1,766 (+2%) | 7mo | $320,000 | $181 | 75 |
| 519 Bryan St | 0.06mi | 4/2.0 (+1) | 1,820 (+5%) | 12mo | $289,500 | $159 | 72 |
| 714 W Ball St | 0.19mi | 3/2.5 | 1,579 (-9%) | 8mo | $249,000 | $158 | 70 |
| 801 Hanover St | 0.40mi | 3/2.0 | 1,784 (+3%) | 8mo | $350,000 | $196 | 68 |
| 702 W Spring St | 0.39mi | 2/1.0 (-1) | 1,716 (-1%) | 6mo | $215,000 | $125 | 64 |
| 411 Harcourt St | 0.29mi | 3/3.0 | 1,853 (+7%) | 11mo | $299,500 | $162 | 63 |
| 119 Wheeler St | 0.41mi | 3/2.0 | 1,572 (-9%) | 5mo | $270,000 | $172 | 60 |
| 1417 Oliver St | 0.71mi | 3/1.5 | 1,764 (+2%) | 2mo | $145,000 | $82 | 58 |
| 1032 W Oak St Unit A | 0.73mi | 3/2.0 | 1,787 (+3%) | 2mo | $119,900 | $67 | 57 |
| 407 W Columbia St | 0.71mi | 2/2.0 (-1) | 1,620 (-6%) | 4mo | $449,900 | $278 | 46 |
| 1213 Franklin St | 0.57mi | 4/2.0 (+1) | 1,568 (-9%) | 7mo | $324,900 | $207 | 45 |
Match score weights: distance 35% · size 25% · config 20% · recency 20%. Top-matched comps best support the ARV.
Projected returns pro-forma
-3.0% appreciation · 0.0% rent growth · sell at horizon
- IRR
- -9.2%
- Equity multiple
- 0.68×
- Total profit
- $-13,578
- Equity at exit
- $22,365
- IRR
- -5.4%
- Equity multiple
- 0.71×
- Total profit
- $-12,329
- Equity at exit
- $12,969
Cash invested: $42,000 (down + closing). Projections, not guarantees.
Landlord ↔ Tenant lean methodology
- Overall (STATE)
- 87 Strongly Landlord-Friendly
- State Texas
- 87 Strongly Landlord-Friendly · R+5
- County
- — inherits STATE
- City
- — inherits STATE
ZIP-level market 76086
- Rents YoY
- -0.9%
- Active inventory
- 165
- Price-to-rent
- 6.4×
Monthly cashflow live
- Estimated rent
- $1,966 high interval (Pro) →
- Mortgage (P&I)
- −$787
- Tax from tax record
- −$448 /mo · $5,377/yr
- Insurance
- −$62
- HOA
- −$0
- Vacancy / Maint / Mgmt
- −$413
- Net cashflow
- $256
Break-even live
Sensitivity live
| Price | -10% $341 | -5% $298 | +0% $256 | +5% $213 | +10% $171 |
|---|---|---|---|---|---|
| Rent | -10% $101 | -5% $178 | +0% $256 | +5% $334 | +10% $411 |
| Rate | -1.0pp $331 | -0.5pp $294 | base $256 | +0.5pp $217 | +1.0pp $178 |
UW: 25.0% down · 7.5% · 30yr · 1.5% tax · 5.0% vac · 8.0% maint · 8.0% mgmt
Financing live
Cash to close
- Down payment
- $37,500
- Closing costs
- $4,500
- Reserves months
- —
- Total cash needed
- —
Loan-product check · same deal, 3 products live
Conventional
25% down · 7.5% · 30yr
- Down + closing
- —
- Monthly P&I
- —
- Monthly cashflow
- —
- DSCR
- —
- Eligible?
- —
Personal DTI + credit; lowest rate.
DSCR
20% down · 8.5% · 30yr
- Down + closing
- —
- Monthly P&I
- —
- Monthly cashflow
- —
- DSCR
- —
- Eligible?
- —
No personal income docs; deal must DSCR.
Hard money
10% down · 12.0% · 12mo
- Down + closing
- —
- Monthly P&I
- —
- Monthly cashflow
- —
- DSCR
- —
- Eligible?
- —
Short-term bridge; refi at stabilization.
Rent comps 24 comps
| Address | Beds | Baths | Sqft | Rent | $/sqft | DOM | Units | Dist |
|---|---|---|---|---|---|---|---|---|
| 302 W Spring St Weatherford, TX | 3.0 | 2.5 | 1800 | $1,900 | $1.06 | 46d | 1 | 0.47mi |
| 106 N Merrimac St Weatherford, TX | 3.0 | 2.0 | 1064 | $1,650 | $1.55 | 26d | 1 | 0.48mi |
| 442 W Oak St Weatherford, TX | 3.0 | 2.5 | 1840 | $2,150 | $1.17 | 46d | 1 | 0.59mi |
| 422 W Oak St Unit 422 Weatherford, TX | 3.0 | 2.5 | 1840 | $2,100 | $1.14 | 46d | 1 | 0.60mi |
| 217 Clinton Dr Weatherford, TX | 3.0 | 2.0 | 1296 | $1,750 | $1.35 | 24d | 1 | 0.70mi |
| 1316 Eastview Dr Weatherford, TX | 3.0 | 1.5 | 1271 | $2,100 | $1.65 | 14d | 1 | 0.73mi |
| 1407 Franklin St Weatherford, TX | 3.0 | 1.0 | 1222 | $1,550 | $1.27 | 46d | 1 | 0.75mi |
| 710 N Rusk St Weatherford, TX | 3.0 | 2.0 | 1280 | $2,095 | $1.64 | 46d | 1 | 0.81mi |
| 1501 Hanover St Weatherford, TX | 2.0 | 2.0 | 1067 | $1,900 | $1.78 | 19d | 1 | 0.83mi |
| 303 E 2nd St Weatherford, TX | 3.0 | 2.0 | 1291 | $1,595 | $1.24 | 46d | 1 | 0.83mi |
| 405 S Brazos St Weatherford, TX | 3.0 | 2.0 | 2146 | $2,500 | $1.16 | 26d | 1 | 0.84mi |
| 303 S Elm St Weatherford, TX | 4.0 | 2.0 | 1500 | $2,250 | $1.50 | 6d | 1 | 0.92mi |
| 206 E Columbia St Weatherford, TX | 2.0 | 2.0 | 1440 | $2,300 | $1.60 | 1d | 1 | 0.93mi |
| 1434 W Water St Weatherford, TX | 3.0 | 2.0 | 1554 | $1,795 | $1.16 | 9d | 1 | 1.00mi |
| 1316 Liberty St Weatherford, TX | 3.0 | 2.0 | 1545 | $2,200 | $1.42 | 24d | 1 | 1.08mi |
| 809 S Lamar St Weatherford, TX | 3.0 | 2.0 | 1650 | $2,800 | $1.70 | 21d | 1 | 1.09mi |
| 610 E Water St Weatherford, TX | 3.0 | 2.0 | 1474 | $1,700 | $1.15 | 46d | 1 | 1.09mi |
| 101 Hummingbird Dr Weatherford, TX | 3.0 | 2.0 | 1500 | $2,200 | $1.47 | 0d | 1 | 1.16mi |
| 1122 Story Book Ln Weatherford, TX | 3.0 | 2.0 | 1182 | $1,850 | $1.57 | 6d | 1 | 1.35mi |
| 510 E Akard St Unit 400 Weatherford, TX | 2.0 | 2.0 | 1200 | $1,499 | $1.25 | 7d | 1 | 1.42mi |
| 509 Eureka St Unit 100 Weatherford, TX | 2.0 | 2.0 | 1200 | $1,499 | $1.25 | 26d | 1 | 1.45mi |
| 105 Brazos Ln Unit 107 Weatherford, TX | 3.0 | 2.0 | 1155 | $1,795 | $1.55 | 46d | 1 | 1.48mi |
| 107 Brazos Ln Weatherford, TX | 3.0 | 2.0 | 1155 | $1,795 | $1.55 | 46d | 1 | 1.49mi |
| 217 Rentz Place Cir Weatherford, TX | 3.0 | 2.0 | 1155 | $1,875 | $1.62 | 7d | 1 | 1.49mi |
Listing history 4 events
-
2026-06-21days on market $150,000 Active 6 DOM
-
2026-06-18days on market $150,000 Active 3 DOM
-
2026-06-17days on market $150,000 Active 2 DOM
-
2026-06-16$150,000 Active 1 DOM
ⓘ Source: listings_history table (triggers on properties + properties_extension) + one-shot
backfill from property_details.listing_events for pre-trigger history.
Tax reassessment forecast TX · Resets to sale price
- Current annual tax
- $5,377 · $448/mo
- Projected year-2 tax
- $5,377 · $448/mo
- Expected delta
- $0/yr ($0/mo · 0.0%)
ⓘ Screening estimate from a state-policy table — verify with the county assessor before closing.
Climate risk First Street
- Flood 1/10 Low FEMA zone X (unshaded) · 0% chance over 30 yrs
- Wildfire 6/10 Major
- Heat 7/10 Severe 7 d/yr ≥107°F today · 21 d/yr by 30 yrs out
- Wind 4/10 Moderate 20% chance of damaging wind over 30 yrs
- Air quality 2/10 Low 1 unhealthy d/yr today · 2 by 30 yrs out
Nearby sold comps map
Loading sold comps map…
Walkable amenities ~0.75 mi
Loading nearby amenities…
Taxation est. · year 1
- Rental income
- $23,592
- − Mortgage interest
- −$8,402
- − Property taxes
- −$5,377
- − Insurance
- −$750
- − Repairs & maintenance
- −$1,887
- − Management
- −$1,887
- − Depreciation
- −$4,364
- Taxable income
- $924
- Est. tax owed @ 24.0%
- −$222
- After-tax cash flow
- $2,849/yr
For passive investors: Depreciation is non-cash, so a rental often shows a tax loss while cash-flowing — sheltering income. Rental losses are passive: they offset passive income freely, and up to $25,000/yr can offset ordinary (W-2) income if you actively participate and your MAGI is under $100k (phasing out to $0 by $150k); unused losses carry forward. On sale, claimed depreciation is recaptured at up to 25%, and gains may owe capital-gains tax (a 1031 exchange can defer both). Figures are a year-1 estimate at your 24.0% rate — not tax advice; consult a CPA.
Schools (NCES district)
- District
- Weatherford ISD
- NCES district ID
- 4844800
- Math proficiency
- 39% ▼ -3.00%
- Reading proficiency
- 44% ▼ -2.00%
- Median HH income
- $57,087
- Composite
- 36.4/100
- National rank
- #4679
- State rank
- #321 of 826 in TX
Livability — Weatherford
- Score
- 71/100
- State rank
- #289
- US rank
- #6648
Category grades
Schools grade is shown separately in the Schools card above.
Census & demographics
- Census place
- Weatherford, TX
- County
- Parker County · 144,797 people
- City population
- 60,150
- Metro
- Dallas-Fort Worth-Arlington, TX
- Population (ZIP)
- 23,328
- Household income
- $60,578
- Rent vs Own
- Severe rent burden
- 1143.0
Population outlook (Parker County) Hauer SSP2
- Today (2025)
- 147,426 people
- By 2030
- 157,863 · +7.1%
- By 2040
- 177,519 · +20.4%
- By 2050
- 194,786 · +32.1%
- By 2075
- 238,799 · +62.0%
- By 2100
- 264,126 · +79.2%
Race, ethnicity, and origin ACS 2023
- Neighborhood character
- Predominantly White (73%)
- Race & ethnicity
- White 73% Hispanic / Latino 17% Two or more races 10% Black 4% Asian 2%
- Hispanic origin (detail)
- Mexican 15%
- Common ancestry
- Italian 3% Lithuanian 2% Serbian 2%
- Foreign-born
- 6% · Canada, Vietnam, China
- Languages at home
- 88% English-only · Spanish 9% Vietnamese 2%
Political lean MEDSL · Parker
- 2024 margin
- Solid R (+66.4) · D 16.4% · R 82.8%
- 2008→2024 swing
- -11.2pp toward R · 2008: -55.2pp · 2024: -66.4pp
- All cycles
- 2024: R+66.4 2020: R+64.4 2016: R+67.5 2012: R+65.8 2008: R+55.2
Not yet ingested
- Civics
- —
Market trends
- HPI YoY
- ▼ -264.48%
- Current HPI
- 230.8312
- Rent YoY
- ▼ -0.90%
- Metro
- Dallas-Fort Worth-Arlington, TX
- State GDP YoY
- ▲ 3.95%
- F500 in state
- 110
Industry mix (Fortune 500 HQ in TX)
| Industry | F500 HQs | Revenue |
|---|---|---|
| Energy | 16 | $1,198B |
|
||
| Technology | 5 | $198B |
|
||
| Engineering / Construction | 4 | $72B |
|
||
| Energy Services | 3 | $60B |
|
||
| Utilities | 3 | $41B |
|
||
| Healthcare | 2 | $330B |
|
||
Price history
-46.8% since first listed7 events — show timeline
- 2026-06-06 Listed $150,000 NTREIS
- 2022-02-23 Sold (Public Records) — Public Records
- 2022-02-22 Sold (MLS) — NTREIS
- 2022-02-07 Pending — NTREIS
- 2022-01-28 Contingent — NTREIS
- 2021-12-19 Listed $282,000 NTREIS
- 2018-09-28 Sold (Public Records) — Public Records
Property tax history
+4.7%/yrLatest (2025): $5,377 · -5.4% YoY. Source: county tax records.
Cash-flow waterfall
monthlySold comps — $/sqft
last 12 mo · ≤1 miLoading sold comps…