 Fourplex
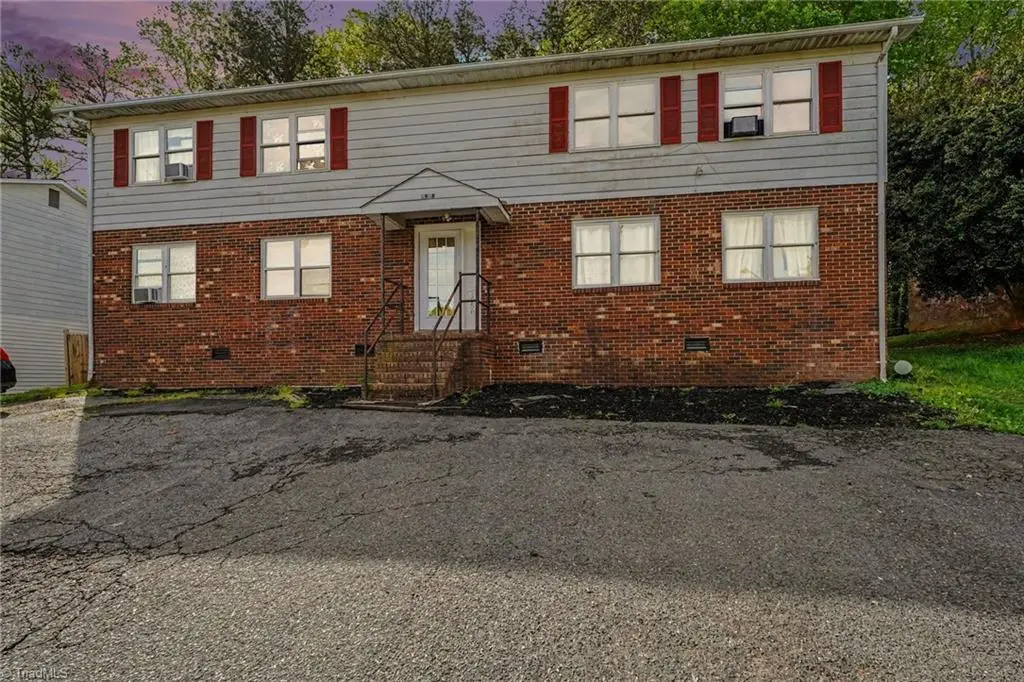
1958 Lakeview Rd · Asheboro, NC
Flood risk 1/10 · Minimal
- FEMA flood zone
- X (unshaded)
- Chance of flooding over 30 yrs
- 0.0%
- Est. flood insurance / yr
- $507 – $1,088
Fire risk 3/10 · Minor
- Est. fire insurance / yr
- $906 – $1,684
Heat risk 5/10 · Moderate
- Hot days now (above 103°F)
- 7 days/yr
- Hot days in 30 yrs
- 17 days/yr
Wind risk 5/10 · Moderate
- Chance of severe wind over 30 yrs
- 23.0%
Air-quality risk 2/10 · Minimal
- Unhealthy air days now
- 1 days/yr
- Unhealthy air days in 30 yrs
- 1 days/yr
Risk factors via First Street. Map © Google.
Why this score? — see what drove the C- grade
The composite is a weighted blend of 9 inputs, each scored 0–100. Each bar is that input's sub-score; the figure is the points it added to the 100-point composite (weight × sub-score).
- Cash flow +22.1/30.0
- ARV discount +7.5/15.0
- DSCR +7.1/10.0
- 1% rule +5.8/10.0
- Livability +3.6/5.0
- Rent growth +3.5/5.0
- Schools +2.6/10.0
- Condition / age +2.2/5.0
- Appreciation +0.0/10.0
$395,000
🖨 Deal sheet (PDF) 📄 Offer letter ✓ Due diligence
Multi-family units
County records classify this as Multi-Family (2-4 Unit). Listing-text estimate: 4 units. confirmed
Listing remarks MLS
Investors! this Quadplex or 4 Unit Building 3456 SQ Ft 3 of units already Rented, Priced to Sell! Seller is Real Estate Agent.
Key facts
- 0.25 acre lot
- Built 1979
- Listed 32 days
Property features AI
Finance
- Other: Directions: 220 Business North TR on E Central Ave then 1/2 mile TL on Lakeview Rd; 1958 on right
- Financial info: Annual tax amount $1,614
- HOA & community: No association
Exterior
- Parking: Paved
- Utilities: Public water; Public sewer; Electric water heater
- Home design: Residential income property; Quadruplex; Built in 1979; Existing structure
- Construction: Electric water heater
- Exterior features: Paved parking
Interior
- Kitchen: Electric water heater
- Heating & cooling: Central air conditioning; Forced air heating (electric)
- Interior features: No basement
Neighborhood map
What this means for you Summary
Snapshot
- This is a 4 × 2-bed/1-bath units multifamily listed at $395k. Condition is rated fair.
Deal economics
- At list price, monthly cash flow is $633 ($8k/yr) — positive. Per door: $158/mo.
- The deal already cash-flows at list — no discount required.
- Meets the 1% rule at list price ($4k rent vs $395k).
- Recommended offer: $383k (3.0% below list) — sets the bar for market timing.
- Cap rate 8.2% vs local median 2.9% in Asheboro — top-decile yield for the area; either an underpriced asset or a hidden risk that comps aren't pricing in. Stress-test before assuming the spread holds.
Location & tenants
- Location reads 72/100 on livability (#85 in NC) — a middle-class / working-renter tenant base. Strengths: cost of living A+, health & safety A+, housing A; Watch: crime F, amenities F, employment F.
- Asheboro City Schools (town): math 29% / reading 33% proficiency, ranked #145 of 178 in NC (top 82%) — families likely to look elsewhere, expect single-tenant / working-renter base with shorter leases; 64% free/reduced lunch — lower-income household profile, screen leases tightly.
- Zoned schools: Balfour Elementary (math 23% / reading 29%, grade F, #1,085 of 1,410 statewide, top 77%, 516 students, 81% FRL); North Asheboro Middle (math 16% / reading 29%, grade F, #410 of 475 statewide, top 87%, 487 students, 85% FRL); Asheboro High (math 48% / reading 49%, grade D, #326 of 535 statewide, top 61%, 1,339 students, 69% FRL).
- Market conditions: Rents rising (+3.8%/yr); 91 active listings in the ZIP; 19 comparable units currently listed for rent nearby; rentals at typical pace (median 17d on market — plan ~3-4 weeks tenant-placement turnaround); 789 units permitted in Randolph County in 2024 (168 in 5+ unit buildings).
- At $4,257/mo this rent would consume 110% of the median local household income ($46k/yr) (locally 1201% of renters already pay >50% of income on rent) — very limited rent-growth headroom before tenants either downsize or default.
Forward outlook
- Local home prices are declining (-3.0%/yr); year-one equity from $3k of loan paydown is wiped out by about $12k of value loss. Plan a longer hold.
- Randolph County population projected to shrink 10% by 2050 — rents likely to lag national; underwrite the cash flow, not the appreciation.
Negotiation context
- It's been on market 32 days — a 3% lower offer ($383k) is reasonable based on typical stale-listing flexibility.
- 4 sale attempts since 10y ago with the ask held roughly flat each time — persistent listings suggest the price (not the market) is what's stuck; bring a comps-based counter.
- Current owner paid $88k; list at $395k implies a 351% gain — meaningful room to come down on a strong offer.
Risks & watch-outs
- Climate carrying-cost: moderate wind risk, 23% chance of damaging wind over 30y; extreme-heat days projected 7→17/yr by 2055 (HVAC capex compounding) — expect insurance premiums to compound above CPI over the hold.
Questions for the listing agent
- It's been on market 32 days. Have you received any prior offers? Is the seller open to a 3% concession, seller financing, or rate buy-down credit?
- Can we see the unit-by-unit rent roll, current vacancy, and any below-market leases? What's the average tenancy length?
- What capital expenditures (roof, boiler, parking lot, exteriors) have been made in the last 5 years, and what's planned in the next 2?
- Have any recent inspections been done? Can we get a copy of the seller's disclosures and any deferred-maintenance estimates?
- Built in 1979 — when were the roof, HVAC, electrical panel, plumbing, and water heater last replaced?
- Is there a deadline driving the sale (1031 exchange, divorce, estate, relocation)? That informs how much negotiation room exists.
- Schools are F-rated, which usually means shorter tenancies and higher turnover. Who's the typical renter profile here, and what's been the actual vacancy rate?
- Crime grade is F in this area — have there been break-ins, vandalism, or insurance claims at this property in the last 3 years? What carrier currently insures it and at what premium?
- What's the average days-on-market for RENTAL listings here right now (not sales)? A rising rental-DOM trend means longer vacancies and softer asking-rent achievability than the comps imply.
- What's the recent tenant-quality profile in this submarket — average credit score on applications, eviction rate, late-payment / NSF rate, and stable-employment percentage? A property-management company in the area should have these aggregated.
- How much new apartment / multifamily construction is in the pipeline within 1–3 miles? Heavy new supply (>2% of stock underway) typically softens rents 12–24 months out; light construction supports rent growth.
Investment metrics
- 1% rule
- 1.08% ✓
- Cap rate
- 8.22%
- Cash-on-cash
- 6.87%
- DSCR
- 1.31
- GRM
- 7.7
CMA / ARV
No comps found within radius.
Show comp detail 1 sale within ~0.75 mi
| Address | Dist | Beds/Ba | Sqft | Sold | Price | $/sf | Match |
|---|---|---|---|---|---|---|---|
| 1958 Lakeview Rd | 0.00mi | —/— | — | 1mo | $350,000 | — | 87 |
Match score weights: distance 35% · size 25% · config 20% · recency 20%. Top-matched comps best support the ARV.
Projected returns pro-forma
-3.0% appreciation · 3.8% rent growth · sell at horizon
- IRR
- -4.8%
- Equity multiple
- 0.82×
- Total profit
- $-20,155
- Equity at exit
- $58,896
- IRR
- 5.8%
- Equity multiple
- 1.44×
- Total profit
- $49,051
- Equity at exit
- $34,152
Cash invested: $110,600 (down + closing). Projections, not guarantees.
Landlord ↔ Tenant lean methodology
- Overall (STATE)
- 85 Strongly Landlord-Friendly
- State North Carolina
- 85 Strongly Landlord-Friendly · R+3
- County
- — inherits STATE
- City
- — inherits STATE
ZIP-level market 27203
- Rents YoY
- 3.8%
- Active inventory
- 91
- Price-to-rent
- 30.9×
Monthly cashflow live
- Estimated rent
- $4,257 high interval (Pro) →
- Mortgage (P&I)
- −$2,071
- Tax est. 1.5%
- −$494 /mo · $5,925/yr
- Insurance
- −$165
- HOA
- −$0
- Lot rent
- −$0
- Vacancy / Maint / Mgmt
- −$894
- Net cashflow
- $633
Break-even live
Sensitivity live
| Price | -10% $906 | -5% $770 | +0% $633 | +5% $497 | +10% $360 |
|---|---|---|---|---|---|
| Rent | -10% $297 | -5% $465 | +0% $633 | +5% $801 | +10% $970 |
| Rate | -1.0pp $832 | -0.5pp $734 | base $633 | +0.5pp $531 | +1.0pp $427 |
4-unit breakdown (identical units grouped — click to expand)
| Units | Beds | Baths | Est. rent |
|---|---|---|---|
| 4× units | 2 | 1 | $4,256 |
| #1 | 2 | 1 | $1,064 |
| #2 | 2 | 1 | $1,064 |
| #3 | 2 | 1 | $1,064 |
| #4 | 2 | 1 | $1,064 |
| Total (4 units) | $4,257 | ||
UW: 25.0% down · 7.5% · 30yr · 1.5% tax · 5.0% vac · 8.0% maint · 8.0% mgmt
Financing live
Cash to close
- Down payment
- $98,750
- Closing costs
- $11,850
- Reserves months
- —
- Total cash needed
- —
Loan-product check · same deal, 3 products live
Conventional
25% down · 7.5% · 30yr
- Down + closing
- —
- Monthly P&I
- —
- Monthly cashflow
- —
- DSCR
- —
- Eligible?
- —
Personal DTI + credit; lowest rate.
DSCR
20% down · 8.5% · 30yr
- Down + closing
- —
- Monthly P&I
- —
- Monthly cashflow
- —
- DSCR
- —
- Eligible?
- —
No personal income docs; deal must DSCR.
Hard money
10% down · 12.0% · 12mo
- Down + closing
- —
- Monthly P&I
- —
- Monthly cashflow
- —
- DSCR
- —
- Eligible?
- —
Short-term bridge; refi at stabilization.
Rent comps 19 comps
| Address | Beds | Baths | Sqft | Rent | $/sqft | DOM | Units | Dist |
|---|---|---|---|---|---|---|---|---|
| 605 E Central Ave Asheboro, NC | 2.0 | 1.5 | 940 | $999 | $1.06 | 16d | 2 | 0.07mi |
| 723 Old Liberty Rd Asheboro, NC | 2.0 | 1.5 | 1160 | $999 | $0.86 | 23d | 1 | 0.07mi |
| 611 E Central Ave Asheboro, NC | 2.0 | 1.5 | 720 | $999 | $1.39 | 16d | 1 | 0.10mi |
| 1827 Levance St Asheboro, NC | 3.0 | 1.5 | — | $1,400 | — | 16d | 1 | 0.23mi |
| 404 Poplar St Unit A Asheboro, NC | 2.0 | 1.0 | 800 | $1,095 | $1.37 | 25d | 1 | 0.67mi |
| 1901 N Fayetteville St Asheboro, NC | 1.0–2.0 | 1.0–2.0 | 742 | $1,425 | $1.92 | 16d | 13 | 0.71mi |
| 238 Underwood St Asheboro, NC | 2.0 | 1.0 | 968 | $1,400 | $1.45 | 25d | 1 | 0.82mi |
| 1602 Humble St Unit 201 Asheboro, NC | 2.0 | 1.5 | — | $1,025 | — | 25d | 1 | 0.86mi |
| 1240 Old Liberty Rd Apt 5 Asheboro, NC | 2.0 | 1.0 | — | $1,050 | — | 16d | 1 | 0.88mi |
| 1492 Oriole Dr Asheboro, NC | 3.0 | 2.5 | — | $1,695 | — | 23d | 1 | 0.90mi |
| 1240 Old Liberty Rd Unit 12 Asheboro, NC | 1.0 | 1.0 | — | $800 | — | 16d | 1 | 0.92mi |
| 1818 Saddlewood Ct Unit A Asheboro, NC | 2.0 | 1.5 | — | $1,095 | — | 25d | 1 | 1.01mi |
| 2220 N Fayetteville St Asheboro, NC | 2.0 | 1.0 | 700 | $850 | $1.21 | 23d | 1 | 1.03mi |
| 2201 N Fayetteville St Asheboro, NC | 2.0 | 1.5–2.0 | 1030 | $1,350 | $1.31 | 16d | 6 | 1.06mi |
| 2280 N Fayetteville St Asheboro, NC | 1.0–3.0 | 1.0–2.0 | 1085 | $1,349 | $1.24 | 16d | 5 | 1.18mi |
| 2276 N Fayetteville St Asheboro, NC | 3.0 | 2.0 | 1370 | $1,599 | $1.17 | 16d | 1 | 1.19mi |
| 2275 N Fayetteville St Asheboro, NC | 2.0 | 2.0 | 1040 | $1,299 | $1.25 | 16d | 1 | 1.23mi |
| 2040 Carl Dr Asheboro, NC | 2.0 | 1.0 | — | $875 | — | 16d | 1 | 1.25mi |
| 100 Ashewood Cir Asheboro, NC | 2.0 | 1.0 | 538 | $1,183 | $2.20 | 16d | 6 | 1.27mi |
Listing history 11 events
-
2026-05-11status Pending
-
2026-04-23historical Due Diligence Period
-
2026-04-09$395,000 Active
-
2017-12-12soldstatus $87,500 Sold 128-char remark
Show marketing remark (128 chars)
Investors! this Quadplex or 4 Unit Building 3456 SQ Ft 3 of units already Rented, Priced to Sell! Seller is Real Estate Agent.
-
2017-11-29status Pending 128-char remark
Show marketing remark (128 chars)
Investors! this Quadplex or 4 Unit Building 3456 SQ Ft 3 of units already Rented, Priced to Sell! Seller is Real Estate Agent.
-
2017-11-29status Active 128-char remark
Show marketing remark (128 chars)
Investors! this Quadplex or 4 Unit Building 3456 SQ Ft 3 of units already Rented, Priced to Sell! Seller is Real Estate Agent.
-
2017-11-27historical 128-char remark
Show marketing remark (128 chars)
Investors! this Quadplex or 4 Unit Building 3456 SQ Ft 3 of units already Rented, Priced to Sell! Seller is Real Estate Agent.
-
2017-05-04price $89,900 128-char remark
Show marketing remark (128 chars)
Investors! this Quadplex or 4 Unit Building 3456 SQ Ft 3 of units already Rented, Priced to Sell! Seller is Real Estate Agent.
-
2017-05-04status Active 128-char remark
Show marketing remark (128 chars)
Investors! this Quadplex or 4 Unit Building 3456 SQ Ft 3 of units already Rented, Priced to Sell! Seller is Real Estate Agent.
-
2017-05-02historical 128-char remark
Show marketing remark (128 chars)
Investors! this Quadplex or 4 Unit Building 3456 SQ Ft 3 of units already Rented, Priced to Sell! Seller is Real Estate Agent.
-
2016-09-07$99,900 Active 128-char remark
Show marketing remark (128 chars)
Investors! this Quadplex or 4 Unit Building 3456 SQ Ft 3 of units already Rented, Priced to Sell! Seller is Real Estate Agent.
ⓘ Source: listings_history table (triggers on properties + properties_extension) + one-shot
backfill from property_details.listing_events for pre-trigger history.
Climate risk First Street
- Flood 1/10 Low FEMA zone X (unshaded) · 0% chance over 30 yrs
- Wildfire 3/10 Moderate
- Heat 5/10 Major 7 d/yr ≥103°F today · 17 d/yr by 30 yrs out
- Wind 5/10 Major 23% chance of damaging wind over 30 yrs
- Air quality 2/10 Low 1 unhealthy d/yr today · 1 by 30 yrs out
Nearby sold comps map
Loading sold comps map…
Walkable amenities ~0.75 mi
Loading nearby amenities…
Taxation est. · year 1
- Rental income
- $51,084
- − Mortgage interest
- −$22,126
- − Property taxes
- −$5,925
- − Insurance
- −$1,975
- − Repairs & maintenance
- −$4,087
- − Management
- −$4,087
- − Depreciation
- −$11,491
- Taxable income
- $1,394
- Est. tax owed @ 24.0%
- −$334
- After-tax cash flow
- $7,265/yr
For passive investors: Depreciation is non-cash, so a rental often shows a tax loss while cash-flowing — sheltering income. Rental losses are passive: they offset passive income freely, and up to $25,000/yr can offset ordinary (W-2) income if you actively participate and your MAGI is under $100k (phasing out to $0 by $150k); unused losses carry forward. On sale, claimed depreciation is recaptured at up to 25%, and gains may owe capital-gains tax (a 1031 exchange can defer both). Figures are a year-1 estimate at your 24.0% rate — not tax advice; consult a CPA.
Condition & rehab AI · 13 photos
This 2-bedroom quadplex requires moderate repairs to exterior siding and interior paint, but is otherwise in fair condition. Painting the exterior and interior would significantly increase its resale and rental value.
Repairs flagged
- Moderate exterior siding — Weathered and needs repainting
- Minor interior paint — Slight wear
Value-add opportunities
- Both Paint exterior siding — Enhances curb appeal and value
- Both Paint interior walls — Improves interior appearance and value
Renovation cost estimate screening
| Repair item | Severity | Est. cost |
|---|---|---|
| exterior siding · Weathered and needs repainting | Moderate | $3,000–15,000 |
| interior paint · Slight wear | Minor | $500–3,000 |
| Total estimated repair cost · 2 items | $3,500–18,000 |
Value-add ROI direction
- Both Paint exterior siding — Enhances curb appeal and value ↑
- Both Paint interior walls — Improves interior appearance and value ↑
ⓘ Cost ranges are severity-bucket heuristics (US national rule-of-thumb). Get contractor quotes + a written scope before underwriting a rehab budget.
Schools (NCES district)
- District
- Asheboro City Schools
- NCES district ID
- 3700240
- Math proficiency
- 29% ▼ -7.00%
- Reading proficiency
- 33% ▼ -4.00%
- Median HH income
- $35,167
- Composite
- 25.6/100
- National rank
- #7419
- State rank
- #145 of 178 in NC
Livability — Asheboro
- Score
- 72/100
- State rank
- #85
- US rank
- #5921
Category grades
Schools grade is shown separately in the Schools card above.
Census & demographics
- Census place
- Asheboro, NC
- County
- Randolph County · 81,617 people
- City population
- 60,171
- Metro
- Greensboro-High Point, NC
- Population (ZIP)
- 23,224
- Household income
- $46,336
- Rent vs Own
- Severe rent burden
- 1201.0
Population outlook (Randolph County) Hauer SSP2
- Today (2025)
- 142,640 people
- By 2030
- 140,911 · -1.2%
- By 2040
- 135,692 · -4.9%
- By 2050
- 128,575 · -9.9%
- By 2075
- 111,507 · -21.8%
- By 2100
- 93,376 · -34.5%
Race, ethnicity, and origin ACS 2023
- Neighborhood character
- Diverse neighborhood (Simpson 0.64)
- Race & ethnicity
- White 51% Hispanic / Latino 28% Black 14% Two or more races 7% Asian 1%
- Hispanic origin (detail)
- Mexican 21% Puerto Rican 1%
- Common ancestry
- Lithuanian 1% Slovak 1% Italian 1%
- Foreign-born
- 12% · Canada, Jamaica
- Languages at home
- 71% English-only · Spanish 26% French/Haitian/Cajun 2%
Political lean MEDSL · Randolph
- 2024 margin
- Solid R (+57.2) · D 21.0% · R 78.3%
- 2008→2024 swing
- -15.0pp toward R · 2008: -42.3pp · 2024: -57.2pp
- All cycles
- 2024: R+57.2 2020: R+56.3 2016: R+56.7 2012: R+50.2 2008: R+42.3
Not yet ingested
- Civics
- —
Market trends
- HPI YoY
- ▼ -167.61%
- Current HPI
- 233.8036
- Rent YoY
- ▲ 3.80%
- Metro
- Greensboro-High Point, NC
- State GDP YoY
- ▲ 3.28%
- F500 in state
- 26
Industry mix (Fortune 500 HQ in NC)
| Industry | F500 HQs | Revenue |
|---|---|---|
| Financial Services | 2 | $213B |
|
||
| Retail | 2 | $95B |
|
||
| Industrial Conglomerate | 1 | $38B |
|
||
| Metals / Steel | 1 | $35B |
|
||
| Utilities | 1 | $30B |
|
||
| Industrial Machinery | 1 | $19B |
|
||
Price history
+295.4% since first listed11 events — show timeline
- 2026-05-11 Pending — Triad MLS
- 2026-04-23 Contingent — Triad MLS
- 2026-04-09 Listed $395,000 Triad MLS
- 2017-12-12 Sold (MLS) $87,500 Triad MLS
- 2017-11-29 Pending — Triad MLS
- 2017-11-29 Relisted — Triad MLS
- 2017-11-27 Delisted — Triad MLS
- 2017-05-04 Price Changed $89,900 Triad MLS
- 2017-05-04 Relisted — Triad MLS
- 2017-05-02 Delisted — Triad MLS
- 2016-09-07 Listed $99,900 Triad MLS
Cash-flow waterfall
monthlySold comps — $/sqft
last 12 mo · ≤1 miLoading sold comps…