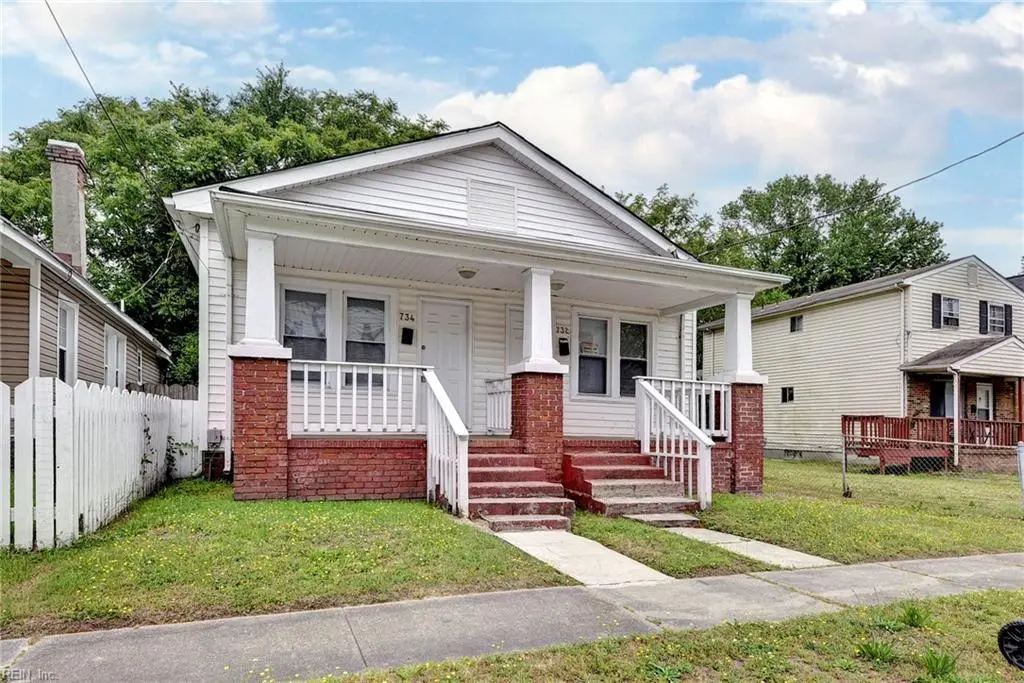
732 17th St · Newport News, VA
Flood risk 1/10 · Minimal
- FEMA flood zone
- X (unshaded)
- Chance of flooding over 30 yrs
- 0.0%
- Est. flood insurance / yr
- $507 – $1,088
Fire risk 1/10 · Minimal
- Est. fire insurance / yr
- $666 – $1,236
Heat risk 9/10 · Severe
- Hot days now (above 107°F)
- 7 days/yr
- Hot days in 30 yrs
- 16 days/yr
Wind risk 8/10 · Major
- Chance of severe wind over 30 yrs
- 80.0%
Air-quality risk 2/10 · Minimal
- Unhealthy air days now
- 1 days/yr
- Unhealthy air days in 30 yrs
- 1 days/yr
Risk factors via First Street. Map © Google.
Why this score? — see what drove the C- grade
The composite is a weighted blend of 9 inputs, each scored 0–100. Each bar is that input's sub-score; the figure is the points it added to the 100-point composite (weight × sub-score).
- Cash flow +17.0/30.0
- ARV discount +7.5/15.0
- DSCR +5.3/10.0
- Appreciation +4.6/10.0
- 1% rule +3.8/10.0
- Schools +3.8/10.0
- Livability +3.8/5.0
- Rent growth +3.2/5.0
- Condition / age +2.5/5.0
$230,000
🖨 Deal sheet 📄 Offer letter ✓ Due diligence
Listing remarks
Investment opportunity! If you are an experienced investor or someone just looking to have rental income to offset your living expenses do not miss this duplex offering two bedrooms, one full bathroom, and full kitchen each. The home features newer HVAC, fresh paint, and refinished flooring throughout.
Key facts
- Fresh paint
- Refinished flooring
- Newer hvac
Tags
Property features AI
Exterior
- Parking: Off-street parking
- Utilities: City/County sewer; Electric water heater; Electric power
- Home design: Attached twinhome; Single-story
- Construction: Crawl foundation; Asphalt shingle roof
- Exterior features: Vinyl siding; Chain-link fence; On ocean waterfront
Interior
- Kitchen: Electric range; Refrigerator
- Bedrooms: Master bedroom; Additional bedroom; Bedroom and full bathroom on first floor
- Flooring: Carpet; Vinyl; Wood
- Bathrooms: 2 full bathrooms
- Heating & cooling: Heat pump heating; Central air; Heat pump cooling
- Interior features: Carpet, vinyl and wood flooring; First-floor master bedroom with full bathroom; Porch
- Laundry & utility: Utility room
Neighborhood map
What this means for you Summary
Snapshot
- This is a 4-bed/2.0-bath townhouse listed at $230k.
Deal economics
- At list price, monthly cash flow is $157 ($2k/yr) — positive.
- The deal already cash-flows at list — no discount required.
- To meet the 1% rule (rent ≥ 1% of price), the offer needs to be $203k (11.7% below list).
- Recommended offer: $203k (11.7% below list) — sets the bar for 1% rule.
- Cap rate 7.1% vs local median 4.2% in Newport News — top-decile yield for the area; either an underpriced asset or a hidden risk that comps aren't pricing in. Stress-test before assuming the spread holds.
Location & tenants
- Location reads 75/100 on livability (#123 in VA, #4,018 nationally) — a middle-class / working-renter tenant base. Strengths: health & safety A+, cost of living A, housing A; Watch: crime F, commute F.
- Newport News City Public School District (urban): math 34% / reading 54% proficiency, ranked #112 of 131 in VA (top 86%) — families likely to look elsewhere, expect single-tenant / working-renter base with shorter leases.
- Zoned schools: Hidenwood Elementary (math 25% / reading 47%, grade F, #958 of 1,108 statewide, top 87%, 522 students, 91% FRL); Warwick High (math 42% / reading 77%, grade C+, #247 of 319 statewide, top 80%, 1,645 students, 86% FRL) — zoned schools average 88% FRL vs 55% district-wide (33 pts higher); higher-poverty schools than district average — tighter screening recommended.
- Market conditions: Rents rising (+2.9%/yr); 128 active listings in the ZIP; 25 comparable units currently listed for rent nearby; rentals lingering (median 44d on market — plan ~5-8 weeks vacancy on turnover, expect pricing pressure); 52% of comp listings sitting > 30 days — soft ceiling on asking rent; lower-income renter base — watch delinquency; 522 units permitted in Newport News city in 2024 (458 in 5+ unit buildings).
- At $2,030/mo this rent would consume 58% of the median local household income ($42k/yr) (locally 2008% of renters already pay >50% of income on rent) — very limited rent-growth headroom before tenants either downsize or default.
Forward outlook
- Local home prices are declining (-0.8%/yr); year-one equity from $2k of loan paydown is wiped out by about $2k of value loss. Plan a longer hold.
- Newport News County population projected to shrink 8% by 2050 — rents likely to lag national; underwrite the cash flow, not the appreciation.
Negotiation context
- It's been on market 48 days — a 3% lower offer ($223k) is reasonable based on typical stale-listing flexibility.
- 4 sale attempts since 3y ago with the ask held roughly flat each time — persistent listings suggest the price (not the market) is what's stuck; bring a comps-based counter.
- Current owner paid $9k; list at $230k implies a 2456% gain — meaningful room to come down on a strong offer.
Risks & watch-outs
- Watch-outs: built in 1930 — expect roof / HVAC / electrical / plumbing capex.
- Climate carrying-cost: severe wind risk, 80% chance of damaging wind over 30y; extreme-heat days projected 7→16/yr by 2055 (HVAC capex compounding) — expect insurance premiums to compound above CPI over the hold.
Questions for the listing agent
- It's been on market 48 days. Have you received any prior offers? Is the seller open to a 12% concession, seller financing, or rate buy-down credit?
- Built in 1930 — when were the roof, HVAC, electrical panel, plumbing, and water heater last replaced?
- Is there a deadline driving the sale (1031 exchange, divorce, estate, relocation)? That informs how much negotiation room exists.
- Schools are B-rated — typically a magnet for longer-tenancy family renters. What's the average tenant stay here, and is there a school-zone premium baked into asking?
- Crime grade is F in this area — have there been break-ins, vandalism, or insurance claims at this property in the last 3 years? What carrier currently insures it and at what premium?
- What's the average days-on-market for RENTAL listings here right now (not sales)? A rising rental-DOM trend means longer vacancies and softer asking-rent achievability than the comps imply.
- What's the recent tenant-quality profile in this submarket — average credit score on applications, eviction rate, late-payment / NSF rate, and stable-employment percentage? A property-management company in the area should have these aggregated.
- How much new for-sale + rental construction is in the pipeline within 1–3 miles? Heavy new supply typically softens prices + rents 12–24 months out; constrained supply supports both.
Investment metrics
- 1% rule
- 0.88% ✗
- Cap rate
- 7.11%
- Cash-on-cash
- 2.92%
- DSCR
- 1.13
- GRM
- 9.4
CMA / ARV
No comps found within radius.
Projected returns pro-forma
-0.84% appreciation · 2.91% rent growth · sell at horizon
- IRR
- -2.1%
- Equity multiple
- 0.91×
- Total profit
- $-5,907
- Equity at exit
- $57,286
- IRR
- 4.4%
- Equity multiple
- 1.42×
- Total profit
- $27,197
- Equity at exit
- $61,673
Cash invested: $64,400 (down + closing). Projections, not guarantees.
Landlord ↔ Tenant lean methodology
- Overall (STATE)
- 55 Moderately Landlord-Leaning
- State Virginia
- 55 Moderately Landlord-Leaning · D+2
- County
- — inherits STATE
- City
- — inherits STATE
ZIP-level market 23607
- Home prices YoY
- -0.3%
- Rents YoY
- 2.9%
- Active inventory
- 128
- Price-to-rent
- 9.4×
Monthly cashflow live
- Estimated rent
- $2,030 high interval (Pro) →
- Mortgage (P&I)
- −$1,206
- Tax from tax record
- −$145 /mo · $1,737/yr
- Insurance
- −$96
- HOA
- −$0
- Vacancy / Maint / Mgmt
- −$426
- Net cashflow
- $157
Break-even live
UW: 25.0% down · 7.5% · 30yr · 1.5% tax · 5.0% vac · 8.0% maint · 8.0% mgmt
Financing live
Cash to close
- Down payment
- $57,500
- Closing costs
- $6,900
- Reserves months
- —
- Total cash needed
- —
Loan-product check · same deal, 3 products live
Conventional
25% down · 7.5% · 30yr
- Down + closing
- —
- Monthly P&I
- —
- Monthly cashflow
- —
- DSCR
- —
- Eligible?
- —
Personal DTI + credit; lowest rate.
DSCR
20% down · 8.5% · 30yr
- Down + closing
- —
- Monthly P&I
- —
- Monthly cashflow
- —
- DSCR
- —
- Eligible?
- —
No personal income docs; deal must DSCR.
Hard money
10% down · 12.0% · 12mo
- Down + closing
- —
- Monthly P&I
- —
- Monthly cashflow
- —
- DSCR
- —
- Eligible?
- —
Short-term bridge; refi at stabilization.
Rent comps 25 comps
| Address | Beds | Baths | Sqft | Rent | $/sqft | DOM | Units | Dist |
|---|---|---|---|---|---|---|---|---|
| 740 21st St Newport News, VA | 3.0 | 2.0 | 1120 | $2,000 | $1.79 | 43d | 1 | 0.21mi |
| 2102 Marshall Ave Newport News, VA | 4.0 | 2.0 | 1780 | $1,500 | $0.84 | 43d | 1 | 0.25mi |
| 2104 Marshall Ave Newport News, VA | 4.0 | 2.0 | 1568 | $2,200 | $1.40 | 16d | 1 | 0.25mi |
| 829 22nd St Newport News, VA | 3.0 | 1.5 | 1020 | $1,650 | $1.62 | 43d | 1 | 0.37mi |
| 1152 Orcutt Ave Newport News, VA | 3.0 | 1.0 | 947 | $1,375 | $1.45 | 3d | 1 | 0.45mi |
| 1020 23rd St Newport News, VA | 4.0 | 3.0 | 1710 | $2,195 | $1.28 | 43d | 1 | 0.53mi |
| 1110 21st St Newport News, VA | 4.0 | 2.0 | 1613 | $1,850 | $1.15 | 43d | 1 | 0.55mi |
| 1035 23rd St Newport News, VA | 3.0 | 2.0 | 1378 | $1,600 | $1.16 | 43d | 1 | 0.57mi |
| 1034 26th St Newport News, VA | 4.0 | 2.0 | 1579 | $1,600 | $1.01 | 43d | 1 | 0.66mi |
| 1044 26th St Newport News, VA | 5.0 | 2.0 | 1500 | $2,450 | $1.63 | 3d | 1 | 0.67mi |
| 1216 21st St Newport News, VA | 3.0 | 3.5 | 1446 | $1,700 | $1.18 | 23d | 1 | 0.72mi |
| 749 31st St Newport News, VA | 3.0 | 2.0 | 1000 | $1,900 | $1.90 | 43d | 1 | 0.78mi |
| 3206 Madison Ave Newport News, VA | 3.0 | 1.0 | 900 | $1,550 | $1.72 | 10d | 1 | 0.85mi |
| 1239 24th St Newport News, VA | 3.0 | 1.0 | 880 | $1,495 | $1.70 | 43d | 1 | 0.87mi |
| 1242 26th St Newport News, VA | 3.0 | 4.0 | 1704 | $2,400 | $1.41 | 2d | 1 | 0.91mi |
| 1222 29th St Newport News, VA | 5.0 | 3.0 | 1563 | $2,950 | $1.89 | 1d | 1 | 0.96mi |
| 1124 33rd St Newport News, VA | 3.0 | 1.5 | 1386 | $1,600 | $1.15 | 23d | 1 | 1.01mi |
| 1227 31st St Newport News, VA | 3.0 | 2.0 | 1500 | $2,495 | $1.66 | 1d | 1 | 1.06mi |
| 1332 29th St Newport News, VA | 5.0 | 2.0 | 1553 | $2,500 | $1.61 | 43d | 1 | 1.10mi |
| 1032 37th St Newport News, VA | 3.0 | 2.0 | 1191 | $1,450 | $1.22 | 43d | 1 | 1.13mi |
| 35 Cedar Ave Newport News, VA | 3.0 | 1.5 | 1138 | $1,595 | $1.40 | 43d | 1 | 1.22mi |
| 80 30th St Newport News, VA | 1.0–3.0 | 1.0–3.0 | 923 | $2,599 | $2.82 | 1d | 4 | 1.25mi |
| 40 Buxton Ave Unit C Newport News, VA | 3.0 | 1.0 | 1750 | $1,795 | $1.03 | 43d | 1 | 1.30mi |
| 233 Pine Ave Newport News, VA | 3.0 | 2.0 | 1213 | $2,100 | $1.73 | 23d | 1 | 1.45mi |
| 321 Pine Ave Newport News, VA | 3.0 | 2.5 | 1349 | $1,990 | $1.48 | 23d | 1 | 1.46mi |
Listing history 20 events
-
2026-06-18days on market $230,000 Active 48 DOM
-
2026-06-17days on market $230,000 Active 47 DOM
-
2026-06-16days on market $230,000 Active 46 DOM
-
2026-06-15days on market $230,000 Active 45 DOM
-
2026-06-09days on market $230,000 Active 39 DOM
-
2026-06-08days on market $230,000 Active 38 DOM
-
2026-06-07days on market $230,000 Active 37 DOM
-
2026-06-03days on market $230,000 Active 33 DOM
-
2026-06-02days on market $230,000 Active 32 DOM
-
2026-06-01days on market $230,000 Active 31 DOM
-
2026-05-31days on market $230,000 Active 30 DOM
-
2026-05-01$230,000 Active 303-char remark
-
2024-02-29historical $895
-
2024-02-27$895
-
2024-02-01historical $995
-
2024-01-30$995
-
2023-10-30historical $1,200
-
2023-10-28$1,200
-
2013-03-05soldstatus $9,000
-
1976-09-01soldstatus $38,341
ⓘ Source: listings_history table (triggers on properties + properties_extension) + one-shot
backfill from property_details.listing_events for pre-trigger history.
Tax reassessment forecast VA · Resets to sale price
- Current annual tax
- $1,737 · $145/mo
- Projected year-2 tax
- $1,886 · $157/mo
- Expected delta
- +$149/yr (+$12/mo · 8.6%)
ⓘ Screening estimate from a state-policy table — verify with the county assessor before closing.
Climate risk First Street
- Flood 1/10 Low FEMA zone X (unshaded) · 0% chance over 30 yrs
- Wildfire 1/10 Low
- Heat 9/10 Extreme 7 d/yr ≥107°F today · 16 d/yr by 30 yrs out
- Wind 8/10 Severe 80% chance of damaging wind over 30 yrs
- Air quality 2/10 Low 1 unhealthy d/yr today · 1 by 30 yrs out
Nearby sold comps map
Loading sold comps map…
Walkable amenities ~0.75 mi
Loading nearby amenities…
Taxation est. · year 1
- Rental income
- $24,359
- − Mortgage interest
- −$12,884
- − Property taxes
- −$1,737
- − Insurance
- −$1,150
- − Repairs & maintenance
- −$1,949
- − Management
- −$1,949
- − Depreciation
- −$6,691
- Taxable loss
- −$2,000
- Est. tax savings @ 24.0%
- +$480
- After-tax cash flow
- $2,363/yr
For passive investors: Depreciation is non-cash, so a rental often shows a tax loss while cash-flowing — sheltering income. Rental losses are passive: they offset passive income freely, and up to $25,000/yr can offset ordinary (W-2) income if you actively participate and your MAGI is under $100k (phasing out to $0 by $150k); unused losses carry forward. On sale, claimed depreciation is recaptured at up to 25%, and gains may owe capital-gains tax (a 1031 exchange can defer both). Figures are a year-1 estimate at your 24.0% rate — not tax advice; consult a CPA.
Schools (NCES district)
- District
- Newport News City Public School District
- NCES district ID
- 5102640
- Math proficiency
- 34% ▼ -37.00%
- Reading proficiency
- 54% ▼ -10.00%
- Median HH income
- $49,644
- Composite
- 37.7/100
- National rank
- #4360
- State rank
- #112 of 131 in VA
Livability — Newport News
- Score
- 75/100
- State rank
- #123
- US rank
- #4018
Category grades
Schools grade is shown separately in the Schools card above.
Census & demographics
- Census place
- Newport News, VA
- County
- Newport News City · 178,950 people
- City population
- 178,950
- Metro
- Virginia Beach-Norfolk-Newport News, VA-NC
- Population (ZIP)
- 23,096
- Household income
- $42,334
- Rent vs Own
- Severe rent burden
- 2008.0
Population outlook (Newport News County) Hauer SSP2
- Today (2025)
- 181,076 people
- By 2030
- 179,683 · -0.8%
- By 2040
- 174,649 · -3.5%
- By 2050
- 167,407 · -7.5%
- By 2075
- 147,597 · -18.5%
- By 2100
- 122,144 · -32.5%
Race, ethnicity, and origin ACS 2023
- Neighborhood character
- Predominantly Black (75%)
- Race & ethnicity
- Black 75% White 13% Two or more races 7% Hispanic / Latino 6% Asian 1%
- Hispanic origin (detail)
- Mexican 1% Puerto Rican 2%
- Foreign-born
- 3% · Canada
- Languages at home
- 96% English-only · Spanish 3%
Political lean MEDSL · Newport News
- 2024 margin
- Strong D (+28.8) · D 63.7% · R 34.9% · Other 1.4%
- 2008→2024 swing
- +0.1pp no change · 2008: 28.7pp · 2024: 28.8pp
- All cycles
- 2024: D+28.8 2020: D+32.9 2016: D+25.4 2012: D+30.0 2008: D+28.7
Not yet ingested
- Civics
- —
Market trends
- HPI YoY
- ▼ -0.84%
- Current HPI
- 312.4039
- Rent YoY
- ▲ 2.91%
- Metro
- Virginia Beach-Norfolk-Newport News, VA-NC
- State GDP YoY
- ▲ 2.40%
- F500 in state
- 50
Industry mix (Fortune 500 HQ in VA)
| Industry | F500 HQs | Revenue |
|---|---|---|
| Aerospace / Defense | 4 | $236B |
|
||
| Technology / Defense | 3 | $32B |
|
||
| Financial Services | 2 | $176B |
|
||
| Utilities | 2 | $27B |
|
||
| Insurance | 2 | $25B |
|
||
| Technology | 2 | $15B |
|
||
Price history
+499.9% since first listed9 events — show timeline
- 2026-05-01 Listed $230,000 REINMLS
- 2024-02-29 Rental Removed $895 REINMLS
- 2024-02-27 Listed for Rent $895 REINMLS
- 2024-02-01 Rental Removed $995 REINMLS
- 2024-01-30 Listed for Rent $995 REINMLS
- 2023-10-30 Rental Removed $1,200 APPFOLIO
- 2023-10-28 Listed for Rent $1,200 APPFOLIO
- 2013-03-05 Sold (Public Records) $9,000 Public Records
- 1976-09-01 Sold (Public Records) $38,341 Public Records
Property tax history
+5.3%/yrLatest (2026): $1,737 · +32.4% YoY. Source: county tax records.
Cash-flow waterfall
monthlySold comps — $/sqft
last 12 mo · ≤1 miLoading sold comps…