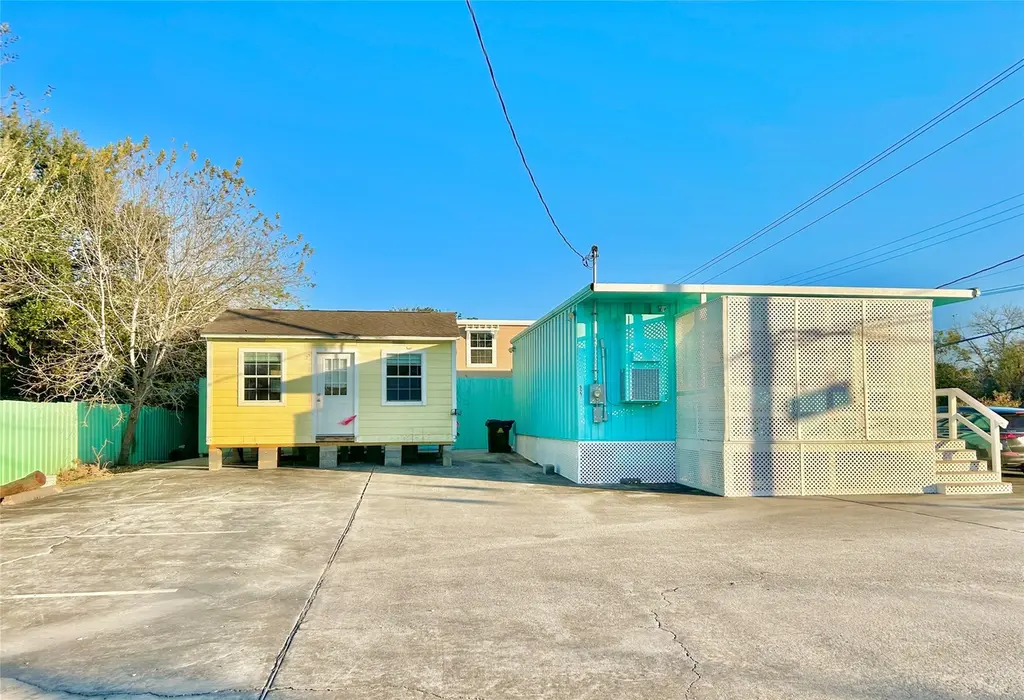
927 27th St · San Leon, TX
Flood risk No data
- FEMA flood zone
- —
- Chance of flooding over 30 yrs
- —
- Est. flood insurance / yr
- —
Fire risk No data
- Est. fire insurance / yr
- —
Heat risk No data
- Hot days now (above threshold)
- —
- Hot days in 30 yrs
- —
Wind risk No data
- Chance of severe wind over 30 yrs
- —
Air-quality risk No data
- Unhealthy air days now
- —
- Unhealthy air days in 30 yrs
- —
Risk factors via First Street. Map © Google.
Why this score? — see what drove the D- grade
The composite is a weighted blend of 9 inputs, each scored 0–100. Each bar is that input's sub-score; the figure is the points it added to the 100-point composite (weight × sub-score).
- ARV discount +15.0/15.0
- Cash flow +8.1/30.0
- Schools +3.5/10.0
- Livability +3.1/5.0
- 1% rule +2.5/10.0
- Rent growth +2.5/5.0
- Condition / age +2.5/5.0
- DSCR +2.1/10.0
- Appreciation +0.0/10.0
$178,500
🖨 Deal sheet 📄 Offer letter ✓ Due diligence
Listing remarks MLS
Coastal Cottages near Galveston Bay with easy access to Texas City, La Porte, League City and Dickinson- Galveston 30 Minutes and Houston 45 minutes from Property. Great Investment property without restrictions- Rental, office, Business location, or residence with additional rental for extra income! The Lot is highly elevated and fully concreted with parking spaces. Unit One is newly updated and fully operational, ready for move in! Bright and refreshing, Large open living room and Kitchen with custom cabinetry, Private Patio, Spacious Bedroom and Full Bathroom. Windstorm engineered and insurable. Unit Two is a One bedroom, full bathroom, Kitchen space, plenty of space for private patio. This unit can be set up and operating quickly, and is easily movable if looking for additional parking for a business from Unit One.
Key facts
- Custom cabinetry
- Windstorm engineered
- Newly updated unit
Tags
Neighborhood map
What this means for you Summary
Snapshot
- This is a 1-bed/1.0-bath single-family listed at $178k.
Deal economics
- At list price, monthly cash flow is $-177 ($-2k/yr) — negative.
- To cash-flow at today's rent, offer at most $153k (14.4% below list).
- To meet the 1% rule (rent ≥ 1% of price), the offer needs to be $134k (25.1% below list).
- Recommended offer: $134k (25.1% below list) — sets the bar for 1% rule.
- Cap rate 5.1% vs local median 1.8% in San Leon — top-decile yield for the area; either an underpriced asset or a hidden risk that comps aren't pricing in. Stress-test before assuming the spread holds.
Location & tenants
- Location reads 62/100 on livability (#899 in TX) — a middle-class / working-renter tenant base. Strengths: cost of living A+, housing A+, employment B+; Watch: schools F, amenities F, commute F.
- Dickinson ISD (suburban): math 39% / reading 40% proficiency, ranked #366 of 826 in TX (top 44%) — families likely to look elsewhere, expect single-tenant / working-renter base with shorter leases; 60% free/reduced lunch — lower-income household profile, screen leases tightly.
- Market conditions: Rents soft (-0.1%/yr); 664 active listings in the ZIP; solid renter incomes; 3,258 units permitted in Galveston County in 2024 (0 in 5+ unit buildings).
Forward outlook
- Local home prices are declining (-3.0%/yr); year-one equity from $1k of loan paydown is wiped out by about $5k of value loss. Plan a longer hold.
- Galveston County population projected at +43% by 2050 — long-run rental-demand tailwind backs the buy-and-hold thesis.
Negotiation context
- It's been on market 91 days — a 9% lower offer ($162k) is reasonable based on typical stale-listing flexibility.
- 5 sale attempts since 2y ago; this cycle's ask is 11056% above the opening price — seller raised mid-cycle; expect resistance to lowballs.
Questions for the listing agent
- What do current leases actually rent for vs. the listed asking? Can we see a recent rent roll and the last 12 months of T-12 income?
- It's been on market 91 days. Have you received any prior offers? Is the seller open to a 25% concession, seller financing, or rate buy-down credit?
- Why hasn't it sold? Are there any deal-killer items the seller is aware of (foundation, flood, title, zoning, code violations)?
- Is there a deadline driving the sale (1031 exchange, divorce, estate, relocation)? That informs how much negotiation room exists.
- Schools are F-rated, which usually means shorter tenancies and higher turnover. Who's the typical renter profile here, and what's been the actual vacancy rate?
- The area grade is low — what's the realistic commute time and amenity access for the typical tenant pool here? Any planned neighborhood developments (good or bad) we should know about?
- What's the average days-on-market for RENTAL listings here right now (not sales)? A rising rental-DOM trend means longer vacancies and softer asking-rent achievability than the comps imply.
- What's the recent tenant-quality profile in this submarket — average credit score on applications, eviction rate, late-payment / NSF rate, and stable-employment percentage? A property-management company in the area should have these aggregated.
- How much new for-sale + rental construction is in the pipeline within 1–3 miles? Heavy new supply typically softens prices + rents 12–24 months out; constrained supply supports both.
Investment metrics
- 1% rule
- 0.75% ✗
- Cap rate
- 5.10%
- Cash-on-cash
- -4.26%
- DSCR
- 0.81
- GRM
- 11.1
CMA / ARV
- ARV (median comp)
- $246,671
- List price
- $178,500
- Delta
- -27.64%
- Verdict
- UNDERPRICED
- Comps
- 2 within 2.0 mi
Show comp detail 2 sales within ~0.75 mi
| Address | Dist | Beds/Ba | Sqft | Sold | Price | $/sf | Match |
|---|---|---|---|---|---|---|---|
| 2786 Avenue H | 0.38mi | 2/1.0 (+1) | 1,170 (+6%) | 23mo | $90,000 | $77 | 48 |
| 502 Jenni Ln | 0.60mi | 2/2.0 (+1) | 1,000 (-9%) | 6mo | $239,500 | $240 | 43 |
Match score weights: distance 35% · size 25% · config 20% · recency 20%. Top-matched comps best support the ARV.
Projected returns pro-forma
-3.0% appreciation · 0.0% rent growth · sell at horizon
- IRR
- -26.9%
- Equity multiple
- 0.12×
- Total profit
- $-44,114
- Equity at exit
- $26,615
- IRR
- -39.5%
- Equity multiple
- -0.36×
- Total profit
- $-68,015
- Equity at exit
- $15,433
Cash invested: $49,980 (down + closing). Projections, not guarantees.
Landlord ↔ Tenant lean methodology
- Overall (STATE)
- 87 Strongly Landlord-Friendly
- State Texas
- 87 Strongly Landlord-Friendly · R+5
- County
- — inherits STATE
- City
- — inherits STATE
ZIP-level market 77539
- Home prices YoY
- -29.8%
- Rents YoY
- -0.1%
- Active inventory
- 664
- Price-to-rent
- 11.1×
Monthly cashflow live
- Estimated rent
- $1,337 medium interval (Pro) →
- Mortgage (P&I)
- −$936
- Tax est. 1.5%
- −$223 /mo · $2,678/yr
- Insurance
- −$74
- HOA
- −$0
- Vacancy / Maint / Mgmt
- −$281
- Net cashflow
- $-177
Break-even live
UW: 25.0% down · 7.5% · 30yr · 1.5% tax · 5.0% vac · 8.0% maint · 8.0% mgmt
Financing live
Cash to close
- Down payment
- $44,625
- Closing costs
- $5,355
- Reserves months
- —
- Total cash needed
- —
Loan-product check · same deal, 3 products live
Conventional
25% down · 7.5% · 30yr
- Down + closing
- —
- Monthly P&I
- —
- Monthly cashflow
- —
- DSCR
- —
- Eligible?
- —
Personal DTI + credit; lowest rate.
DSCR
20% down · 8.5% · 30yr
- Down + closing
- —
- Monthly P&I
- —
- Monthly cashflow
- —
- DSCR
- —
- Eligible?
- —
No personal income docs; deal must DSCR.
Hard money
10% down · 12.0% · 12mo
- Down + closing
- —
- Monthly P&I
- —
- Monthly cashflow
- —
- DSCR
- —
- Eligible?
- —
Short-term bridge; refi at stabilization.
Listing history 24 events
-
2026-06-18days on market $178,500 Active 91 DOM
-
2026-06-17days on market $178,500 Active 90 DOM
-
2026-06-16days on market $178,500 Active 89 DOM
-
2026-06-15days on market $178,500 Active 88 DOM
-
2026-06-13days on market $178,500 Active 86 DOM
-
2026-06-09days on market $178,500 Active 82 DOM
-
2026-06-08days on market $178,500 Active 81 DOM
-
2026-06-07days on market $178,500 Active 80 DOM
-
2026-06-04days on market $178,500 Active 77 DOM
-
2026-06-03days on market $178,500 Active 76 DOM
-
2026-06-02days on market $178,500 Active 75 DOM
-
2026-06-01days on market $178,500 Active 74 DOM
-
2026-05-31days on market $178,500 Active 73 DOM
-
2026-03-20$1,600
-
2026-03-19$180,000 Active 833-char remark
Show marketing remark (833 chars)
Coastal Cottages near Galveston Bay with easy access to Texas City, La Porte, League City and Dickinson- Galveston 30 Minutes and Houston 45 minutes from Property. Great Investment property without restrictions- Rental, office, Business location, or residence with additional rental for extra income! The Lot is highly elevated and fully concreted with parking spaces. Unit One is newly updated and fully operational, ready for move in! Bright and refreshing, Large open living room and Kitchen with custom cabinetry, Private Patio, Spacious Bedroom and Full Bathroom. Windstorm engineered and insurable. Unit Two is a One bedroom, full bathroom, Kitchen space, plenty of space for private patio. This unit can be set up and operating quickly, and is easily movable if looking for additional parking for a business from Unit One.
-
2025-12-09historical
-
2025-12-08price $205,000
-
2025-07-18$178,000 Active
-
2025-06-30historical
-
2025-05-21price $178,000
-
2025-03-19$195,000 Active
-
2025-01-31historical
-
2024-11-20price $215,000
-
2024-10-28$225,000 Active
ⓘ Source: listings_history table (triggers on properties + properties_extension) + one-shot
backfill from property_details.listing_events for pre-trigger history.
Nearby sold comps map
Loading sold comps map…
Walkable amenities ~0.75 mi
Loading nearby amenities…
Taxation est. · year 1
- Rental income
- $16,045
- − Mortgage interest
- −$9,999
- − Property taxes
- −$2,678
- − Insurance
- −$892
- − Repairs & maintenance
- −$1,284
- − Management
- −$1,284
- − Depreciation
- −$5,193
- Taxable loss
- −$5,284
- Est. tax savings @ 24.0%
- +$1,268
- After-tax cash flow
- $-859/yr
For passive investors: Depreciation is non-cash, so a rental often shows a tax loss while cash-flowing — sheltering income. Rental losses are passive: they offset passive income freely, and up to $25,000/yr can offset ordinary (W-2) income if you actively participate and your MAGI is under $100k (phasing out to $0 by $150k); unused losses carry forward. On sale, claimed depreciation is recaptured at up to 25%, and gains may owe capital-gains tax (a 1031 exchange can defer both). Figures are a year-1 estimate at your 24.0% rate — not tax advice; consult a CPA.
Schools (NCES district)
- District
- Dickinson ISD
- NCES district ID
- 4817070
- Math proficiency
- 39% ▼ -11.00%
- Reading proficiency
- 40% ▼ -2.00%
- Median HH income
- $61,318
- Composite
- 35.16/100
- National rank
- #5005
- State rank
- #366 of 826 in TX
Livability — San Leon
- Score
- 62/100
- State rank
- #899
- US rank
- #16159
Category grades
Schools grade is shown separately in the Schools card above.
Census & demographics
- Census place
- San Leon, TX
- County
- Galveston County · 357,330 people
- Metro
- Houston-The Woodlands-Sugar Land, TX
- Population (ZIP)
- 49,375
- Household income
- $89,111
- Rent vs Own
- Severe rent burden
- 869.0
Population outlook (Galveston County) Hauer SSP2
- Today (2025)
- 390,640 people
- By 2030
- 425,226 · +8.9%
- By 2040
- 493,765 · +26.4%
- By 2050
- 559,698 · +43.3%
- By 2075
- 719,260 · +84.1%
- By 2100
- 819,628 · +109.8%
Race, ethnicity, and origin ACS 2023
- Neighborhood character
- Diverse neighborhood (Simpson 0.64)
- Race & ethnicity
- White 47% Hispanic / Latino 37% Two or more races 19% Black 10% Asian 3%
- Hispanic origin (detail)
- Mexican 29% Puerto Rican 2%
- Common ancestry
- Italian 3% Romanian 2% Lithuanian 1%
- Foreign-born
- 13% · Canada, Vietnam
- Languages at home
- 73% English-only · Spanish 24% Vietnamese 1% Other Indo-European 1%
Political lean MEDSL · Galveston
- 2024 margin
- Strong R (+27.4) · D 35.7% · R 63.1% · Other 1.2%
- 2008→2024 swing
- -7.9pp toward R · 2008: -19.5pp · 2024: -27.4pp
- All cycles
- 2024: R+27.4 2020: R+22.6 2016: R+22.6 2012: R+26.9 2008: R+19.5
Not yet ingested
- Civics
- —
Market trends
- HPI YoY
- ▼ -109.46%
- Current HPI
- 258.0104
- Rent YoY
- ▼ -0.12%
- Metro
- Houston-The Woodlands-Sugar Land, TX
- State GDP YoY
- ▲ 3.95%
- F500 in state
- 110
Industry mix (Fortune 500 HQ in TX)
| Industry | F500 HQs | Revenue |
|---|---|---|
| Energy | 16 | $1,198B |
|
||
| Technology | 5 | $198B |
|
||
| Engineering / Construction | 4 | $72B |
|
||
| Energy Services | 3 | $60B |
|
||
| Utilities | 3 | $41B |
|
||
| Healthcare | 2 | $330B |
|
||
Price history
-99.3% since first listed11 events — show timeline
- 2026-03-20 Listed for Rent $1,600 HARMLS
- 2026-03-19 Listed $180,000 HARMLS
- 2025-12-09 Listing Removed — HARMLS
- 2025-12-08 Price Changed $205,000 HARMLS
- 2025-07-18 Listed $178,000 HARMLS
- 2025-06-30 Listing Removed — HARMLS
- 2025-05-21 Price Changed $178,000 HARMLS
- 2025-03-19 Listed $195,000 HARMLS
- 2025-01-31 Listing Removed — HARMLS
- 2024-11-20 Price Changed $215,000 HARMLS
- 2024-10-28 Listed $225,000 HARMLS
Cash-flow waterfall
monthlySold comps — $/sqft
last 12 mo · ≤1 miLoading sold comps…