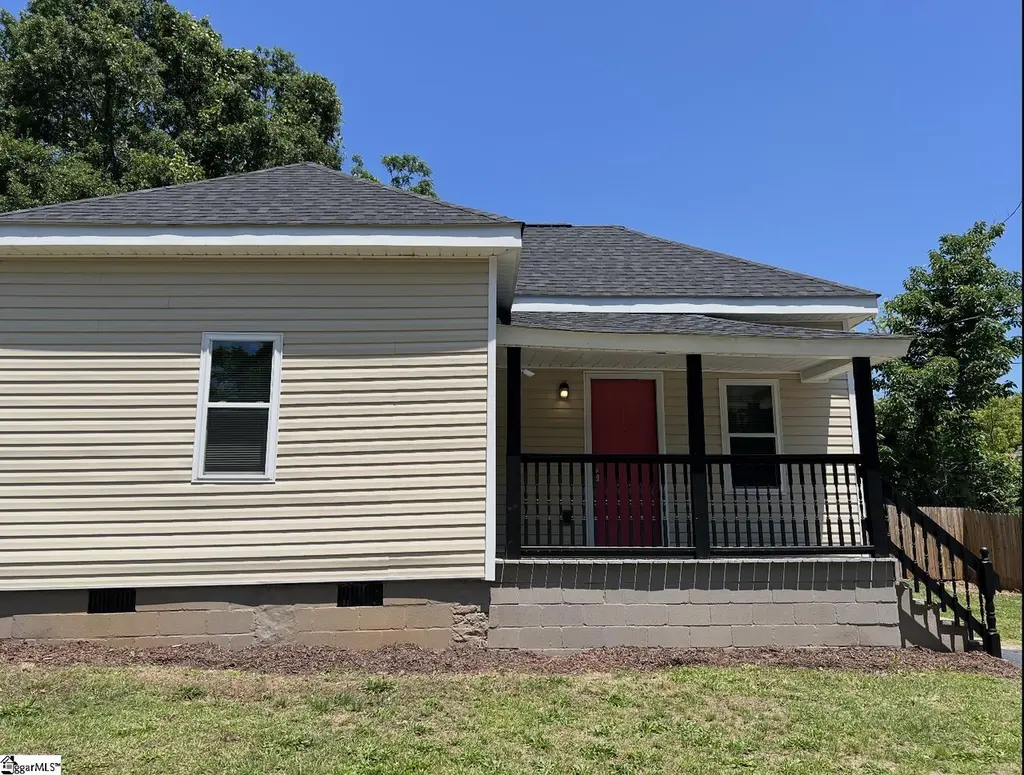
117 Dewey Ave · Laurens, SC
Flood risk 1/10 · Minimal
- FEMA flood zone
- X (unshaded)
- Chance of flooding over 30 yrs
- 0.0%
- Est. flood insurance / yr
- $507 – $1,088
Fire risk 2/10 · Minimal
- Est. fire insurance / yr
- $783 – $1,453
Heat risk 6/10 · Moderate
- Hot days now (above 106°F)
- 7 days/yr
- Hot days in 30 yrs
- 16 days/yr
Wind risk 4/10 · Minor
- Chance of severe wind over 30 yrs
- 8.0%
Air-quality risk 3/10 · Minor
- Unhealthy air days now
- 3 days/yr
- Unhealthy air days in 30 yrs
- 3 days/yr
Risk factors via First Street. Map © Google.
Why this score? — see what drove the C+ grade
The composite is a weighted blend of 9 inputs, each scored 0–100. Each bar is that input's sub-score; the figure is the points it added to the 100-point composite (weight × sub-score).
- Cash flow +27.1/30.0
- DSCR +9.4/10.0
- ARV discount +7.5/15.0
- 1% rule +6.2/10.0
- Livability +3.4/5.0
- Rent growth +2.5/5.0
- Condition / age +2.5/5.0
- Schools +2.1/10.0
- Appreciation +0.0/10.0
$109,900
🖨 Deal sheet 📄 Offer letter ✓ Due diligence
Listing remarks
Welcome to 117 Dewey Ave, a charming 2-bedroom, 1-bath home that perfectly blends cozy living with modern peace of mind. Nestled on a level lot with a partial privacy fence, this home is an ideal find for first-time buyers, downsizers, or savvy investors looking for a turnkey property. Step inside from the inviting entry porch to discover brand-new carpeting throughout the living area and bedrooms. Major updates have already been handled for you! The home features recently updated mechanicals including new water and sewer lines from the road to the house along with updated electrical and plumbing, ensuring efficiency and reliability for years to come. With its 2BR/1BA footprint, this home i
Key facts
- Brand new carpeting
- 5,662 sq ft lot
- Garage
Tags
Property features AI
Finance
- Other: Lead-based paint and residential property disclosures required
- HOA & community: No HOA fees or community amenities
Exterior
- Parking: Driveway with gravel surface; Attached garage
- Utilities: Public water; Electric water heater; Public sewer; Public garbage pickup; Electric and natural gas available
- Home design: Single-story residential property; Approximately 50+ years old; Crawl space foundation; Lot is level and measures approximately 78 x 74 x 77 x 74 (1/2 acre or less)
- Construction: Vinyl siding exterior; Architectural shingle roof; Crawl space foundation; Built more than 50 years ago
- Exterior features: Front porch; Tilt-out windows; Vinyl/aluminum trim; Vinyl siding; Architectural roof
Interior
- Kitchen: Kitchen approximately 14 x 5; Stand-alone gas range; Refrigerator
- Bedrooms: Primary bedroom on main level, approximately 14 x 12; Second bedroom on main level, approximately 8 x 14
- Flooring: Carpet; Vinyl
- Bathrooms: One full bathroom on the main level
- Heating & cooling: Baseboard heating (electric and natural gas); Wall/window air conditioning units
- Interior features: 9-foot (or higher) smooth ceilings; Smoke detector
- Laundry & utility: First-floor laundry with washer connection and electric dryer hookup
Neighborhood map
What this means for you Summary
Snapshot
- This is a 2-bed/1.0-bath other listed at $110k.
Deal economics
- At list price, monthly cash flow is $311 ($4k/yr) — positive.
- The deal already cash-flows at list — no discount required.
- Meets the 1% rule at list price ($1k rent vs $110k).
- Recommended offer: $107k (3.0% below list) — sets the bar for market timing.
- Cap rate 9.7% vs local median 3.5% in Laurens — top-decile yield for the area; either an underpriced asset or a hidden risk that comps aren't pricing in. Stress-test before assuming the spread holds.
Location & tenants
- Location reads 68/100 on livability (#79 in SC) — a middle-class / working-renter tenant base. Strengths: cost of living A+, housing A+, health & safety A+; Watch: amenities D+, employment D, schools F.
- Laurens 55 (rural): math 20% / reading 29% proficiency, ranked #63 of 80 in SC (top 79%) — low school quality limits family demand, transient renter base, plan for 1-2y turnover; 62% free/reduced lunch — lower-income household profile, screen leases tightly.
- Market conditions: 153 active listings in the ZIP; 621 units permitted in Laurens County in 2024 (0 in 5+ unit buildings).
Forward outlook
- Local home prices are declining (-3.0%/yr); year-one equity from $760 of loan paydown is wiped out by about $3k of value loss. Plan a longer hold.
- Laurens County population projected to shrink 7% by 2050 — rents likely to lag national; underwrite the cash flow, not the appreciation.
- At projected returns (-3.0% appreciation + 3.0% rent growth), your $31k cash investment doubles in ~10 years — after that, you're playing with house money.
Negotiation context
- It's been on market 52 days — a 3% lower offer ($107k) is reasonable based on typical stale-listing flexibility.
- Current owner paid $22k; list at $110k implies a 388% gain — meaningful room to come down on a strong offer.
Risks & watch-outs
- Climate carrying-cost: extreme-heat days projected 7→16/yr by 2055 (HVAC capex compounding) — expect insurance premiums to compound above CPI over the hold.
Questions for the listing agent
- It's been on market 52 days. Have you received any prior offers? Is the seller open to a 3% concession, seller financing, or rate buy-down credit?
- Is there a deadline driving the sale (1031 exchange, divorce, estate, relocation)? That informs how much negotiation room exists.
- Schools are F-rated, which usually means shorter tenancies and higher turnover. Who's the typical renter profile here, and what's been the actual vacancy rate?
- Crime grade is F in this area — have there been break-ins, vandalism, or insurance claims at this property in the last 3 years? What carrier currently insures it and at what premium?
- What's the average days-on-market for RENTAL listings here right now (not sales)? A rising rental-DOM trend means longer vacancies and softer asking-rent achievability than the comps imply.
- What's the recent tenant-quality profile in this submarket — average credit score on applications, eviction rate, late-payment / NSF rate, and stable-employment percentage? A property-management company in the area should have these aggregated.
- How much new for-sale + rental construction is in the pipeline within 1–3 miles? Heavy new supply typically softens prices + rents 12–24 months out; constrained supply supports both.
Investment metrics
- 1% rule
- 1.12% ✓
- Cap rate
- 9.69%
- Cash-on-cash
- 12.12%
- DSCR
- 1.54
- GRM
- 7.5
CMA / ARV
No comps found within radius.
Projected returns pro-forma
-3.0% appreciation · 3.0% rent growth · sell at horizon
- IRR
- 1.7%
- Equity multiple
- 1.06×
- Total profit
- $1,950
- Equity at exit
- $16,386
- IRR
- 11.2%
- Equity multiple
- 1.88×
- Total profit
- $27,021
- Equity at exit
- $9,502
Cash invested: $30,772 (down + closing). Projections, not guarantees.
Landlord ↔ Tenant lean methodology
- Overall (STATE)
- 90 Strongly Landlord-Friendly
- State South Carolina
- 90 Strongly Landlord-Friendly · R+6
- County
- — inherits STATE
- City
- — inherits STATE
ZIP-level market 29360
- Home prices YoY
- -23.7%
- Active inventory
- 153
- Price-to-rent
- 7.5×
Monthly cashflow live
- Estimated rent
- $1,228 medium interval (Pro) →
- Mortgage (P&I)
- −$576
- Tax from tax record
- −$37 /mo · $446/yr
- Insurance
- −$46
- HOA
- −$0
- Vacancy / Maint / Mgmt
- −$258
- Net cashflow
- $311
Break-even live
UW: 25.0% down · 7.5% · 30yr · 1.5% tax · 5.0% vac · 8.0% maint · 8.0% mgmt
Financing live
Cash to close
- Down payment
- $27,475
- Closing costs
- $3,297
- Reserves months
- —
- Total cash needed
- —
Loan-product check · same deal, 3 products live
Conventional
25% down · 7.5% · 30yr
- Down + closing
- —
- Monthly P&I
- —
- Monthly cashflow
- —
- DSCR
- —
- Eligible?
- —
Personal DTI + credit; lowest rate.
DSCR
20% down · 8.5% · 30yr
- Down + closing
- —
- Monthly P&I
- —
- Monthly cashflow
- —
- DSCR
- —
- Eligible?
- —
No personal income docs; deal must DSCR.
Hard money
10% down · 12.0% · 12mo
- Down + closing
- —
- Monthly P&I
- —
- Monthly cashflow
- —
- DSCR
- —
- Eligible?
- —
Short-term bridge; refi at stabilization.
Listing history 19 events
-
2026-06-19days on market $109,900 Active 52 DOM
-
2026-06-18days on market $109,900 Active 51 DOM
-
2026-06-17days on market $109,900 Active 50 DOM
-
2026-06-16days on market $109,900 Active 49 DOM
-
2026-06-15days on market $109,900 Active 48 DOM
-
2026-06-14days on market $109,900 Active 46 DOM
-
2026-06-12days on market $109,900 Active 45 DOM
-
2026-06-09days on market $109,900 Active 42 DOM
-
2026-06-08days on market $109,900 Active 41 DOM
-
2026-06-07days on market $109,900 Active 40 DOM
-
2026-06-07days on market $109,900 Active 39 DOM
-
2026-06-03days on market $109,900 Active 36 DOM
-
2026-06-02days on market $109,900 Active 35 DOM
-
2026-06-01days on market $109,900 Active 34 DOM
-
2026-05-31days on market $109,900 Active 33 DOM
-
2026-05-30days on market $109,900 Active 32 DOM
-
2026-05-19price $109,900
-
2026-04-28$129,000 Active
-
2024-11-25soldstatus $22,500
ⓘ Source: listings_history table (triggers on properties + properties_extension) + one-shot
backfill from property_details.listing_events for pre-trigger history.
Tax reassessment forecast SC · Resets to sale price
- Current annual tax
- $446 · $37/mo
- Projected year-2 tax
- $626 · $52/mo
- Expected delta
- +$180/yr (+$15/mo · 40.3%)
ⓘ Screening estimate from a state-policy table — verify with the county assessor before closing.
Climate risk First Street
- Flood 1/10 Low FEMA zone X (unshaded) · 0% chance over 30 yrs
- Wildfire 2/10 Low
- Heat 6/10 Major 7 d/yr ≥106°F today · 16 d/yr by 30 yrs out
- Wind 4/10 Moderate 8% chance of damaging wind over 30 yrs
- Air quality 3/10 Moderate 3 unhealthy d/yr today · 3 by 30 yrs out
Nearby sold comps map
Loading sold comps map…
Walkable amenities ~0.75 mi
Loading nearby amenities…
Taxation est. · year 1
- Rental income
- $14,738
- − Mortgage interest
- −$6,156
- − Property taxes
- −$446
- − Insurance
- −$550
- − Repairs & maintenance
- −$1,179
- − Management
- −$1,179
- − Depreciation
- −$3,197
- Taxable income
- $2,030
- Est. tax owed @ 24.0%
- −$487
- After-tax cash flow
- $3,244/yr
For passive investors: Depreciation is non-cash, so a rental often shows a tax loss while cash-flowing — sheltering income. Rental losses are passive: they offset passive income freely, and up to $25,000/yr can offset ordinary (W-2) income if you actively participate and your MAGI is under $100k (phasing out to $0 by $150k); unused losses carry forward. On sale, claimed depreciation is recaptured at up to 25%, and gains may owe capital-gains tax (a 1031 exchange can defer both). Figures are a year-1 estimate at your 24.0% rate — not tax advice; consult a CPA.
Schools (NCES district)
- District
- Laurens 55
- NCES district ID
- 4502610
- Math proficiency
- 20% ▼ -11.00%
- Reading proficiency
- 29% ▼ -7.00%
- Median HH income
- $39,174
- Composite
- 20.58/100
- National rank
- #8555
- State rank
- #63 of 80 in SC
Livability — Laurens
- Score
- 68/100
- State rank
- #79
- US rank
- #9104
Category grades
Schools grade is shown separately in the Schools card above.
Census & demographics
- Census place
- Laurens, SC
- City population
- 22,066
- Population (ZIP)
- 22,066
Population outlook (Laurens County) Hauer SSP2
- Today (2025)
- 66,741 people
- By 2030
- 66,454 · -0.4%
- By 2040
- 64,881 · -2.8%
- By 2050
- 61,941 · -7.2%
- By 2075
- 53,266 · -20.2%
- By 2100
- 41,495 · -37.8%
Race, ethnicity, and origin ACS 2023
- Neighborhood character
- Diverse neighborhood (Simpson 0.55)
- Race & ethnicity
- White 61% Black 26% Hispanic / Latino 7% Two or more races 5% Native American 2%
- Hispanic origin (detail)
- Mexican 3%
- Common ancestry
- Slovak 2% Danish 1% Serbian 1%
- Foreign-born
- 6% · Canada
- Languages at home
- 94% English-only · Spanish 4%
Political lean MEDSL · Laurens
- 2024 margin
- Solid R (+40.9) · D 29.0% · R 69.9% · Other 1.1%
- 2008→2024 swing
- -22.8pp toward R · 2008: -18.1pp · 2024: -40.9pp
- All cycles
- 2024: R+40.9 2020: R+32.3 2016: R+29.9 2012: R+17.5 2008: R+18.1
Not yet ingested
- Civics
- —
Market trends
- HPI YoY
- ▼ -60.09%
- Current HPI
- 193.5371
- Rent YoY
- —
- Metro
- —
- State GDP YoY
- ▲ 4.51%
- F500 in state
- 2
Industry mix (Fortune 500 HQ in SC)
| Industry | F500 HQs | Revenue |
|---|---|---|
| Packaging | 1 | $7B |
|
||
Price history
+388.4% since first listed3 events — show timeline
- 2026-05-19 Price Changed $109,900 Greater Greenville MLS
- 2026-04-28 Listed $129,000 Greater Greenville MLS
- 2024-11-25 Sold (Public Records) $22,500 Public Records
Property tax history
+8.2%/yrLatest (2025): $446 · +19.4% YoY. Source: county tax records.
Cash-flow waterfall
monthlySold comps — $/sqft
last 12 mo · ≤1 miLoading sold comps…