50 Cypress · Anaheim, CA
Flood risk 1/10 · Minimal
- FEMA flood zone
- X (shaded)
- Chance of flooding over 30 yrs
- 0.0%
- Est. flood insurance / yr
- $507 – $1,088
Fire risk 1/10 · Minimal
- Est. fire insurance / yr
- $659 – $1,223
Heat risk 6/10 · Moderate
- Hot days now (above 93°F)
- 7 days/yr
- Hot days in 30 yrs
- 22 days/yr
Wind risk 1/10 · Minimal
- Chance of severe wind over 30 yrs
- —
Air-quality risk 5/10 · Moderate
- Unhealthy air days now
- 7 days/yr
- Unhealthy air days in 30 yrs
- 9 days/yr
Risk factors via First Street. Map © Google.
Why this score? — see what drove the C+ grade
The composite is a weighted blend of 9 inputs, each scored 0–100. Each bar is that input's sub-score; the figure is the points it added to the 100-point composite (weight × sub-score).
- Cash flow +30.0/30.0
- DSCR +10.0/10.0
- 1% rule +8.8/10.0
- Rent growth +3.8/5.0
- Livability +3.5/5.0
- Condition / age +2.5/5.0
- Schools +2.3/10.0
- ARV discount +0.0/15.0
- Appreciation +0.0/10.0
$274,999
🖨 Deal sheet 📄 Offer letter ✓ Due diligence
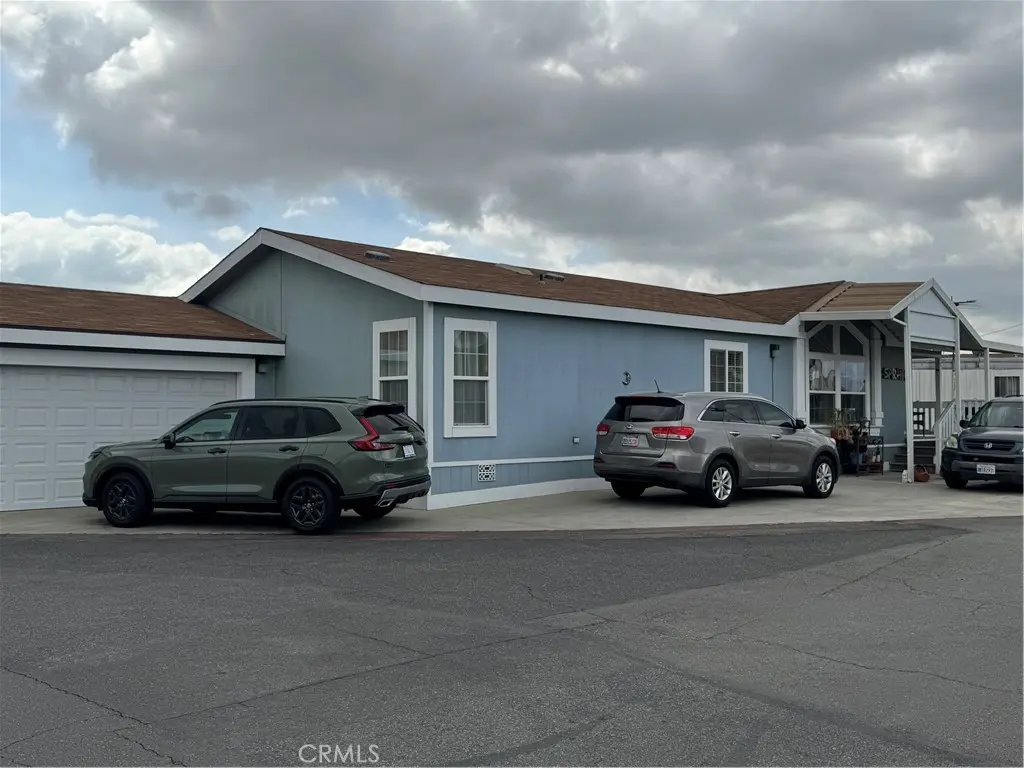
Listing remarks
Welcome to Rancho La Paz!, This is a beautifully maintained 3-bedroom, 2-bath manufactured home located in the desirable city of Anaheim. This inviting completely remodeled residence offers a perfect blend of comfort, style, and convenience—ideal for families or anyone seeking a relaxed Southern California lifestyle. Step inside to discover a bright and open floor plan with abundant natural light flowing through spacious living areas. The well-appointed kitchen features ample cabinetry, modern appliances, and plenty of counter space, making it perfect for both everyday living and entertaining. The adjoining dining area creates a warm, welcoming space for gatherings. The primary bedroo
Key facts
- 23.52 acre lot
- 2 garage spots
- Community pool
Property features AI
Finance
- Other: Directions: Orangethrope east of Lemon, 501 E Orangethrope Ave; Road access via city streets; paved road frontage
- Financial info: Monthly land lease amount applies
- HOA & community: Manager approval required for park residency; Breed restrictions for pets; Park name: Rancho La Paz; Urban community features; Land lease (park) applies
Exterior
- Parking: Attached garage with direct access; 2-car garage; 5 uncovered spaces (7 total parking spaces); Has parking
- Security: 24-hour security
- Utilities: District/public water; Public sewer; Natural gas connected; Electricity connected; Cable available; Telephone in street; Sewer connected; Standard electric
- Home design: Manufactured/mobile home (Oakmanor model); 27 ft wide by 56 ft long; Mobile home remains on site; Single-story; Entry faces front
- Construction: Clapboard construction; Pier jacks foundation; Year built per assessor
- Exterior features: Shingle roof; Clapboard siding; Cabana patio/porch; Community pool; Brick skirt; No perimeter fencing; 0–1 unit/acre lot
Interior
- Kitchen: Remodeled kitchen; Quartz counters; Refrigerator; Vented exhaust fan; Range/stove hood; Gas range; Gas oven
- Bedrooms: All bedrooms on main level
- Flooring: Laminate flooring
- Bathrooms: One full bath; One 3/4 bath; Separate tub and shower; Shower-in-tub and bathtub
- Heating & cooling: Central cooling
- Interior features: Quartz counters; Copper partial plumbing; High (9+ foot) ceilings; Ceiling fan; Open floor plan; Panel doors; One-level home; Front entry; Turnkey condition; 24-hour security; Community spa
- Laundry & utility: Washer included; Dryer included; Has laundry
Neighborhood map
What this means for you Summary
Snapshot
- This is a 3-bed/2.0-bath manufactured listed at $275k.
Deal economics
- At list price, monthly cash flow is $1k ($13k/yr) — positive.
- The deal already cash-flows at list — no discount required.
- Meets the 1% rule at list price ($4k rent vs $275k).
- Recommended offer: $271k (1.5% below list) — sets the bar for market timing.
- Cap rate 11.0% vs local median 2.2% in Anaheim — top-decile yield for the area; either an underpriced asset or a hidden risk that comps aren't pricing in. Stress-test before assuming the spread holds.
Location & tenants
- Location reads 70/100 on livability (#240 in CA) — a middle-class / working-renter tenant base. Strengths: amenities A+, commute A+, employment A+; Watch: health & safety C-, crime F, cost of living F.
- Anaheim Elementary (urban): math 25% / reading 25% proficiency, ranked #386 of 517 in CA (top 75%) — low school quality limits family demand, transient renter base, plan for 1-2y turnover; 73% free/reduced lunch — lower-income household profile, screen leases tightly.
- Market conditions: Rents rising fast (+5.1%/yr); 72 active listings in the ZIP; 22 comparable units currently listed for rent nearby; rentals leasing fast (median 2d on market — plan ~1-2 weeks tenant-placement turnaround); solid renter incomes; 6,974 units permitted in Orange County in 2024 (3,839 in 5+ unit buildings).
- At $3,784/mo this rent would consume 54% of the median local household income ($84k/yr) (locally 3604% of renters already pay >50% of income on rent) — very limited rent-growth headroom before tenants either downsize or default.
Forward outlook
- Local home prices are declining (-3.0%/yr); year-one equity from $2k of loan paydown is wiped out by about $8k of value loss. Plan a longer hold.
- Orange County population projected at +14% by 2050 — modest demand growth; plan on rents tracking national, not racing it.
- At projected returns (-3.0% appreciation + 5.1% rent growth), your $77k cash investment doubles in ~7 years — after that, you're playing with house money.
Negotiation context
- It's been on market 20 days — a 2% lower offer ($271k) is reasonable based on typical stale-listing flexibility.
Risks & watch-outs
- Climate carrying-cost: extreme-heat days projected 7→22/yr by 2055 (HVAC capex compounding) — expect insurance premiums to compound above CPI over the hold.
Questions for the listing agent
- Is there a deadline driving the sale (1031 exchange, divorce, estate, relocation)? That informs how much negotiation room exists.
- Crime grade is F in this area — have there been break-ins, vandalism, or insurance claims at this property in the last 3 years? What carrier currently insures it and at what premium?
- What's the average days-on-market for RENTAL listings here right now (not sales)? A rising rental-DOM trend means longer vacancies and softer asking-rent achievability than the comps imply.
- What's the recent tenant-quality profile in this submarket — average credit score on applications, eviction rate, late-payment / NSF rate, and stable-employment percentage? A property-management company in the area should have these aggregated.
- How much new for-sale + rental construction is in the pipeline within 1–3 miles? Heavy new supply typically softens prices + rents 12–24 months out; constrained supply supports both.
Investment metrics
- 1% rule
- 1.38% ✓
- Cap rate
- 11.04%
- Cash-on-cash
- 16.97%
- DSCR
- 1.76
- GRM
- 6.1
CMA / ARV
- ARV (on-the-fly)
- $214,500
- Comps found
- 12
Show comp detail 12 sales within ~0.75 mi
| Address | Dist | Beds/Ba | Sqft | Sold | Price | $/sf | Match |
|---|---|---|---|---|---|---|---|
| 39 Spruce Via | 0.11mi | 3/2.0 | 1,512 (+1%) | 0mo | $145,000 | $96 | 93 |
| 501 E Orangethorpe Ave #31 | 0.11mi | 3/2.0 | 1,440 (-4%) | 0mo | $250,000 | $174 | 88 |
| 21 Walnut Via | 0.13mi | 3/2.0 | 1,554 (+4%) | 7mo | $249,000 | $160 | 82 |
| 7 PINE Via | 0.24mi | 3/2.0 | 1,440 (-4%) | 2mo | $261,500 | $182 | 81 |
| 26 MAGNOLIA Via | 0.23mi | 3/2.0 | 1,440 (-4%) | 4mo | $205,500 | $143 | 80 |
| 49 Pine Via | 0.25mi | 3/2.0 | 1,530 (+2%) | 8mo | $250,000 | $163 | 78 |
| 13 MAGNOLIA Via | 0.22mi | 2/2.0 (-1) | 1,560 (+4%) | 7mo | $151,500 | $97 | 72 |
| 14 Palm Via | 0.31mi | 2/2.0 (-1) | 1,440 (-4%) | 5mo | $60,000 | $42 | 70 |
| 39 Pine Via Ave | 0.23mi | 2/2.0 (-1) | 1,368 (-9%) | 2mo | $140,000 | $102 | 68 |
| 16 Palm Via | 0.29mi | 2/2.0 (-1) | 1,400 (-7%) | 5mo | $124,900 | $89 | 66 |
| 7 Magnolia | 0.27mi | 2/2.0 (-1) | 1,344 (-10%) | 3mo | $140,000 | $104 | 63 |
| 1241 N East #216 | 0.72mi | 3/2.0 | 1,344 (-10%) | 1mo | $249,000 | $185 | 49 |
Match score weights: distance 35% · size 25% · config 20% · recency 20%. Top-matched comps best support the ARV.
Projected returns pro-forma
-3.0% appreciation · 5.13% rent growth · sell at horizon
- IRR
- 10.6%
- Equity multiple
- 1.43×
- Total profit
- $33,127
- Equity at exit
- $41,003
- IRR
- 21.4%
- Equity multiple
- 3.00×
- Total profit
- $153,876
- Equity at exit
- $23,777
Cash invested: $77,000 (down + closing). Projections, not guarantees.
Landlord ↔ Tenant lean methodology
- Overall (STATE)
- 18 Strongly Tenant-Friendly
- State California
- 18 Strongly Tenant-Friendly · D+13
- County
- — inherits STATE
- City
- — inherits STATE
ZIP-level market 92801
- Rents YoY
- 5.1%
- Active inventory
- 72
- Price-to-rent
- 6.1×
Monthly cashflow live
- Estimated rent
- $3,784 high interval (Pro) →
- Mortgage (P&I)
- −$1,442
- Tax est. 1.5%
- −$344 /mo · $4,125/yr
- Insurance
- −$115
- HOA
- −$0
- Vacancy / Maint / Mgmt
- −$795
- Net cashflow
- $1,089
Break-even live
UW: 25.0% down · 7.5% · 30yr · 1.5% tax · 5.0% vac · 8.0% maint · 8.0% mgmt
Financing live
Cash to close
- Down payment
- $68,750
- Closing costs
- $8,250
- Reserves months
- —
- Total cash needed
- —
Loan-product check · same deal, 3 products live
Conventional
25% down · 7.5% · 30yr
- Down + closing
- —
- Monthly P&I
- —
- Monthly cashflow
- —
- DSCR
- —
- Eligible?
- —
Personal DTI + credit; lowest rate.
DSCR
20% down · 8.5% · 30yr
- Down + closing
- —
- Monthly P&I
- —
- Monthly cashflow
- —
- DSCR
- —
- Eligible?
- —
No personal income docs; deal must DSCR.
Hard money
10% down · 12.0% · 12mo
- Down + closing
- —
- Monthly P&I
- —
- Monthly cashflow
- —
- DSCR
- —
- Eligible?
- —
Short-term bridge; refi at stabilization.
Rent comps 22 comps
| Address | Beds | Baths | Sqft | Rent | $/sqft | DOM | Units | Dist |
|---|---|---|---|---|---|---|---|---|
| 251 Orangefair Ave Fullerton, CA | 2.0 | 1.0–2.0 | 966 | $3,916 | $4.05 | 1d | 27 | 0.51mi |
| 410 S Lemon St Unit B Fullerton, CA | 4.0 | 1.0 | 1800 | $2,200 | $1.22 | 6d | 1 | 0.56mi |
| 124 N Princeton Ave Fullerton, CA | 3.0 | 2.0 | 1119 | $3,500 | $3.13 | 24d | 1 | 0.71mi |
| 325 E Amerige Ave Fullerton, CA | 3.0 | 2.0 | 1325 | $3,500 | $2.64 | 1d | 1 | 0.80mi |
| 325 E Amerige Ave Unit A Fullerton, CA | 3.0 | 2.0 | 1325 | $3,500 | $2.64 | 5d | 1 | 0.80mi |
| 229 E Commonwealth Ave Fullerton, CA | 3.0 | 1.0–3.0 | 1126 | $4,409 | $3.91 | 1d | 8 | 0.81mi |
| 125 W Valencia Dr Unit A Fullerton, CA | 3.0 | 1.0 | 1100 | $3,500 | $3.18 | 1d | 1 | 0.81mi |
| 1134 E Whiting Ave Fullerton, CA | 2.0 | 1.5 | 1157 | $3,500 | $3.03 | 7d | 1 | 0.89mi |
| 155 W La Palma Ave #4 Anaheim, CA | 3.0 | 2.5 | 1673 | $4,300 | $2.57 | 1d | 1 | 0.99mi |
| 130 E Chapman Ave Fullerton, CA | 1.0–2.0 | 1.0–2.0 | 910 | $2,644 | $2.91 | 1d | 4 | 1.02mi |
| 1096 N Ivory Palm Ln Anaheim, CA | 3.0 | 2.5 | 1406 | $4,200 | $2.99 | 1d | 1 | 1.03mi |
| 527 W Victor Ave Anaheim, CA | 3.0 | 3.0 | 1420 | $13,200 | $9.30 | 1d | 1 | 1.05mi |
| 141 W Wilshire Ave Fullerton, CA | 1.0–2.0 | 1.0–2.5 | 910 | $3,187 | $3.50 | 1d | 6 | 1.09mi |
| 853 N Zeyn St Anaheim, CA | 2.0 | 1.0 | 1862 | $3,500 | $1.88 | 1d | 1 | 1.10mi |
| 1410 Central Ave Fullerton, CA | 4.0 | 2.0 | 1920 | $5,600 | $2.92 | 17d | 1 | 1.14mi |
| 1410 Central Ave Fullerton, CA | 4.0 | 2.0 | 1920 | $4,750 | $2.47 | 11d | 1 | 1.14mi |
| 1024 W Romneya Dr Anaheim, CA | 2.0–3.0 | 2.0 | 1241 | $4,795 | $3.86 | 1d | 10 | 1.28mi |
| 331 W Whiting Ave Fullerton, CA | 3.0 | 1.0 | 1490 | $2,350 | $1.58 | 10d | 1 | 1.31mi |
| 1424 Riverside Dr Unit NA Fullerton, CA | 3.0 | 2.0 | 1578 | $4,500 | $2.85 | 10d | 1 | 1.39mi |
| 800 N Janss St Anaheim, CA | 4.0 | 2.0 | 1450 | $4,500 | $3.10 | 1d | 1 | 1.41mi |
| 600 W Commonwealth Ave Fullerton, CA | 3.0 | 1.0–2.0 | 1002 | $4,564 | $4.55 | 1d | 18 | 1.44mi |
| 1112 Riedel Ave Fullerton, CA | 3.0 | 2.0 | 1424 | $4,450 | $3.12 | 1d | 1 | 1.48mi |
Listing history 18 events
-
2026-06-18days on market $274,999 Active 20 DOM
-
2026-06-17days on market $274,999 Active 19 DOM
-
2026-06-16days on market $274,999 Active 18 DOM
-
2026-06-15days on market $274,999 Active 17 DOM
-
2026-06-13days on market $274,999 Active 15 DOM
-
2026-06-13days on market $274,999 Active 14 DOM
-
2026-06-09days on market $274,999 Active 11 DOM
-
2026-06-08days on market $274,999 Active 10 DOM
-
2026-06-07pricedays on market $274,999 Active 9 DOM
-
2026-06-04pricedays on market $299,900 Active 6 DOM
-
2026-06-03days on market $300,000 Active 5 DOM
-
2026-06-02days on market $300,000 Active 4 DOM
-
2026-06-01days on market $300,000 Active 3 DOM
-
2026-05-31days on market $300,000 Active 2 DOM
-
2026-05-17historical $300,000
-
2020-04-30historical
-
2020-03-27price $229,990
-
2019-10-21$239,000 Active
ⓘ Source: listings_history table (triggers on properties + properties_extension) + one-shot
backfill from property_details.listing_events for pre-trigger history.
Climate risk First Street
- Flood 1/10 Low FEMA zone X (shaded) · 0% chance over 30 yrs
- Wildfire 1/10 Low
- Heat 6/10 Major 7 d/yr ≥93°F today · 22 d/yr by 30 yrs out
- Wind 1/10 Low
- Air quality 5/10 Major 7 unhealthy d/yr today · 9 by 30 yrs out
Nearby sold comps map
Loading sold comps map…
Walkable amenities ~0.75 mi
Loading nearby amenities…
Taxation est. · year 1
- Rental income
- $45,407
- − Mortgage interest
- −$15,404
- − Property taxes
- −$4,125
- − Insurance
- −$1,375
- − Repairs & maintenance
- −$3,633
- − Management
- −$3,633
- − Depreciation
- −$8,000
- Taxable income
- $9,238
- Est. tax owed @ 24.0%
- −$2,217
- After-tax cash flow
- $10,849/yr
For passive investors: Depreciation is non-cash, so a rental often shows a tax loss while cash-flowing — sheltering income. Rental losses are passive: they offset passive income freely, and up to $25,000/yr can offset ordinary (W-2) income if you actively participate and your MAGI is under $100k (phasing out to $0 by $150k); unused losses carry forward. On sale, claimed depreciation is recaptured at up to 25%, and gains may owe capital-gains tax (a 1031 exchange can defer both). Figures are a year-1 estimate at your 24.0% rate — not tax advice; consult a CPA.
Schools (NCES district)
- District
- Anaheim Elementary
- NCES district ID
- 0602610
- Math proficiency
- 25% ▼ -3.00%
- Reading proficiency
- 25% ▼ -9.00%
- Median HH income
- $55,235
- Composite
- 22.56/100
- National rank
- #8078
- State rank
- #386 of 517 in CA
Livability — Anaheim
- Score
- 70/100
- State rank
- #240
- US rank
- #7861
Category grades
Schools grade is shown separately in the Schools card above.
Census & demographics
- Census place
- Anaheim, CA
- County
- Orange County · 3,096,323 people
- City population
- 361,715
- Metro
- Los Angeles-Long Beach-Anaheim, CA
- Population (ZIP)
- 60,547
- Household income
- $83,725
- Rent vs Own
- Severe rent burden
- 3604.0
Population outlook (Orange County) Hauer SSP2
- Today (2025)
- 3,477,456 people
- By 2030
- 3,613,117 · +3.9%
- By 2040
- 3,835,945 · +10.3%
- By 2050
- 3,968,736 · +14.1%
- By 2075
- 4,097,053 · +17.8%
- By 2100
- 3,903,633 · +12.3%
Race, ethnicity, and origin ACS 2023
- Neighborhood character
- Diverse neighborhood (Simpson 0.59)
- Race & ethnicity
- Hispanic / Latino 59% Two or more races 19% Asian 19% White 16% Black 4%
- Hispanic origin (detail)
- Mexican 50%
- Common ancestry
- Russian 1% Lithuanian 1%
- Foreign-born
- 41% · Canada, Vietnam, South Korea
- Languages at home
- 30% English-only · Spanish 48% Tagalog/Filipino 5% Vietnamese 5%
Political lean MEDSL · Orange
- 2024 margin
- Toss-up / Even · D 49.7% · R 47.1% · Other 3.2%
- 2008→2024 swing
- +5.2pp toward D · 2008: -2.6pp · 2024: 2.6pp
- All cycles
- 2024: D+2.6 2020: D+9.0 2016: D+7.7 2012: R+8.3 2008: R+2.6
Not yet ingested
- Civics
- —
Market trends
- HPI YoY
- ▼ -723.92%
- Current HPI
- 446.9118
- Rent YoY
- ▲ 5.13%
- Metro
- Los Angeles-Long Beach-Anaheim, CA
- State GDP YoY
- ▲ 3.21%
- F500 in state
- 116
Industry mix (Fortune 500 HQ in CA)
| Industry | F500 HQs | Revenue |
|---|---|---|
| Technology | 27 | $1,492B |
|
||
| Financial Services | 3 | $174B |
|
||
| Retail | 3 | $44B |
|
||
| Insurance | 3 | $26B |
|
||
| Media / Entertainment | 2 | $115B |
|
||
| Pharmaceuticals / Biotech | 2 | $62B |
|
||
Price history
+25.5% since first listed4 events — show timeline
- 2026-05-17 Coming Soon $300,000 CRMLS
- 2020-04-30 Listing Removed — CRMLS
- 2020-03-27 Price Changed $229,990 CRMLS
- 2019-10-21 Listed $239,000 CRMLS
Property tax history
-1.8%/yrLatest (2025): $466 · +3.4% YoY. Source: county tax records.
Cash-flow waterfall
monthlySold comps — $/sqft
last 12 mo · ≤1 miLoading sold comps…