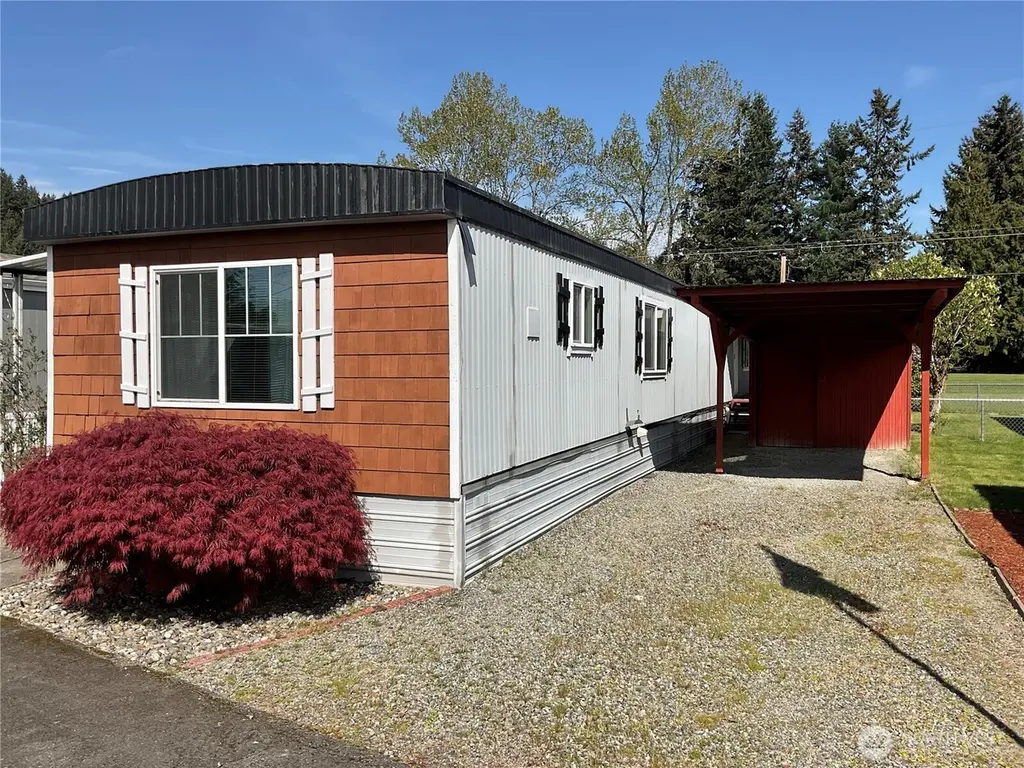
5629 113th Ave E #64 · North Puyallup, WA
Flood risk 4/10 · Minor
- FEMA flood zone
- X (unshaded)
- Chance of flooding over 30 yrs
- 0.21%
- Est. flood insurance / yr
- $507 – $1,088
Fire risk 1/10 · Minimal
- Est. fire insurance / yr
- $604 – $1,122
Heat risk 3/10 · Minor
- Hot days now (above 89°F)
- 7 days/yr
- Hot days in 30 yrs
- 15 days/yr
Wind risk 1/10 · Minimal
- Chance of severe wind over 30 yrs
- —
Air-quality risk 7/10 · Major
- Unhealthy air days now
- 11 days/yr
- Unhealthy air days in 30 yrs
- 12 days/yr
Risk factors via First Street. Map © Google.
Why this score? — see what drove the A- grade
The composite is a weighted blend of 9 inputs, each scored 0–100. Each bar is that input's sub-score; the figure is the points it added to the 100-point composite (weight × sub-score).
- Cash flow +30.0/30.0
- ARV discount +15.0/15.0
- 1% rule +10.0/10.0
- DSCR +10.0/10.0
- Schools +5.4/10.0
- Livability +4.2/5.0
- Rent growth +3.6/5.0
- Condition / age +2.5/5.0
- Appreciation +0.0/10.0
$62,500
🖨 Deal sheet 📄 Offer letter ✓ Due diligence
Listing remarks
Welcome Home! Located in the friendly 55+ Town & Country community, this charming residence offers easy, low-maintenance living. This charming 2-bed, 1-bath home in a 55+ community is move-in ready, with pride of ownership evident throughout. It features a large main bedroom with 2 closets and a 2nd bedroom . Outside you'll find a covered deck to enjoy - a covered carport and storage. Huge grassy field right behind the home . Live in comfort in all the seasons with the heat pump that works great ! shed provide extra storage shed . This active 55+ community includes a clubhouse, and a small pet is welcome! As a bonus, all appliances stay!
Key facts
- Covered deck
- Clubhouse
- Covered carport
Tags
Neighborhood map
What this means for you Summary
Snapshot
- This is a 2-bed/1.0-bath manufactured listed at $62k.
Deal economics
- At list price, monthly cash flow is $1k ($13k/yr) — positive.
- The deal already cash-flows at list — no discount required.
- Meets the 1% rule at list price ($2k rent vs $62k).
- Recommended offer: $61k (3.0% below list) — sets the bar for market timing.
Location & tenants
- Location reads 85/100 on livability (#25 in WA, #468 nationally) — a professional / high-income tenant draw. Strengths: crime A+, amenities A+, housing A+; Watch: employment C-.
- Puyallup School District (suburban): math 53% / reading 66% proficiency, ranked #52 of 291 in WA (top 18%) — acceptable for families but not a draw, mixed tenant base, ~2y average lease.
- Market conditions: Rents rising fast (+4.5%/yr); 167 active listings in the ZIP; 29 comparable units currently listed for rent nearby; rentals at typical pace (median 22d on market — plan ~3-4 weeks tenant-placement turnaround); solid renter incomes; 3,209 units permitted in Pierce County in 2024 (1,269 in 5+ unit buildings).
Forward outlook
- Local home prices are declining (-3.0%/yr); year-one equity from $432 of loan paydown is wiped out by about $2k of value loss. Plan a longer hold.
- Pierce County population projected at +26% by 2050 — long-run rental-demand tailwind backs the buy-and-hold thesis.
- At projected returns (-3.0% appreciation + 4.5% rent growth), your $18k cash investment doubles in ~2 years — after that, you're playing with house money.
Negotiation context
- It's been on market 57 days — a 3% lower offer ($61k) is reasonable based on typical stale-listing flexibility.
- 4 sale attempts since 13y ago with the ask held roughly flat each time — persistent listings suggest the price (not the market) is what's stuck; bring a comps-based counter.
- Current owner paid $45k; 39% above their basis — modest negotiation headroom, anchor on the comps not their cost.
Questions for the listing agent
- It's been on market 57 days. Have you received any prior offers? Is the seller open to a 3% concession, seller financing, or rate buy-down credit?
- Built in 1977 — when were the roof, HVAC, electrical panel, plumbing, and water heater last replaced?
- Is there a deadline driving the sale (1031 exchange, divorce, estate, relocation)? That informs how much negotiation room exists.
- What's the average days-on-market for RENTAL listings here right now (not sales)? A rising rental-DOM trend means longer vacancies and softer asking-rent achievability than the comps imply.
- What's the recent tenant-quality profile in this submarket — average credit score on applications, eviction rate, late-payment / NSF rate, and stable-employment percentage? A property-management company in the area should have these aggregated.
- How much new for-sale + rental construction is in the pipeline within 1–3 miles? Heavy new supply typically softens prices + rents 12–24 months out; constrained supply supports both.
Investment metrics
- 1% rule
- 3.10% ✓
- Cap rate
- 27.74%
- Cash-on-cash
- 76.61%
- DSCR
- 4.41
- GRM
- 2.7
CMA / ARV
- ARV (median comp)
- $84,950
- List price
- $62,500
- Delta
- -26.43%
- Verdict
- UNDERPRICED
- Comps
- 15 within 1.0 mi
Show comp detail 12 sales within ~0.75 mi
| Address | Dist | Beds/Ba | Sqft | Sold | Price | $/sf | Match |
|---|---|---|---|---|---|---|---|
| 5718 112th Avenue Ct E #37 | 0.07mi | 2/2.0 | 900 (-3%) | 4mo | $125,000 | $139 | 85 |
| 5620 112th Avenue Ct E #23 | 0.05mi | 3/1.0 (+1) | 924 (0%) | 9mo | $18,500 | $20 | 85 |
| 5606 112th Avenue Ct E #15 | 0.07mi | 2/2.0 | 924 (0%) | 12mo | $85,000 | $92 | 83 |
| 5711 112th Avenue Ct E #30 | 0.05mi | 2/2.0 | 840 (-9%) | 2mo | $125,000 | $149 | 77 |
| 5514 112th Avenue Ct E #3 | 0.10mi | 2/2.0 | 840 (-9%) | 3mo | $134,900 | $161 | 74 |
| 10713 61st St E Unit 108A | 0.41mi | 2/1.0 | 920 (-0%) | 12mo | $95,000 | $103 | 70 |
| 5520 112th Avenue Ct E #7 | 0.10mi | 2/1.0 | 840 (-9%) | 14mo | $35,000 | $42 | 69 |
| 5705 113th Ave E #68 | 0.11mi | 3/2.0 (+1) | 1,008 (+9%) | 10mo | $62,000 | $62 | 63 |
| 10601 61st St E #117 | 0.45mi | 3/2.0 (+1) | 924 (0%) | 11mo | $60,000 | $65 | 60 |
| 10522 60th Street Ct E | 0.46mi | 2/2.0 | 1,056 (+14%) | 3mo | $84,950 | $80 | 49 |
| 10805 62nd Street Ct E #3 | 0.45mi | 2/2.0 | 1,060 (+15%) | 8mo | $94,000 | $89 | 44 |
| 10515 60th Street Ct E #165 | 0.46mi | 2/2.0 | 1,052 (+14%) | 11mo | $30,000 | $29 | 42 |
Match score weights: distance 35% · size 25% · config 20% · recency 20%. Top-matched comps best support the ARV.
Projected returns pro-forma
-3.0% appreciation · 4.46% rent growth · sell at horizon
- IRR
- 78.2%
- Equity multiple
- 4.65×
- Total profit
- $63,928
- Equity at exit
- $9,319
- IRR
- 82.1%
- Equity multiple
- 10.12×
- Total profit
- $159,551
- Equity at exit
- $5,404
Cash invested: $17,500 (down + closing). Projections, not guarantees.
Landlord ↔ Tenant lean methodology
- Overall (STATE)
- 28 Tenant-Leaning
- State Washington
- 28 Tenant-Leaning · D+8
- County
- — inherits STATE
- City
- — inherits STATE
ZIP-level market 98372
- Rents YoY
- 4.5%
- Active inventory
- 167
- Price-to-rent
- 2.7×
Monthly cashflow live
- Estimated rent
- $1,935 high interval (Pro) →
- Mortgage (P&I)
- −$328
- Tax from tax record
- −$58 /mo · $694/yr
- Insurance
- −$26
- HOA
- −$0
- Vacancy / Maint / Mgmt
- −$406
- Net cashflow
- $1,117
Break-even live
UW: 25.0% down · 7.5% · 30yr · 1.5% tax · 5.0% vac · 8.0% maint · 8.0% mgmt
Financing live
Cash to close
- Down payment
- $15,625
- Closing costs
- $1,875
- Reserves months
- —
- Total cash needed
- —
Loan-product check · same deal, 3 products live
Conventional
25% down · 7.5% · 30yr
- Down + closing
- —
- Monthly P&I
- —
- Monthly cashflow
- —
- DSCR
- —
- Eligible?
- —
Personal DTI + credit; lowest rate.
DSCR
20% down · 8.5% · 30yr
- Down + closing
- —
- Monthly P&I
- —
- Monthly cashflow
- —
- DSCR
- —
- Eligible?
- —
No personal income docs; deal must DSCR.
Hard money
10% down · 12.0% · 12mo
- Down + closing
- —
- Monthly P&I
- —
- Monthly cashflow
- —
- DSCR
- —
- Eligible?
- —
Short-term bridge; refi at stabilization.
Rent comps 29 comps
| Address | Beds | Baths | Sqft | Rent | $/sqft | DOM | Units | Dist |
|---|---|---|---|---|---|---|---|---|
| 5517 108th Avenue Ct E Unit 5517 Puyallup, WA | 2.0 | 1.0 | 864 | $1,725 | $2.00 | 43d | 1 | 0.30mi |
| 4908 110th Avenue Ct E #3 Edgewood, WA | 3.0 | 2.0 | 1058 | $2,395 | $2.26 | 12d | 1 | 0.48mi |
| 4908 110th Ave Ct E Edgewood, WA | 3.0 | 2.0 | 1100 | $2,395 | $2.18 | 18d | 1 | 0.48mi |
| 4729 114th Ave E Edgewood, WA | 2.0 | 1.0 | 800 | $1,995 | $2.49 | 20d | 1 | 0.51mi |
| 4727 114th Ave E Edgewood, WA | 2.0 | 1.0 | 800 | $1,995 | $2.49 | 20d | 1 | 0.52mi |
| 4824 110th Avenue Ct E Edgewood, WA | 1.0–2.0 | 1.0 | 775 | $2,050 | $2.65 | 4d | 3 | 0.53mi |
| 407 Valley Ave NE Puyallup, WA | 1.0–3.0 | 1.0–2.0 | 923 | $2,062 | $2.23 | 43d | 1 | 0.53mi |
| 10710 48th St E Unit A Edgewood, WA | 2.0 | 1.0 | 898 | $2,295 | $2.56 | 43d | 1 | 0.63mi |
| 1027 N Meridian Puyallup, WA | 1.0–2.0 | 1.0 | 782 | $1,795 | $2.29 | 4d | 6 | 0.69mi |
| 721 2nd Ave NE Puyallup, WA | 2.0 | 1.5 | 1000 | $1,895 | $1.90 | 24d | 1 | 0.92mi |
| 719 2nd Ave NE Apt 2 Puyallup, WA | 2.0 | 1.5 | 1000 | $1,895 | $1.90 | 4d | 1 | 0.92mi |
| 735 2nd St NW Unit 1 Puyallup, WA | 2.0 | 1.0 | 837 | $1,695 | $2.03 | 21d | 1 | 0.93mi |
| 1617 E Main Puyallup, WA | 1.0–2.0 | 1.0–2.0 | 930 | $2,151 | $2.31 | 1d | 30 | 0.93mi |
| 501 2nd Ave NE Puyallup, WA | 1.0–2.0 | 1.0–2.0 | 1506 | $2,299 | $1.53 | 43d | 17 | 0.93mi |
| 501 2nd St NE Puyallup, WA | 1.0–2.0 | 1.0–2.0 | 850 | $2,299 | $2.70 | 4d | 11 | 0.93mi |
| 120 5th St NE Unit 1 Puyallup, WA | 1.0 | 1.0 | 726 | $1,595 | $2.20 | 43d | 1 | 1.02mi |
| 129 5th Ave NW Puyallup, WA | 1.0 | 1.0 | 650 | $1,949 | $3.00 | 4d | 1 | 1.05mi |
| 311 2nd St NE Unit 03 Puyallup, WA | 1.0 | 1.0 | 620 | $1,145 | $1.85 | 23d | 1 | 1.05mi |
| 344 7th St SE Puyallup, WA | 2.0 | 1.0 | 800 | $1,650 | $2.06 | 43d | 2 | 1.23mi |
| 344 7th St SE Puyallup, WA | 2.0 | 1.0 | 800 | $1,622 | $2.03 | 3d | 2 | 1.23mi |
| 344 7th St SE Unit 20 Puyallup, WA | 2.0 | 1.0 | 800 | $1,650 | $2.06 | 24d | 1 | 1.23mi |
| 344 7th St SE Unit 8 Puyallup, WA | 2.0 | 1.0 | 800 | $1,595 | $1.99 | 24d | 1 | 1.23mi |
| 602 5th Ave NW Unit A Puyallup, WA | 1.0 | 1.0 | 650 | $1,545 | $2.38 | 21d | 1 | 1.28mi |
| 336 3rd St SE Puyallup, WA | 2.0 | 1.0 | 630 | $1,700 | $2.70 | 24d | 1 | 1.30mi |
| 516 16th St SE Puyallup, WA | 2.0 | 1.0 | 950 | $1,895 | $1.99 | 24d | 1 | 1.31mi |
| 803 9th St NW Unit 803 Puyallup, WA | 2.0 | 1.0 | 800 | $1,775 | $2.22 | 20d | 1 | 1.36mi |
| 112 5th St SW Puyallup, WA | 2.0 | 1.0 | 585 | $1,400 | $2.39 | 24d | 1 | 1.39mi |
| 1218 7th Ave SE Unit 1208 Puyallup, WA | 2.0 | 1.0 | 885 | $2,145 | $2.42 | 24d | 1 | 1.42mi |
| 3107 E Main Ave Puyallup, WA | 1.0–3.0 | 1.0–2.0 | 963 | $2,106 | $2.19 | 1d | 30 | 1.46mi |
Listing history 24 events
-
2026-06-18days on market $62,500 Active 57 DOM
-
2026-06-17days on market $62,500 Active 56 DOM
-
2026-06-16days on market $62,500 Active 55 DOM
-
2026-06-15days on market $62,500 Active 54 DOM
-
2026-06-13days on market $62,500 Active 52 DOM
-
2026-06-13days on market $62,500 Active 51 DOM
-
2026-06-09days on market $62,500 Active 48 DOM
-
2026-06-08days on market $62,500 Active 47 DOM
-
2026-06-07days on market $62,500 Active 46 DOM
-
2026-06-04days on market $62,500 Active 43 DOM
-
2026-06-03days on market $62,500 Active 42 DOM
-
2026-06-02days on market $62,500 Active 41 DOM
-
2026-06-01days on market $62,500 Active 40 DOM
-
2026-05-31days on market $62,500 Active 39 DOM
-
2026-04-22$62,500 Active
-
2021-04-13soldstatus $45,000 Sold
-
2021-03-31status Pending
-
2021-03-08status Active
-
2021-03-06status Pending Inspection
-
2021-03-01$49,000 Active
-
2013-05-10historical
-
2013-05-09soldstatus $12,000 Sold
-
2013-05-04status Pending
-
2013-03-23$12,500 Active
ⓘ Source: listings_history table (triggers on properties + properties_extension) + one-shot
backfill from property_details.listing_events for pre-trigger history.
Tax reassessment forecast WA · Resets to sale price
- Current annual tax
- $694 · $58/mo
- Projected year-2 tax
- $694 · $58/mo
- Expected delta
- $0/yr ($0/mo · 0.0%)
ⓘ Screening estimate from a state-policy table — verify with the county assessor before closing.
Climate risk First Street
- Flood 4/10 Moderate FEMA zone X (unshaded) · 21% chance over 30 yrs
- Wildfire 1/10 Low
- Heat 3/10 Moderate 7 d/yr ≥89°F today · 15 d/yr by 30 yrs out
- Wind 1/10 Low
- Air quality 7/10 Severe 11 unhealthy d/yr today · 12 by 30 yrs out
Nearby sold comps map
Loading sold comps map…
Walkable amenities ~0.75 mi
Loading nearby amenities…
Taxation est. · year 1
- Rental income
- $23,223
- − Mortgage interest
- −$3,501
- − Property taxes
- −$694
- − Insurance
- −$312
- − Repairs & maintenance
- −$1,858
- − Management
- −$1,858
- − Depreciation
- −$1,818
- Taxable income
- $13,181
- Est. tax owed @ 24.0%
- −$3,164
- After-tax cash flow
- $10,243/yr
For passive investors: Depreciation is non-cash, so a rental often shows a tax loss while cash-flowing — sheltering income. Rental losses are passive: they offset passive income freely, and up to $25,000/yr can offset ordinary (W-2) income if you actively participate and your MAGI is under $100k (phasing out to $0 by $150k); unused losses carry forward. On sale, claimed depreciation is recaptured at up to 25%, and gains may owe capital-gains tax (a 1031 exchange can defer both). Figures are a year-1 estimate at your 24.0% rate — not tax advice; consult a CPA.
Schools (NCES district)
- District
- Puyallup School District
- NCES district ID
- 5306960
- Math proficiency
- 53% ▬ 0.00%
- Reading proficiency
- 66% ▬ 0.00%
- Median HH income
- $68,291
- Composite
- 54.01/100
- National rank
- #3006
- State rank
- #52 of 291 in WA
Livability — North Puyallup
- Score
- 85/100
- State rank
- #25
- US rank
- #468
Category grades
Schools grade is shown separately in the Schools card above.
Census & demographics
- Census place
- North Puyallup, WA
- County
- Pierce County · 788,257 people
- Metro
- Seattle-Tacoma-Bellevue, WA
- Population (ZIP)
- 26,012
- Household income
- $98,152
- Rent vs Own
- Severe rent burden
- 871.0
Population outlook (Pierce County) Hauer SSP2
- Today (2025)
- 956,648 people
- By 2030
- 1,010,862 · +5.7%
- By 2040
- 1,113,170 · +16.4%
- By 2050
- 1,206,524 · +26.1%
- By 2075
- 1,436,425 · +50.2%
- By 2100
- 1,563,654 · +63.5%
Race, ethnicity, and origin ACS 2023
- Neighborhood character
- Predominantly White (73%)
- Race & ethnicity
- White 73% Two or more races 10% Hispanic / Latino 8% Asian 6% Black 3% Pacific Islander 1%
- Hispanic origin (detail)
- Mexican 5% Puerto Rican 1%
- Common ancestry
- Lithuanian 4% Romanian 4% Subsaharan African 3%
- Foreign-born
- 13% · Canada, South Korea, China
- Languages at home
- 81% English-only · Russian/Polish/Slavic 5% Spanish 4% Other Asian/Pacific 3%
Political lean MEDSL · Pierce
- 2024 margin
- D (+10.8) · D 53.9% · R 43.1% · Other 3.0%
- 2008→2024 swing
- -1.4pp toward R · 2008: 12.2pp · 2024: 10.8pp
- All cycles
- 2024: D+10.8 2020: D+11.2 2016: D+7.5 2012: D+11.0 2008: D+12.2
Not yet ingested
- Civics
- —
Market trends
- HPI YoY
- ▼ -283.81%
- Current HPI
- 309.7871
- Rent YoY
- ▲ 4.46%
- Metro
- Seattle-Tacoma-Bellevue, WA
- State GDP YoY
- ▲ 4.65%
- F500 in state
- 22
Industry mix (Fortune 500 HQ in WA)
| Industry | F500 HQs | Revenue |
|---|---|---|
| Retail | 2 | $269B |
|
||
| Technology / Retail | 1 | $638B |
|
||
| Technology | 1 | $245B |
|
||
| Telecommunications | 1 | $38B |
|
||
| Food / Beverage | 1 | $36B |
|
||
| Automotive / Trucks | 1 | $34B |
|
||
Price history
+400.0% since first listed10 events — show timeline
- 2026-04-22 Listed $62,500 NWMLS as Distributed by MLS Grid
- 2021-04-13 Sold (MLS) $45,000 NWMLS as Distributed by MLS Grid
- 2021-03-31 Pending — NWMLS as Distributed by MLS Grid
- 2021-03-08 Relisted — NWMLS as Distributed by MLS Grid
- 2021-03-06 Pending — NWMLS as Distributed by MLS Grid
- 2021-03-01 Listed $49,000 NWMLS as Distributed by MLS Grid
- 2013-05-10 Delisted — NWMLS as Distributed by MLS Grid
- 2013-05-09 Sold (MLS) $12,000 NWMLS as Distributed by MLS Grid
- 2013-05-04 Pending — NWMLS as Distributed by MLS Grid
- 2013-03-23 Listed $12,500 NWMLS as Distributed by MLS Grid
Property tax history
+14.3%/yrLatest (2026): $694 · +17.8% YoY. Source: county tax records.
Cash-flow waterfall
monthlySold comps — $/sqft
last 12 mo · ≤1 miLoading sold comps…